Change in weight and waist circumference and risk of colorectal cancer: Results from the melbourne collaborative cohort study
Bạn đang xem bản rút gọn của tài liệu. Xem và tải ngay bản đầy đủ của tài liệu tại đây (547.37 KB, 7 trang )
Karahalios et al. BMC Cancer (2016) 16:157
DOI 10.1186/s12885-016-2144-1
RES EARCH A RT ICL E
Open Access
Change in weight and waist
circumference and risk of colorectal cancer:
results from the Melbourne Collaborative
Cohort Study
Amalia Karahalios1* , Julie A. Simpson1,2 , Laura Baglietto1,2,3,4 , Robert J. MacInnis2 , Allison M. Hodge2 ,
Graham G. Giles1,2 and Dallas R. English1,2
Abstract
Background: Studies reporting the association between change in weight or body mass index during midlife and
risk of colorectal cancer have found inconsistent results, and only one study to date has reported the association
between change in waist circumference (a measure of central adiposity) and risk of colorectal cancer.
Methods: We investigated the association between risk of colorectal cancer and changes in directly measured waist
circumference and weight from baseline (1990-1994) to wave 2 (2003-2007). Cox regression, with age as the time
metric and follow-up starting at wave 2, adjusted for covariates selected from a causal model, was used to estimate
the Hazard Ratios (HRs) and 95 % Confidence Intervals (CIs) for the change in waist circumference and weight in
relation to risk of colorectal cancer.
Results: A total of 373 cases of colorectal cancer were diagnosed during an average 9 years of follow-up of 20,605
participants. Increases in waist circumference and weight were not associated with the risk of colorectal cancer (HR
per 5 cm increase in waist circumference = 1.02; 95 % CI: 0.95, 1.10; HR per 5 kg increase in weight = 0.93; 0.85, 1.02).
For individuals with a waist circumference at baseline that was less than the sex-specific mean value there was a slight
increased risk of colorectal cancer associated with a 5 cm increase in waist circumference at wave 2 (HR = 1.08; 0.97,
1.21).
Conclusion: Increases in waist circumference and weight during midlife do not appear to be associated with the risk
of colorectal cancer.
Keywords: Anthropometry, Weight change, Waist circumference, Colorectal cancer, Prospective, Cohort
Background
There is substantial evidence that excess body fat, commonly measured by body mass index, increases the risk
of colorectal cancer [1, 2]. Recently, interest has shifted
to assessing whether adult weight gain also increases the
risk [3]. Four recent systematic reviews and meta-analyses
showed a positive association between weight change
during adulthood and the risk of colorectal cancer [4–7].
*Correspondence:
1 Centre for Epidemiology and Biostatistics, Melbourne School of Population
and Global Health, The University of Melbourne, Bouverie Street, 3010
Melbourne, Australia
Full list of author information is available at the end of the article
Weight and body mass index might not be the best measures of the health risks associated with obesity since they
provide no information on body fat content or distribution. Waist circumference and waist-to-hip ratio, simple
measures of central or abdominal adiposity, have stronger
associations with all-cause mortality, cardiovascular disease, cancer and type 2 diabetes compared with weight or
body mass index [8–11]. To our knowledge, only one study
assessed the association between prospective gain or loss
in waist circumference during middle adult life and the
risk of colorectal cancer [12].
Using a prospective cohort study in Melbourne,
Australia, in which anthropometric measurements were
© 2016 Karahalios et al. Open Access This article is distributed under the terms of the Creative Commons Attribution 4.0
International License ( which permits unrestricted use, distribution, and
reproduction in any medium, provided you give appropriate credit to the original author(s) and the source, provide a link to the
Creative Commons license, and indicate if changes were made. The Creative Commons Public Domain Dedication waiver
( applies to the data made available in this article, unless otherwise stated.
Karahalios et al. BMC Cancer (2016) 16:157
directly measured at baseline and approximately 12 years
later, we investigated associations between gain and loss in
weight, waist and hips circumference during middle adult
life and incidence of colorectal cancer.
Methods
The Melbourne Collaborative Cohort Study is a prospective cohort study of 41,514 people (24,469 women), aged
between 27 and 77 years at baseline (99.2 % of whom were
aged 40 to 69 years). Participants were recruited between
1990 and 1994 (baseline) and attended clinics where
demographic, anthropometric, lifestyle and dietary information were collected and anthropometric measurements
were performed [13]. A follow-up clinic was conducted
between 2003 and 2007 (wave 2) to update baseline information and repeat the anthropometric measurements.
Participants gave written consent to participate in the
study. Cancer Council Victoria’s Human Research Ethics
Committee approved the study protocol.
Exposure measures
All anthropometric measurements were taken by trained
staff according to standard protocols. Height was measured at baseline, to 1 mm, using a stadiometer. At both
baseline and wave 2, weight was measured to 100g using
a digital electronic scale, and waist circumference and
hips circumference were measured to 1 mm using a 2meter metal anthropometric tape. Waist circumference
was measured at the narrowest part of the torso and hips
circumference was measured at the point of maximum
circumference over the buttocks. For both waist circumference and hips circumference measurements participants were measured in light clothing with belts and
restricting garments removed. Change in anthropometric
measures were calculated as the value at baseline (1990–4)
subtracted from the value at wave 2 (2003–7).
Information about country of birth and level of educational attainment was collected at baseline. Residential
postcodes at baseline were used to classify participants
into quintiles of an area-based measure of socioeconomic
status [14]. At both waves, structured questionnaires were
administered to collect information about physical activity, smoking status and diet [15]. A Mediterranean diet
score, based on dietary and alcohol intake, was created
at both waves of data collection. Smoking status was categorised as lifetime abstainer, quit before baseline, quit
between baseline and wave 2, or current smoker at wave 2.
Cohort follow-up and case ascertainment
Cases were participants with a primary diagnosis of
adenocarcinoma of the colon or rectum (International
Classification of Diseases, 10th revision: C18, C19 or
C20) between date of wave 2 attendance and 30 June
2014. Cases were ascertained from record linkage to
Page 2 of 7
the population-based Victorian Cancer Registry and the
Australian Cancer Database. Addresses and vital status
of all participants were determined by record linkage
to Electoral Rolls, Victorian death records, the National
Death Index, from electronic phone books and from
responses to mailed questionnaires and newsletters.
Statistical analysis
Participants with extreme values for the baseline anthropometric variables (values below the 0.5 and above the
99.5 sex-specific percentiles of weight, waist and hips circumference, and of change in anthropometric measure)
and energy intake were excluded due to potential measurement errors. Analyses for this paper were restricted
to participants who attended both waves and who had
not been diagnosed with any cancer before their wave 2
attendance.
The HRs for change in body size and the incidence
of colorectal cancer were estimated using Cox regression
with attained age as the time metric. Follow-up began on
the date of the wave 2 measurement and ended at diagnosis of colorectal cancer (n = 373), diagnosis of an
unknown primary cancer (n = 29), diagnosis of an in
situ colorectal cancer or cancer of the anus (C21) (n =
17), death (n = 1814), or 30 June 2014 (n = 18, 362),
whichever came first. To estimate separate HRs for colon
(C18.0, 18.2 − 18.9) and rectal cancer (C19 and C20), we
fitted competing risk models [16].
We used the likelihood ratio test to test the assumption
of a linear association between the change in body size
measures and the log(hazard) by comparing models with
categorical (loss, stable, small gain and large gain) and
pseudo-continuous change in body size variables. Because
we did not find evidence of departure from linearity of
associations for any of the anthropometric measures, we
included them as continuous variables in the analyses.
Tests based on Schoenfeld residuals showed no evidence
that the proportional hazard assumptions were violated.
A causal diagram was developed and the following confounding variables were included in the models: country
of birth, sex, quintile of socioeconomic status, family
history of any cancer, the anthropometric measurement
at baseline, cumulative smoking status, physical activity and Mediterranean diet score at baseline and wave 2
(Additional file 1) [17, 18].
We conducted sensitivity analyses to test whether the
association between change in the anthropometric measures and incidence of colorectal cancer varied by sex, age
at wave 2, body size at baseline (when participants were
aged 40-69 years), smoking, length of time after wave 2,
and undiagnosed diseases by fitting separate interaction
terms between change in anthropometric measures and
the following variables: (i) sex, (ii) age at wave 2 (≥ 65
vs < 65 years), (iii) baseline value of the anthropometric
Karahalios et al. BMC Cancer (2016) 16:157
measure dichotomised at the sex-specific mean of body
size (waist circumference: 94 cm for men and 80 cm for
women; weight: 81 kg for men and 68 kg for women; hips
circumference: 101 cm for men and 102 cm for women),
(iv) smoking status (never smoked compared with ever
smoked), (v) length of follow-up after wave 2 (first two
years of follow-up compared with more than two years of
follow-up), and (vi) previous history of disease (indicator
for angina, diabetes or heart attack reported at baseline
or wave 2), with the primary exposure of interest ‘the
change in the anthropometric measure’ and tested the
interactions with likelihood ratio tests.
Statistical analyses were performed using Stata version
13.1 [19].
Results
Of the 41,514 participants in the Melbourne Collaborative
Cohort Study, 44 did not have baseline anthropometric
measurements, 866 had baseline measurements in the
extreme 0.5 or 99.5 sex-specific centile, 831 had a total
energy intake in the 1 or 99 centile at baseline, and 1818
had a diagnosis of cancer before baseline. Between baseline (1990–1994) and wave 2 (2003–2007), 3224 participants died or left Australia and 2,461 were diagnosed with
cancer, leaving 32,270 available for invitation to wave 2
and eligible for this analysis. Of these participants, 9707
(30 %) did not attend wave 2, and 57 did not have at least
one of their anthropometric measurements recorded (i.e.
waist circumference, weight, or hips circumference) at
wave 2. Finally, 1890 were excluded due to missing information for at least one of the confounding variables at
baseline or wave 2, or for an extreme change in body
size (i.e. 0.5 or 99.5 centile of sex-specific change in body
size), leaving 20,605 (12,573 females) participants with
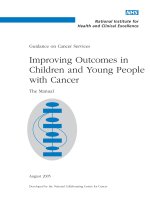
complete data available for this analysis (Fig. 1).
Participants who attended wave 2 were more likely to
have been born in Australia, New Zealand or the United
Kingdom than Southern Europe, have attained a higher
level of education, have never smoked, have low baseline
alcohol intake, have a less disadvantaged socioeconomic
status and be younger (Additional file 2). The mean baseline waist circumference, weight, and hips circumference
for the participants included in the analysis were 83.6
cm, 72.3 kg, and 100.6 cm, respectively, and the mean
changes in these measures were 7.0 cm, 2.2 kg, and 3.4
cm, respectively (Table 1 and Additional file 3). On average, the weight, waist and hips circumference increased
from baseline to wave 2 (Table 1). About a third (34.7 %) of
participants lost weight from baseline to wave 2, whereas
only 15.9 % of participants decreased their waist circumference. The body size measurements at baseline and wave
2 were highly correlated (r for waist circumference = 0.82,
r for weight = 0.91, and r for hips circumference = 0.76;
Additional file 4).
Page 3 of 7
Risk of colorectal cancer
There were 373 colorectal cancer cases (colon: 272 and
rectal: 101) diagnosed over an average of 9.0 years after
wave 2. Characteristics of the participants with and without colorectal cancer are shown in Additional file 5.
Table 2 shows the HRs of colorectal cancer for change in
anthropometric measures from the following two models:
a minimally adjusted model, included attained age during
follow-up (as the time variable), sex, and country of birth
(model 1), and a fully adjusted model, including the confounders in model 1, and additional confounders identified from a causal diagram (model 2). Results from model
2 show that increases in waist circumference, weight and
hips circumference were not associated with an increased
risk of colorectal cancer (for a 5 cm increase in waist circumference, HR = 1.02; 95 % CI: 0.95-1.10, 5kg increase
in weight 0.93; 0.85-1.02), and a 5 cm increase in hips
circumference, HR = 1.01; 0.92-1.10). We did not find evidence of departure from linearity of associations for any
of the anthropometric measures (Additional file 6). There
was little evidence of heterogeneity in the associations by
subsite (Table 2).
Sensitivity analyses
The association between change in waist circumference
and risk of colorectal cancer differed by the baseline value
of waist circumference (p-value = 0.01 from likelihood
ratio test). For individuals with baseline waist circumference below the sex-specific mean, the HR for an increase
in waist circumference was slightly elevated (1.08 per
5 cm increase; 0.97-1.21), whereas it was not for those
whose baseline waist circumference was above the sexspecific mean value: (0.97; 0.88-1.07) (Table 3). There was
weak evidence that sex (p-value from likelihood ratio test:
weight = 0.05, waist = 0.34, hips = 0.07) and previous history of disease (p-value from likelihood ratio test: weight
= 0.05, waist = 0.61, hips = 0.03) modified the association
(Additional file 7). Age at wave 2 (p-value from likelihood
ratio test: weight = 0.13, waist = 0.78, hips = 0.37), smoking
status (p-value from likelihood ratio test: weight = 0.16,
waist = 0.67, hips = 0.38), and length of follow-up (p-value
from likelihood ratio test: weight = 0.22, waist = 0.06, hips
= 0.50) did not modify the associations for change in body
size and risk of colorectal cancer.
Discussion
In this cohort study of middle-aged men and women,
an increase of 5 units in waist circumference, weight or
hips circumference, measured between 1990–1994 and
approximately 12 years later, was not associated with a
higher risk of colorectal cancer.
The strengths of our study include its prospective
design, almost complete follow-up of participants after
wave 2 (only 11 participants were known to have left
Karahalios et al. BMC Cancer (2016) 16:157
Page 4 of 7
Fig. 1 Flowchart of participants in the Melbourne Collaborative Cohort Study
Australia), updated covariate information at wave 2, and
directly measured body size measurements, using standard protocols, at both waves.
Its principal limitations are the small number of colorectal cancer cases; attrition before wave 2 (approximately
30 % of participants alive at wave 2 did not attend the
follow-up wave); and the lack of information on intentionality of weight change for the study participants.
The proportion of living participants attending wave
2 (i.e. 71.5 %) was similar to the proportion reported by
other studies [20]. Those who attended both waves were
younger, better educated, and had a healthier lifestyle
than non-participants, which might restrict the findings
to populations of fairly healthy middle-aged adults.
Prior to performing this analysis, we conducted an
extensive simulation study to identify whether multiple
imputation or complete-case analysis should be used to
handle the missing anthropometric data at wave 2. We
found that in the framework of this study, both methods provide unbiased estimates and there is minimal gain
in precision when using multiple imputation [21]. Multiple imputation provides unbiased estimates when the
data are ‘missing at random? Whether the missing data
are ‘missing at random? or ‘missing not at random? is
an untestable assumption. It has been suggested that for
cohort studies which collect a large amount of information from their participants (as is this the case for
the Melbourne Collaborative Cohort Study), the observed
data can provide a large amount of information about
the missing data. This is especially true for studies that
invite participants to return to follow-up waves; where
the baseline data are strongly predictive of the data at the
Karahalios et al. BMC Cancer (2016) 16:157
Page 5 of 7
Table 1 Distribution of body size measures at baseline and wave 2 for the Melbourne Collaborative Cohort Study participants
All participants
Attended wave 2
Baseline
Baseline
Wave 2
n
mean (SD)
n
mean (SD)
mean (SD)
All
41, 514
85.5 (13.0)
20, 595
83.6 (12.0)
90.5 (12.5)
Females
24, 469
80.0 (11.8)
12, 566
78.1 (10.5)
86.1 (11.9)
Males
17, 045
93.5 (10.0)
8029
92.1 (8.9)
97.5 (10.0)
Waist circumference (cm)
Weight (kg)
All
41, 514
73.4 (13.7)
20, 595
72.3 (12.7)
74.5 (13.6)
Females
24, 469
68.2 (12.4)
12, 566
67.1 (11.1)
69.7 (12.4)
Males
17, 045
80.8 (11.8)
8029
80.4 (10.7)
82.1 (11.9)
Hips circumference (cm)
All
41, 514
101.4 (8.9)
20, 595
100.6 (7.9)
104.0 (8.9)
Females
24, 469
101.6 (10.0)
12, 566
100.7 (8.8)
104.5 (10.0)
Males
17, 045
101.1 (7.1)
8029
100.5 (6.2)
103.3 (6.6)
follow-up waves (for example education status at baseline
in our study which we control for in our Cox regression
models).
Physical activity and diet (especially consumption of
red and processed meat) may confound the association
between obesity and risk of colorectal cancer [22]. A
meta-analysis of 15 cohort studies suggested that the
highest versus the lowest intake categories of red and
processed meat were associated with 28 % and 21 %
increased risk of colorectal cancer, respectively [23]. Information on red and processed meat intake was available
at both waves of data collection; a Mediterranean diet
score was calculated, giving lower scores for high meat
intake and low fruit/vegetable consumption. Adjusting for
Mediterranean diet score and physical activity at both
waves did not materially change the findings.
Table 2 Incidence of colorectal cancer in relation to a 5 unit change in anthropometric measure: Hazard ratios and 95 % CI
Model 1a
Model 2b
HR
95 % CI
p-valuec
HR
95 % CI
p-valuec
Waist change (per 5 cm)
1.00
[0.93, 1.08]
0.924
1.02
[0.95, 1.10]
0.542
Weight change (per 5 kg)
0.92
[0.84, 1.02]
0.107
0.93
[0.85, 1.02]
0.147
Hips change (per 5 cm)
0.98
[0.90, 1.07]
0.654
1.01
[0.92, 1.10]
0.905
Waist change (per 5 cm)
1.01
(0.93, 1.10)
0.777
1.03
(0.95, 1.12)
0.444
Weight change (per 5 kg)
0.94
(0.84, 1.05)
0.278
0.95
(0.86, 1.05)
0.327
Hips change (per 5 cm)
0.96
(0.87, 1.07)
0.484
0.99
(0.89, 1.10)
0.840
Waist change (per 5 cm)
0.98
(0.86, 1.11)
0.763
1.00
(0.88, 1.13)
0.977
Weight change (per 5 kg)
0.88
(0.73, 1.06)
0.190
0.89
(0.75, 1.06)
0.191
Hips change (per 5 cm)
1.03
(0.88, 1.20)
0.747
1.05
(0.90, 1.22)
0.529
Colorectal (C18-20)d
Colon (C18)e
Rectal (C19,C20)f
a
Model 1: Estimates adjusted for sex and country of birth
Model 2: Estimates adjusted as in model 1, as well as quintile of socioeconomic status, family history of any cancer, body size at baseline, cumulative smoking status, and
physical activity and Mediterranean diet score at baseline and wave 2
c
P-values from Cox proportional hazard model
d
373 colorectal cancer cases in 186,329 person-years at risk
Incidence rate of colorectal cancer = 2.00 per 1,000 person-years (95 % CI = 1.81, 2.22)
e
272 colon cancer cases (C18); Incidence rate = 1.46 per 1,000 person-years (95 % CI = 1.30, 1.64)
f
101 rectal cancer caases (C19,20); Incidence rate = 0.54 per 1,000 person-years (95 % CI = 0.45, 0.66)
b
Karahalios et al. BMC Cancer (2016) 16:157
Page 6 of 7
Table 3 Risk of colorectal cancer in relation to 5 unit change in anthropometric measure by baseline value of the anthropometric
measure: Hazard ratios and 95 % CI
Baseline value of body sizea
≥sex-specific mean valuee
HR
95 % CI
p-valueb
HR
95 % CI
p-valueb
p-valuec
Waist change (per 5 cm)
1.08
[0.97, 1.21]
0.157
0.97
[0.88, 1.07]
0.502
0.01
Weight change (per 5 kg)
1.02
[0.88, 1.18]
0.826
0.88
[0.78, 0.99]
0.038
0.29
Hips change (per 5 cm)
1.04
[0.90, 1.20]
0.595
0.97
[0.86, 1.09]
0.583
0.14
a
Sex-specific mean of baseline body size: Waist circumference: Males = 94 cm , Females = 80 cm; weight: Males = 81 kg , Females = 68 kg; Hips circumference: Males =
101 cm, Females = 102 cm
b
P-value from Cox proportional hazard model adjusted for sex, country of birth, family history of any cancer, quintile of socioeconomic status, baseline body size, cumulative
smoking status and physical activity and Mediterranean diet score at baseline and wave 2
c
P-value from likelihood ratio test comparing the model with and without the interaction terms; where the interaction term is fitted between the covariate and the exposure
of interest (i.e. change variable)
d
176 colorectal cancer cases below the sex-specific mean value in 109,725 person-years at risk. Incidence rate = 1.60 per 1,000 person-years (95 % CI = 1.38, 1.86)
e
197 colorectal cancer cases above the sex-specific mean value in 76,605 person-years at risk. Incidence rate = 2.57 per 1,000 person-years (95 % CI = 2.24, 2.96)
To define strata of adiposity status, we used the mean
sex-specific values for the participants of the Melbourne
Collaborative Cohort Study (i.e. waist circumference =
94 cm for men and 80 cm for women, weight = 81 kg
for men and 68 kg for women). These values correspond
to the National Health and Medical Research Council
Dietary Guidelines for Adults [24], which recommend
maintaining a healthy weight with a waist circumference
measurement less than 80 cm for women and 94 cm for
men and a body mass index of between 18.5 and 25 kg/m2 .
In our population, with an average height of 1.73 m for
men and 1.61 m for women, a body mass index of 25
kg/m2 corresponds to a weight of 75 kg for men and 65 kg
for women.
Our results for weight gain showed a slight, nonstatistically significant, decreased risk of colorectal cancer.
Three recent meta-analyses showed that comparing the
highest category of weight gain to a reference category
was associated with an increased risk of colorectal cancer
(HRs from 1.15 to 1.25) [4, 6, 7]. However, these pooled
estimates incorporated weight change between early life
and midlife, and weight change between midlife and older
age. A meta-regression analysis showed that weight gain
from early life to midlife was associated with a 1.23-fold
increased risk of colorectal cancer (pooled HR = 1.23, 95 %
CI = 1.14, 1.34) [4]. On the other hand, weight gain from
midlife to older age was not associated with an increased
risk of colorectal cancer (pooled HR = 1.02; 95 % CI = 0.91,
1.16) [4].
To date, only one study has looked at the association
between change in waist circumference and the risk of
colorectal cancer [12]. Song et al. relied on self-reported
measurements of waist circumference and estimated the
associations separately for men and women, using data
from the Health Professionals Follow-up Study and the
Nurses Health Study, respectively. A positive association
was observed for men (HR for 10 cm gain = 1.34; 1.03,
1.74) but not for women (HR for 10 cm gain = 1.07; 0.93,
1.24). We did not find that sex modified the association
between change in waist circumference and the risk of
colorectal cancer.
Song et al. [12] also investigated the association between
change in hips circumference and the risk of colorectal
cancer. Similar to our results, they did not find an association between change in hips circumference and the risk
of colorectal cancer (men: HR for 10 cm gain = 1.14; 0.93;
1.39; women: HR = 1.34; 0.99; 1.81).
We were unable to differentiate between unintentional
and intentional weight change. As a result, reverse causation is a potential concern. When we excluded cancer
cases diagnosed during the first two years of follow-up,
the results were similar.
Conclusions
In conclusion, we found no associations between changes
in waist circumference, weight or hips circumference during middle adult life and the risk of colorectal cancer.
However, previous studies have shown that weight gain
from early life (i.e. age 18 to 21) to midlife is associated
with an increased risk of colorectal cancer and weight
gain from midlife to older age can have other detrimental effects. Therefore, recommendations should focus
on maintaining a healthy body weight throughout the
lifespan.
Additional files
Additional file 1: Causal diagram used to select additional
confounding variables included in the analysis models. (PDF 62 kb)
Additional file 2: Distribution of baseline characteristics of the
Melbourne Collaborative Cohort Study participants. (PDF 93 kb)
Additional file 3: Distribution of baseline demographic
characteristics of the Melbourne Collaborative Cohort Study
participants by change in anthropometric measure. (PDF 61 kb)
Karahalios et al. BMC Cancer (2016) 16:157
Additional file 4: Spearman rank correlations between body size
measured at baseline and wave 2 and change in body size in the
Melbourne Collaborative Cohort Study. (PDF 31 kb)
Additional file 5: Characteristics of the participants with and without
colorectal cancer in the Melbourne Collaborative Cohort Study.
(PDF 63.4 kb)
Additional file 6: Risk of colorectal cancer in relation to categories of
change in anthropometric measures: Hazard ratios and 95 % CI.
(PDF 92.5 kb)
Additional file 7: Risk of colorectal cancer in relation to a 5 unit
change in anthropometric measures by sex and previous history of
disease: Hazard ratios and 95 % CI. (PDF 70.1 kb)
Abbreviations
HR: hazard ratio; CI: confidence interval.
Page 7 of 7
4.
5.
6.
7.
8.
9.
Competing interests
The authors declare that they have no competing interests.
Authors’ contributions
Conceived and designed the experiments: DRE, GGG. Analysed the data: AK.
Advised on the statistical analysis: JAS, DRE. Wrote the paper: AK. Initiated the
cohort and initial data collection: GGG. Initiated and coordinated the
preceding data collection: GGG DRE. Critical revision of the manuscript for its
intellectual content and interpretation of the results: JAS, LB, RJM, AMH, DRE.
All authors have read and approved the manuscript.
Acknowledgements
This study was made possible by the contribution of many people, including
the original investigators and the teams who recruited the participants and
followed up the participants. We would also like to express our gratitude to
the many thousands of Melbourne residents who continue to participate in
the study.
Recruitment of the Melbourne Collaborative Cohort Study was funded by
VicHealth and Cancer Council Victoria. This work was supported by National
Health & Medical Research Council (NHMRC) [grant numbers 209057, 251533,
504711, 1035261] and Vic-Health (grant number 1998-0406). Further
infrastructure support was provided Cancer Council Victoria, and funding was
received from the Australian Brewers’ Foundation to collect alcohol data at
wave 2. Cases and their vital status were ascertained through the Victorian
Cancer Registry (VCR) and the Australian Institute of Health and Welfare (AIHW),
including the National Death Index and the Australian Cancer Database. AK
was funded by an Australian Postgraduate Award. LB is supported by a Marie
Curie International Incoming Fellowship within the 7th European Community
Framework Programme. JAS is supported by an Australian National Health and
Medical Research Council (NHMRC) Senior Research Fellowship 1104975.
Author details
1 Centre for Epidemiology and Biostatistics, Melbourne School of Population
and Global Health, The University of Melbourne, Bouverie Street, 3010
Melbourne, Australia. 2 Cancer Epidemiology Centre, Cancer Council Victoria,
615 St Kilda Road, 3004 Melbourne, Australia. 3 Team 9, Lifestyle, Genes and
health: integrative trans-generational epidemiology, Inserm U1018, Centre for
Research in Epidemiology and Population Health, Gustave Roussy Institute,
114 rue Edouard Vaillant, 94805 Villejuif Cedex, France. 4 Paris-South University,
Villejuif, France.
Received: 5 November 2015 Accepted: 8 February 2016
References
1. Renehan AG, Tyson M, Egger M, Heller RF, Zwahlen M. Body-mass index
and incidence of cancer: a systematic review and meta-analysis of
prospective observational studies. Lancet. 2008;371(9612):569–78.
2. Johnson C, Wei C, Ensor J, Smolenski D, Amos C, Levin B, Berry D.
Meta-analyses of colorectal cancer risk factors. Cancer Causes Control.
2013;24(6):1207–22.
3. Pischon T. Commentary: Use of the body mass index to assess the risk of
health outcomes: time to say goodbye? Int J Epidemiol. 2010;39(2):528–9.
10.
11.
12.
13.
14.
15.
16.
17.
18.
19.
20.
21.
22.
23.
24.
Karahalios A, English DR, Simpson JA. Weight change and risk of
colorectal cancer: A systematic review and meta-analysis. Am J Epidemiol.
2015;181(11):832–45.
Keum N, Greenwood DC, Lee DH, Kim R, Aune D, Ju W, FB Hu,
Giovannucci EL. Adult weight gain and adiposity-related cancers: a
dose-response meta-analysis of prospective observational studies. J Natl
Cancer I. 2015;107(2):088.
Schlesinger S, Lieb W, Koch M, Fedirko V, Dahm C, Pischon T, Nöthlings
U, Boeing H, Aleksandrova K. Body weight gain and risk of colorectal
cancer: a systematic review and meta-analysis of observational studies.
Obes Rev. 2015;16(7):607–19.
Chen Q, Wang J, Yang J, Jin Z, Shi W, Qin Y, Yu F, He J. Association
between adult weight gain and colorectal cancer: a dose–response
meta-analysis of observational studies. Int J Cancer. 2015;136(12):2880–9.
Haslam DW, James WPT. Obesity. Lancet. 2005;366(9492):1197–209.
de Hollander EL, Bemelmans WJ, Boshuizen HC, Friedrich N,
Wallaschofski H, Guallar-Castillón P, Walter S, Zillikens MC, Rosengren A,
Lissner L, Bassett JK, Giles GG, Orsini N, Heim N, Visser M, de Groot LC,
WC elderly collaborators. The association between waist circumference
and risk of mortality considering body mass index in 65- to 74-year-olds: a
meta-analysis of 29 cohorts involving more than 58 000 elderly persons.
Int J Epidemiol. 2012;41(3):805–17.
Pischon T, Boeing H, Hoffmann K, Bergmann M, Schulze MB, Overvad K,
van der Schouw YT, Spencer E, Moons KGM, Tjønneland A, Halkjaer J,
Jensen MK, Stegger J, Clavel-Chapelon F, Boutron-Ruault M-C, Chajes V,
Linseisen J, Kaaks R, Trichopoulou A, Trichopoulos D, Bamia C, Sieri S,
Palli D, Tumino R, Vineis P, Panico S, Peeters PHM, May AM,
Bueno-de-Mesquita HB, van Duijnhoven FJB, Hallmans G, Weinehall L,
Manjer J, Hedblad B, Lund E, Agudo A, Arriola L, Barricarte A, Navarro C,
Martinez C, Quirós JR, Key T, Bingham S, Khaw KT, Boffetta P, Jenab M,
Ferrari P, Riboli E. General and abdominal adiposity and risk of death in
Europe. N Engl J Med. 2008;359(20):2105–20.
Poirier P, Lemieux I, Mauriège P, Dewailly E, Blanchet C, Bergeron J,
Després J-P. Impact of waist circumference on the relationship between
blood pressure and insulin: the Quebec health survey. Hypertension.
2005;45(3):363–7.
Song M, Hu FB, Spiegelman D, Chan AT, Wu K, Ogino S, et al.
Long-term status and change of body fat distribution, and risk of
colorectal cancer: a prospective cohort study. Int J Epidemiol. 2015pii:
dyv177. [Epub ahead of print].
Giles GG, English DR. The Melbourne Collaborative Cohort Study. IARC Sci
Publ. 2002;156:69–70.
McLennan W. An Introduction to Socio-economic Indexes for Areas
(SEIFA). Information Paper. Canberra: Australian Bureau of Statistics; 1996.
Ireland P, Jolley D, Giles G. Development of the Melbourne FFQ: a food
frequency questionnaire for use in an Australian prospective study
involving an ethnically diverse cohort. Asia Pac J Clin Nutr. 1994;3:19–31.
Lunn M, McNeil D. Applying Cox regression to competing risks.
Biometrics. 1995;51(2):524–32.
Shrier I, Platt RW. Reducing bias through directed acyclic graphs. BMC
Med Res Methodol. 2008;8(1):70.
Textor J, Hardt J, Knüppel S. DAGitty: a graphical tool for analyzing causal
diagrams. Epidemiology. 2011;22(5):745.
StataCorp. 2013. Stata Statistical Software: Release 13. College Station, TX:
Stata Corp LP.
Berentzen TL, Jakobsen MU, Halkjaer J, Tjønneland A, Overvad K,
Sørensen TIA. Changes in waist circumference and mortality in
middle-aged men and women. PLoS ONE. 2010;5(9):13097.
Karahalios A, Baglietto L, Lee KJ, English DR, Carlin JB, Simpson JA. The
impact of missing data on analyses of a time-dependent exposure in a
longitudinal cohort: a simulation study. Emerging Themes Epidemiol.
2013;10:6.
Moghaddam AA, Woodward M, Huxley R. Obesity and risk of colorectal
cancer: a meta-analysis of 31 studies with 70,000 events. Cancer Epidem
Biomar. 2007;16(12):2533–47.
Larsson SC, Wolk A. Meat consumption and risk of colorectal cancer: a
meta-analysis of prospective studies. Int J Cancer. 2006;119(11):2657–64.
National Health and Medical Research Council. Eat for Health, Australian
Dietary Guidelines Providing the scientific evidence for healthier
Australian diets. 2013. Technical report, Canberra: National Health and
Medical Research Council.