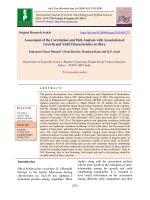
Study on phenotypic, genotypic correlation and path coefficients in Chilli
Bạn đang xem bản rút gọn của tài liệu. Xem và tải ngay bản đầy đủ của tài liệu tại đây (385.53 KB, 8 trang )
Int.J.Curr.Microbiol.App.Sci (2020) 9(7): 1930-1937
International Journal of Current Microbiology and Applied Sciences
ISSN: 2319-7706 Volume 9 Number 7 (2020)
Journal homepage:
Original Research Article
/>
Study on Phenotypic, Genotypic Correlation and Path Coefficients in Chilli
T.S. Mishra1 and H.M. Singh2*
1
2
Krishi Vigyan Kendra West Kameng, Dirang Arunachal Pradesh, India
National Horticultural Research and Development Foundation, Patna (Bihar), India
*Corresponding author
ABSTRACT
Keywords
Chilli, Phenotypic
correlation,
Genotypic
correlation and path
coefficients
Article Info
Accepted:
17 June 2020
Available Online:
10 July 2020
Chilli is an importance crop which has position to increase economic earning for grower.
The Twenty genotypes were grown and studies for phenotypic correlation, Genotypic
correlation and path coefficient of traits at the vegetable Research Farm in Department of
Horticulture, Allahabad Agricultural Institute-Deemed University, Allahabad. The
estimate of phenotypic coefficient of variation was higher than the genotypic coefficient of
variation for almost all the traits. The magnitude of genotypic correlation was higher than
the phenotypic correlation for all the characters. The most important trait total yield per
plant was significantly and positively correlated with green fruit yield, fruit length and
fruit diameter, weight of red ripe fruit. No of seeds/fruit, weight of seeds/ fruit, ascorbic
acid, oleoresin, and capsaicin content. The important traits green fruit yield was
significantly and negatively correlated with days to flowering, days to 50% flowering,
days to first green fruit harvest and days to ripe fruit harvest. Number of seeds/fruit,
weight of seeds/ fruits, average weight of green fruit, and ascorbic acid had positive direct
effect on yield at both and phenotypic levels. Based on performance SM-20, JCA-9, Pusa
Jawala, Utakal Ragini and Kashi anmol exhibited high fruit yield per plant. Among all the
genotypes SM-20 was found to be with highest yield i.e. 168.42 g per plant.
Introduction
Chilli (Capsicum annuum) is one of the most
important vegetable as well as spice crop,
belongs to family solanaceae. It is a self
pollinated crop bearing a pod like fruit (berry)
and has a predominant position among the
spices grown all over India. The information
usually needed for developing high yielding
varieties in a particular species pertains to the
extent of genetic variability for desirable traits
in the available germplasm. Large variability
ensures better chances of producing new
forms. The Phenotypic variability includes
both genotypic and environmental variation
and
hence
change
under
different
environmental
conditions.
Genotypic
variability
remains
unchanged
by
environmental condition.
Correlation coefficient is the mutual liner
relationship between two or more variables.
Correlation coefficient among different
characters is either positive or negative and it
1930
Int.J.Curr.Microbiol.App.Sci (2020) 9(7): 1930-1937
may be high or low. Estimation of correlation
coefficient among the yield contributing
characters is necessary to understand the
direction of selection and to maximize yield
in the shortest period of time. Path coefficient
provides an effective means of entangling
direct and indirect causes of association of
selection and measures the relative
importance of each causal factor. chilli being
an important crop in Uttar Pradesh needs
attention about genetic improvement.
Therefore, keeping the above factors in view
the present investigation was undertaken to
find out the following objectives, the study of
phenotypic correlation, genotypic correlation
and path coefficients between characters.
Materials and Methods
The present investigation include a brief
description of the site of the experiment, soil
properties, climatic conditions prevalent in
the locality during the period of experiment,
statistical analysis, particulars of treatment,
planting materials used and sampling
techniques. A field experiment was conducted
at Horticulture Research Farm (HRF),
Department of Horticulture, Allahabad (U.P).
The different variety was taken for the study
from IIVR Varanasi Varieties Pusa Jawala,
SM-20, JCA-9, LCA-206, LCA-404, IC413702, Japani long, Pbc-1438, IC- 383079,
LCA-333,LCA-334,
CO-5686-1,
Kashi
Anmol, LCA-357, EC-492576, Utkal Ragini,
LCA-324, LCA-312, LCA-301, LCA-304.
The phenotypic variance, genotypic variance
and Environmental variance (Components of
variance) was calculated by subtracting the
mean squre at treatment level as proposed by
Burton and De Vane (1953). The phenotypic
and genotypic correlation coefficients were
worked out to study the inter-relationship
between various pairs of characters as
suggested by AL-Jibouri et al., (1958). The
path coefficient were obtained according to
the procedure suggested by Dewey and Lu
(1959) using phenotypic and genotypic
correlation coefficients. The direct and
indirect effects are rated as follows by Lenka
and Mishra (1973).
Results and Discussion
Phenotypic correlation coefficient
The correlation coefficient at phenotypic and
genotypic levels was computed among 17
characters for 20 genotypes and their
correlation with level of significance is given
in table 1 & table.2. A perusal of correlation
coefficients
revealed
that
genotypic
correlation coefficients were in general higher
than the corresponding phenotypic correlation
due to Rabi season crop. At the phenotypic
levels fruit yield showed positive and
significant association with green fruit yield.
The plant height per plant (100 and 120 days)
showed significant positive phenotypic
correlation with average green fruit yield per
plant. Days to 50 percent flowering, days to
1st flowering and days to green fruit diameter
showed highly significant negative correlation
with the green fruit and red ripe fruit yield.
Average weight of green fruit showed highly
significant
positive
correlation
with
phenotypic correlation with green fruit yield
and red ripe fruit yield. Average fruit length
and average fruit diameter showed significant
positive phenotypic correlation with green
fruit yield and red ripe fruit yield. Days to 1st
ripe fruit harvest showed significant negative
phenotypic correlation with green fruit yield.
Average weight of red ripe and average, red
ripe fruit yield showed significant positive
correlation with phenotypic correlation with
green fruit yield. Number of seeds/plant and
weight of seeds/fruit showed significant
positive phenotypic correlation with green
fruit and red yield at 1% level at significance.
Ascorbic acid, oleoresin and capsaicin content
1931
Int.J.Curr.Microbiol.App.Sci (2020) 9(7): 1930-1937
showed significant positive phenotypic
correlation with green fruit and red ripe fruit
yield at 1% level of significant whereas,
capsaicin content was found significant at 5%
level of significance.
Genotypic correlation coefficient
Plant height for plant (100 and 120 days)
showed highly significant positive genotypic
correlation with green and red ripe fruit yield.
Days to first flowering and days to 50%
flowering showed highly significant positive
and negative genotypic correlation with green
fruit yield and red ripe fruit yield. Days to
first green fruit harvest and days to first ripe
fruit harvest highly significant negatively
correlated with green fruit and red ripe fruit
yield. Average fruit length Average fruit
diameter and average weight of green fruits
showed highly significant negative correlation
with green fruit and red ripe fruit yield. Fruit
length, fruit diameter and average weight of
green fruits showed highly significant positive
genotypic correlation with green fruit and red
ripe fruit yield. Average weight of red ripe
fruit, yield, number of seeds/fruit and weight
of seeds/fruit showed highly significant
positive genotypic correlation with green fruit
yield. Ascorbic acid, oleoresin and capsaicin
content showed highly significantly positive
genotypic correlation with green fruit and red
ripe fruit yield.
The nature and magnitude of association
between yield and its components traits is
necessary for effective selection in advance
generations. Dewey and Lu (1959)
emphasized that the nature of population
under consideration and the magnitude of
correlation coefficients could often be
influenced by the choice of the individuals
upon which the observation are made.
Correlations between characters pairs are due
to linkage of genes or pleiotrophy of genes.
Therefore, selection of one trait influences the
other linked or pleiotrophically affected traits.
Selection is usually practiced for changing
two or more than two characters
simultaneously.
The
information
on
interrelationship of the important economic
indicated strong genetic associations between
the traits and the phenotypic traits may be
useful in the prediction of correlated response
to direct selection in the construction of some
characters which may have no values in
themselves but may be useful as indicators of
other important traits (Robinson et al., 1951).
Considerable importance has been attached to
correlation studies in the plant improvement
because they are helpful in making effecting
selection. In the present study, correlation
between two characters was worked out in all
possible combinations at phenotypic and
genotypic levels as presented in table (3 & 4).
In general, the magnitude of genotypic
correlation coefficients was higher than the
corresponding values of the phenotypic
correlation coefficients, the expression which
was suppressed due to environmental
influence. The present study also suggested
that both genotypic and phenotypic
correlation were similar in direction. Days to
50 percent flowering was significantly and
positively correlated with fruit length, was s
harvest and total yield per plant. Fruit length
was significantly and positively correlated
and with average fruit weight and total yield
per plant. The most important trait total yield
per plant was significantly and positively
correlated with early yield per plant, fruit
length per plant. Similar results have been
reported by Singh et al., (1972). Sri Latha
Kumary and Rajamuny (2002), Nazier et al.,
(2005) and Choudhar and Samadia (2000).
1932
Int.J.Curr.Microbiol.App.Sci (2020) 9(7): 1930-1937
Days to 50% flowering
Days to 1st green fruit
harvest
green
Avg. wt.
fruits(g)
Avg. fruit length (cm)
Avg. fruit diameter(cm)
Days to 1st ripe fruit
harvest
Avg. wt. of red ripe
Avg. red ripe fruit yield
No. of seed/ fruit
Weight of seeds/fruit
Ascorbic acid(mg/100g)
Oleoresin(%)
Capsaicin(%)
Genotypic correlation
fruit
green
with
yield/plant(g)
0.986
0.970
0.421
0.388
-0.410
0.456
0.401
0.207
0.034
0.554
-0.0054
0.102
0.034
0.051
0.488
-0.548
0.308
0.985
0.357
0.344
0.363
0.349
0.581
-0.382
-0.320
-0.187
-0.123
0.459
0.437
0.196
0.035
-0.299
0.396
0.351
0.114
0.091
-0.579
0.264
0.174
0.126
0.071
-0.275
-0.140
0.461
0.519
0.020
-0.017
-0.018
-0.056
-0.161
0.127
-0.035
0.168
0.562
0.573
-0.051
-0.0162
-0.095
0.208
0.221
0.242
-0.007
-0.0721
-0.1097
0.0190
-0.105
-0.189
0.185
0.155
0.140
-0.186
-0.141
0.063
0.041
0.215
-0.016
-0.0205
0.489
0.306
0.265
-0.105
0.117
0.756
0.044
0.012
0.035
0.077
-0.046
0.0371
0.305
0.333
0.243
-0.065
0.245
0.333
0.099
0.079
-0.0384
-0.270
-0.467
0.374
0.148
0.114
0.347
0.125
-0.020
0.145
0.299
0.488
0.428
0.278
0.164
-0.102
-0.074
0.195
0.232
0.261
0.524
-0.164
-0.383
-0.080
-0.281
-0.492
-0.470
-0.346
-0.320
0.336
-0.328
-0.174
0.132
-0.232
-0.142
-0.290
-0.357
-0.230
-0.057
-0.117
0.292
-0.329
-0.062
-0.062
0.183
0.175
0.280
-0.178
0.189
0.186
0.213
0.173
0.049
0.000
0.720
d.f
1
2
3
4
5
6
7
8
9
10
11
12
13
14
15
16
of
120
Plant
height
days
100
Days to 1st flowering
Table.1 Phenotypic correlation coefficient for 17 characters in chillies
0.095
17
1933
0.043
0.055
0.018
0.033
0.085
-0.051
0.379
0.315
0.363
0.271
-0.066
0.247
0.345
0.035
0.093
0.077
-0.448
-0.337
-0.517
0.386
0.171
0.095
0.402
0.118
-0.019
0.153
0.311
0.539
0.0498
0.474
0.331
0.176
-0.110
-0.082
0.200
0.254
0.298
0.546
-0166
-0.399
-0.079
-0.298
-0.615
-0.556
-0.556
-0.532
-0.372
0.354
-0.331
-0.182
-0.139
-0.264
-0.144
-0.294
-0375
-0.231
-0.061
-0.117
Genotypic correlation
with green fruit
yield/plant(g)
0.139
0.090
0.081
0.0231
-0.035
-0.228
0.524
0.318
0.299
-0.178
-0.116
0.788
Capsaicin(%)
-0.007
-0081
-0.124
0.205
-0.126
-0.215
0.188
0.157
0.147
-0.227
-0.143
Ascorbic acid (mg/100g)
0.593
0.600
0.626
-0.045
0.151
-0.095
0.213
0.235
0.247
0.025
Weight of seeds/fruit
0.105
0.096
0.061
-0.043
-0.045
-0.192
0.162
-0.020
0.150
Oleoresin(%)
0.238
0.195
0.145
0.047
-0.332
-0.189
0.497
0.601
No. of seed/ fruit
0.474
0.464
0.411
0.148
0.111
-0.630
0.271
Avg. red ripe fruit
yield
0.545
0.546
0.523
0.217
0.037
-0.317
Avg. wt. of red ripe
-0.530
-0.504
-0.431
-0.268
-0.183
Days to 1st ripe fruit
harvest
0.484
0.456
0.448
0.0642
Avg. fruit diameter(cm)
0.508
0.426
0.423
Avg. fruit length (cm)
0.975
0.992
Avg. wt. of green f
ruits(g)
0.990
Days to 1st green fruit
harvest
120
Days to 50% flowering
100
Days to 1st flowering
1
2
3
4
5
6
7
8
9
10
11
12
13
14
15
16
17
Plant height days
d.f
Table.2 Genotypic correlation coefficient for 17 characters in chillies
0.345
0.345
0.330
-0372
-0.067
0.163
0.196
0.181
-0.283
0.113
0.195
0.186
0.223
0.172
0.048
0.001
0.191
Int.J.Curr.Microbiol.App.Sci (2020) 9(7): 1930-1937
-0.145
0.013
0.060
-0.007
0.032
-0.046
0.058
-0.050
-0.0265
0.147
-0.002
0.010
-0.003
0.014
0.017
0.005
0.047
Geno
Typic correlation with green
fruit yield/plant(g)
-0.281
0.030
0.167
-0.012
-0.010
-0.189
0.033
-0.096
-0.137
0.231
0.004
0.009
-0.003
0.016
0.016
0.006
0.039
Capsaicin(%)
-0.319
0.035
0.208
-0.020
-0.004
-0.097
0.127
-0.025
-0.122
-0.144
-0.017
0.009
-0.004
0.027
0.019
0.016
-0.015
Oleoresin(%)
0.287
-0.029
-0.153
0.019
-0.014
-0.327
-0.038
0.056
0.073
-0.152
0.021
-0.004
0.004
-0.011
-0.002
-0.020
-0.020
Ascorbic acid(mg/100g)
Avg. fruit length (cm)
0.272
0.028
0.166
-0.061
-0.119
-0.040
0.004
-0.008
0.073
-0.118
0.007
-0.007
0.002
-0.0009
0.004
-0.012
0.033
Weight of seeds/fruit
Avg. wt. of green fruits(g)
-0.295
0.027
0.164
-0.105
-0.069
-0.061
0.024
-0.011
-0.018
-0.051
0.002
-0.002
-0.004
0.011
0.001
0.017
0.056
No. of seed/ fruit
Days to 1st green fruit
harvest
-0.680
0.076
0.476
-0.036
-0.041
-0.104
0.055
-0.034
-0.033
-0.272
0.002
0.025
0.002
0.002
0.006
0.003
0.087
Avg. red ripe fruit yield
Days to 50% flowering
-0.691
0.077
0.470
-0.037
-0.043
-20.125
0.058
-0.038
-0.046
-0.241
-0.002
0.025
0.001
0.003
0.002
0.004
0.091
Avg. wt. of red ripe
Days to 1st flowering
1
2
3
4
5
6
7
8
9
10
11
12
13
14
15
16
17
Days to 1st ripe fruit harvest
120
Avg. fruit diameter(cm)
100
Plant
height
(days)
S.No.
Table.3 Phenotypic direct (diagonal) and indirect effects of 17 characters in chillies
-0.023
0.001
0.008
0.002
0.006
-0.052
0.016
0.003
-0.044
-0.079
-0.134
-0.0003
0.004
-0.005
0.012
0.015
0.053
-0.388
0.043
0.273
0.005
0019
0.031
0.026
-0.021
-0.064
-0.156
0.001
0.044
0.003
-0.006
-0.003
0.005
0.107
-0.038
-0.005
-0.052
-0.020
0.012
-0.061
0.023
-0.015
-0.037
-0.153
0.025
-0.006
-0.023
0.041
0.013
-0.0009
-0.033
-0.072
0.004
0.020
-0.022
0.002
-0.067
0.062
-0.029
-0.070
-0.176
0.014
-0.005
-0.017
-0.055
0.017
-0.006
-0.078
-0.024
0.003
0.005
-0.003
-0.009
-0.015
0.047
-0.029
-0.088
-0.143
-0.032
-0.002
-0.005
0.018
0.052
0.013
-0.016
-0.036
0.007
0.037
0.040
0.032
-0.152
0.047
-0.014
-0.030
0.040
-0.046
0.005
0.005
0.008
0.015
0.044
-0.057
-0.342
0.034
0.204
-0.029
-0.019
0.033
-0.009
-0.018
-0.061
0.000
-0.035
0.023
0.023
-0.021
-0.004
-0.012
-0.204
-0.548
-0.492
-0.470
-0.346
-0.320
0.366
-0.328
-0.174
-0.132
0.720
-0.033
-0.142
-0.142
-0.357
-0230
-0.057
-0.204
0.216
0.002
-0.157
-0.006
-0.017
0.060
0.022
0.027
0.047
0.827
0.128
0.008
0.004
0.011
0.009
0.002
0.000
Days to
flowering
Days to 50%
flowering
Days to 1st
fruit
green
harvest
Avg. wt. of
green fruits(g)
fruit
Avg.
length (cm)
Days to 1st ripe
fruit harvest
Avg. wt. of red
ripe
Avg. red ripe
fruit yield
seed/
120
No. of
fruit
Weight
seeds/fruit
Ascorbic acid
(mg/100g)
Oleoresin(%)
Capsaicin(%)
Genotypic
correlation
with green fruit
yield/plant(g)
3.962
-8.907
2.358
-0.049
-0.515
-0.037
1.428
0.964
-0.526
0.043
-0.087
-0.289
0.090
-0.013
0.010
-0.007
3.902
-8.839
2.376
-0.048
-0.507
-0.031
1.367
0.853
-0.390
0.048
-0.056
-0.302
0.138
-0.012
0.003
-0.005
2.034
-3.797
1.007
-0.0115
-0.725
-0.019
0.568
0.307
-0.1260
0.008
0.039
0.021
-0.228
-0.034
0.006
0.033
1.939
-4.063
1066
-0.074
-1.129
-0.013
0.097
0.230
0.892
0.021
0.041
0.072
0.140
0.005
0.015
0.025
-2.123
4.497
-1.024
0.031
0.207
0.073
-0.830
-1.309
0.510
0.025
0.175
0.046
0.239
0.034
-0.009
0.038
2.181
-4.866
1.242
-0.025
-0.042
-0.023
2.614
0.563
-1.336
0.023
-0.147
-0.102
-0.208
-0.078
0.070
-0.028
1.898
-4.139
0.977
-0.017
-0.125
-0.046
0.708
2.076
-1.616
-0.036
0.018
-0.113
-0.174
-0.047
0.058
-0.012
0.952
-1.743
-0.532
-0.005
0.375
-0.014
1.299
1.248
-2.688
-0.024
-0.136
-0.119
-0.163
-0.049
0.067
-0.007
0.423
2.944
-0.884
0.007
0.184
-0.014
-0.473
0.588
-0.514
-0.130
0.102
0.094
0.206
0.033
-0.031
-0.003
2.376
-0.858
0.147
0.005
0.051
-0.014
0.424
-0.043
-0.403
0.014
-0.908
-0.012
0.252
0.026
0.050
-0.030
-0.615
-5.350
1.487
0.005
0.170
-0.007
0.556
0.488
-0.665
0.025
-0.023
-0.482
0.159
0.017
-0.012
-0.008
-0.031
0.729
-0.295
-0.023
0.143
-0.015
0.491
0.326
-0.396
0.024
0.206
0.069
-1.110
-0.118
0.045
0.001
0.557
-0.805
0.192
-0.026
0.040
-0.016
1.370
0.661
-0.806
0.029
0.162
0.056
-0.875
-0.149
0.063
-0.011
0.175
-0.497
0.044
-0.003
-0.096
-0.003
0.992
0.655
-0.978
0.022
-0.246
0.032
-0.274
-0.051
0.185
-0.023
0.142
-0.834
0.184
0.051
0.381
-0.038
1.009
0.356
-0.257
-0.006
-0.366
-0.057
0.021
-0.023
0.057
-0.074
2.16
-4.440
1.128
-0.036
-0.198
-0.008
-0.214
0.415
-0.684
0.000
-0.271
-0.263
0.185
0.054
-0.014
0.022
1.382
0.556
0.344
0.383
-0.372
-0.354
0.331
0.182
0.139
0.723
0.264
0.144
0.294
0.375
0.231
0.061
17
1.018
0.970
0.636
0.359
-0.226
-0.168
0.409
0.520
-0.002
0.610
1.117
-0.340
-0.817
-0.162
-0.609
2.044
0.117
Plant
height
(days)
Avg. fruit
diameter(cm)
100
1
2
3
4
5
6
7
8
9
10
11
12
13
14
15
16
1st
S.No.
of
Table.4 Genotypic direct (diagonal) and indirect effects of 17 characters in chillies
1934
Int.J.Curr.Microbiol.App.Sci (2020) 9(7): 1930-1937
Path coefficient analysis
The data were subjected to path coefficient
analysis to partition the correlation
coefficients of all the component characters
with green fruit yield per plant in to direct and
indirect effects. The results of various causes
at genotypic and phenotypic level influencing
average fruit weight per plant (effect) are
presented in table 2.1 and table 2.2. The path
coefficient analysis revealed that the
characters like to first flowering (0.027), days
to 50% flowering (0.166), days to 1st green
fruit harvest(0.019) and fruit diameter (0.058)
exercised maximum direct effect on fruit
yield at phenotypic level. High positive direct
effect of number of seeds (0.91), ascorbic acid
(9.005) and 1st ripe fruit harvest (0.003) and
fruit diameter was the main cause of their
positive association with fruit yield. Plant
height (-0.680), weight of green fruits (0.004), fruit length (-0.189) and weight of red
ripe (-0.064) exercised minimum direct effect
on fruit yield phenotypic level, high negative
direct effect of weight of seeds/fruit (-0.002),
oleoresin a(-0.021) and capsaicin (-0.230) was
the main cause of their negative association
with average red ripe fruit yield. All these
characters had positive and negative direct
and indirect effect on total yield per plant
height (3.902), days to 50% flower (1.066),
days to 1st green fruit harvest, fruit diameter
(1.299), days to 1st ripe fruit harvest (0.588).
Red ripe fruit yield (0.25),number of
seeds/fruit (0.206), weight of seeds/fruit
(0.056) exercise maximum direct effect on
fruit yield at genotypic level. Days to 1st
flowering (-3.797), weight of green fruit (0.403), ascorbic acid (-0.274) oleoresin (0.023) and capsaicin content (-0.014) had
minimum negative direct effect on fruit yield.
The estimates of residual effect reflect the
adequacy and appropriateness of the character
chosen for path coefficient analysis. In the
present investigation the residual effect was
very high (1.729) indicating the adequacy of
the characters chosen for the study and the
characters studied contributed approximately
90 percent towards yield. Correlation
measures only mutual relationship with
concern to cause and effect. Path coefficient
analysis provides a method for separating out
direct and indirect effects and measures the
relative importance of causal factors which
ultimately affect the yield. Path coefficient is
simply standardized partial regression
coefficient which splits the correlation
coefficients into the measures of the direct
and indirect effects of a set of independent
variable on the dependent variable. The
analysis of path coefficient revealed highest
amount of positive direct effect for yield per
plant followed by fruit weight, days to 50
percent flowering and plant height has also
positive direct effect on yield at genotypic and
phenotypic level. However, fruit length per
plant, ascorbic acid, oleoresin and capsaicin
content had negative direct effect on yield at
both genotypic and phenotypic levels. Fruit
length and diameter of fruit had negative
direct effect yield at genotypic level. Similar
results were also reported by Nanda Devi et
al., (2003), Nazier et al., (2005), and Devi
and Arumugam (1999) that green fruit yield
per plant had the positive effect on dry fruit
yield per plant.
In conclusion, the magnitude of genotypic
correlation was higher than the phenotypic
correlation for all the character. The most
important trait green fruit yield per plant was
significant and positively correlated with
phenotypic correlation average red ripe fruit
yield plant height days to 1st ripe fruit harvest,
length and fruit diameter, weight of red ripe
fruit, no of seeds/fruit, weight of seeds/fruit,
ascorbic acid oleoresin and capsaicin content.
Mostly important trait of green fruit yield per
plant was significantly and negative
correlated with phenotypic correlation with
days to first flowering, days to 50%
flowering, days to first green fruit harvest and
1935
Int.J.Curr.Microbiol.App.Sci (2020) 9(7): 1930-1937
days to first ripe fruit harvest. The most
important traits green fruit yield was
significantly and positive correlated with
genotypic correlation with plant height,
average weight of green fruits, average fruit
length average, fruit diameter, average weight
of red ripe, average red ripe fruit yield, No. of
seeds/fruit, weight of seeds, Ascorbic acid,
oleoresin and capsaicin. Mostly important
trait green fruit yield was significantly and
negative correlated with genotypic correlation
with days to first flowering, days to 50%
flowering, days to first green fruit harvest,
and days to first fruit harvest. Path analysis
indicated positive direct contribution of days
to first flowering, days to 50% flowering,
Average fruit diameter days to first ripe fruit
harvest, No. of seeds/fruit, Ascorbic acid and
green fruit with phenotypic levels and
phenotypic levels. Plant height, weight of
green fruit, Average weight of green fruit,
Average weight of red ripe fruit fruits length,
weight of seeds, oleoresin, Ascorbic acid and
capsaicin content had negative indirect effect
at phenotypic levels. Plant height, days to
50% flowering, days to first green fruit
harvest, fruit diameter, days to first harvest ,
Average red ripe fruit yield, No of seeds/fruit,
weight of seeds/fruit , with green fruit yield
had positive direct effect genotypic levels.
Path analysis indicated negative indirect
contribution of days to first flowering,
Average weight of green fruit, Average fruit
length, Average weight of red ripe fruit,
Ascorbic acid, Oleoresin and capsaicin with
genotypic levels. Based on per se
performance SM-20, JCA-9, Pusa Jawaala,
Utkal Ragini and Kashi anmol exhibited high
fruit yield per plant. SM-20 found to be
highest yield i.e. 168.42g/plant.
References
Al-Jibouri, H.A.; Miller, P.A and Robinson,
H.F.
(1958).
Genetic
and
environmental
variance
and
covariance in an upland cotton cross
of interspecific origin. Agron. J.,50:
633-636.
Choudhary, B.S and Samodia, D.K. (2004).
“Variability and character association
in chilli land racess and genotypes
under arid environment. India. J.Hort.
61(2) 132-136.
Devi, D.S and Arumugam (1999).
“Correlation and Path coefficient
analysis.” Res. Hisar, 17(1): 90-93.
Deway, D.R and L, K.H. (1959). Corellation
and Path coefficient analysis of
component of crested wheat grass seed
production. Indian J. Agron., 51: 515518.
Lenka, D. and Mishra, B. (1973). Path
coefficient analysis of yield in rice
varieties. Indian J. Agric. Science 43:
376-379.
Nandadevi
and
Hosamani,
R.(2003).
Variability, correlation and path
analysis in Kharif grown chilli
(capsicum annuum L.)”. Capsicum
and Eggplant News letter, (22): 43-46.
Nazier, G. Narayan, R. , Hussian, K. Ahmed,
N. and Bhat, K.(2005) “ Correlation
and Path coefficient analysis in sweet
papper Veg. Sci. 3(1) 88-89.
Robinson, H.F.; Comstock, R.E and Harvery,
P.H.(1951).
“Genotypic
and
Phenotypic correlation in corn and
their implication in selection.” Agron.
J., 43: 282-287.
Singh, H.N., Singh, B., Kallo, G. and
Mehrotra,
N.(1972).
Genetic
variability and correlation studies in
(Capsicum annuum L.). Haryana J.
Agric. Res., 11(1): 13-18.
Sreelatha Kumary and Rajamony (2002).
“Pheneotypic
and
genotypic
coefficient in Capsicum annuum L”
.Indian J. of Hort. 59(1):77-83.
1936
Int.J.Curr.Microbiol.App.Sci (2020) 9(7): 1930-1937
How to cite this article:
Mishra, T.S. and Singh, H.M. 2020. Study on Phenotypic, Genotypic Correlation and Path
Coefficients in Chilli. Int.J.Curr.Microbiol.App.Sci. 9(07): 1930-1937.
doi: />
1937