Nomogram model for predicting causespecific mortality in patients with stage I small-cell lung cancer: A competing risk analysis
Bạn đang xem bản rút gọn của tài liệu. Xem và tải ngay bản đầy đủ của tài liệu tại đây (1.59 MB, 10 trang )
Li et al. BMC Cancer
(2020) 20:793
/>
RESEARCH ARTICLE
Open Access
Nomogram model for predicting causespecific mortality in patients with stage I
small-cell lung cancer: a competing risk
analysis
Jianjie Li1†, Qiwen Zheng2†, Xinghui Zhao1†, Jun Zhao1, Tongtong An1, Meina Wu1, Yuyan Wang1, Minglei Zhuo1,
Jia Zhong1, Xue Yang1, Bo Jia1, Hanxiao Chen1, Zhi Dong1, Jingjing Wang1, Yujia Chi1, Xiaoyu Zhai1 and
Ziping Wang1*
Abstract
Background: The five-year cumulative incidence rate in patients diagnosed with stage I small-cell lung cancer
(SCLC) who were instructed to undergo surgery was from 40 to 60%.The death competition influence the accuracy
of the classical survival analyses. The aim of the study is to investigate the mortality of stage I small-cell lung cancer
(SCLC) patients in the presence of competing risks according to a proportional hazards model, and to establish a
competing risk nomogram to predict probabilities of both cause-specific death and death resulting from other
causes.
Methods: The study subjects were patients diagnosed with stage I SCLC according to ICD-O-3. First, the cumulative
incidence functions (CIFs) of cause-specific death, as well as of death resulting from other causes, were calculated.
Then, a proportional hazards model for the sub-distribution of competing risks and a monogram were constructed
to evaluate the probability of mortality in stage I SCLC patients.
Results: 1811 patients were included in this study. The five-year probabilities of death due to specific causes and
other causes were 61.5 and 13.6%, respectively. Tumor size, extent of tumor, surgery, and radiotherapy were
identified as the predictors of death resulting from specific causes in stage I SCLC. The results showed that surgery
could effectively reduce the cancer-specific death, and the one-year cumulative incidence dropped from 34.5 to
11.2%. Like surgery, chemotherapy and radiotherapy improved the one-year survival rate.
(Continued on next page)
* Correspondence:
†
Jianjie Li, Qiwen Zheng and Xinghui Zhao contributed equally to this work
and should be considered co-first authors.
1
Key Laboratory of Carcinogenesis and Translational Research (Ministry of
Education/Beijing), Department of Thoracic Medical Oncology, Peking
University Cancer Hospital & Institute, 52 Fucheng Road, Haidian District,
Beijing 100142, China
Full list of author information is available at the end of the article
© The Author(s). 2020 Open Access This article is licensed under a Creative Commons Attribution 4.0 International License,
which permits use, sharing, adaptation, distribution and reproduction in any medium or format, as long as you give
appropriate credit to the original author(s) and the source, provide a link to the Creative Commons licence, and indicate if
changes were made. The images or other third party material in this article are included in the article's Creative Commons
licence, unless indicated otherwise in a credit line to the material. If material is not included in the article's Creative Commons
licence and your intended use is not permitted by statutory regulation or exceeds the permitted use, you will need to obtain
permission directly from the copyright holder. To view a copy of this licence, visit />The Creative Commons Public Domain Dedication waiver ( applies to the
data made available in this article, unless otherwise stated in a credit line to the data.
Li et al. BMC Cancer
(2020) 20:793
Page 2 of 10
(Continued from previous page)
Conclusions: We constructed a predictive model for stage I SCLC using the data from the SEER database. The
proportional sub-distribution models of competing risks revealed the predictors of death resulting from both
specific causes and other causes. The competing risk nomogram that we built to predict the prognosis showed
good reliability and could provide beneficial and individualized predictive information for stage I SCLC patients.
Keywords: SCLC, Competing risks, Cumulative incidence, Nomogram
Background
Small-cell lung cancer (SCLC) is one of the two main
types of lung cancer with short doubling time, high malignancy, and early and extensive metastasis, accounting
for approximately 15% of the lung malignancies. SCLC
is sensitive to radiotherapy and chemotherapy but highly
prone to drug resistance and relapse. The incidence of
SCLC is 6.0 per1000,000 persons [1], and the five-year
survival rate is 7%. Because of the pathophysiological
characteristics of SCLC, a vast majority of patients have
been diagnosed with lymph nodes or distant metastases
and lost indications for surgical treatment. Patients with
stage I SCLC were recommended to take surgery and
postoperative chemotherapy according to National Comprehensive Cancer Network (NCCN) Clinical Practice
Guidelines in Oncology (version 2.2018) [2].
Survival analyses are common statistical analysis
methods in prognosis research; however, classical survival analyses generally deal with only one type of event,
which the researchers are interested in, for example, relapse. Many SCLC patients ultimately die from other
diseases instead of lung cancer, indicating that there are
death competition causes in SCLC; therefore, it is necessary to use a competing risk regression model when
evaluating the prognosis of SCLC. In the presence of
competing risks, the classical survival analyses are inaccurate because we cannot assume that the follow-up
period is sufficiently long for the event we care about to
occur. Nomograms are statistical models, and the basic
principle of nomograms is to provide the score of each
influencing factor according to the contribution degree
of each influencing factor in the regression model, and
then, calculate the total score of an individual, so as to
obtain the predicted value of the individual.
In this study, we aimed to evaluate the effects of the
competing causes for the SCLC survival rate and to establish a competing risk nomogram to quantitatively
analyze the survival differences in SCLC patients.
Methods
Study population
The data on patients with stage IA and IB small cell lung
cancer (SCLC) were obtained from the SEER database
(2004–2014) using SEER*Stat (v8.3.2). The study cohort
consisted of the patients with the following International
Classification of Diseases for Oncology Third Edition
(ICD-O-3), morphology codes: 8002/3; 8041/3, 8042/3,
8043/3, 8044/3, and 8045/3; and the site codes: C34.0,
C34.1, C34.2, C34.3, C34.8, and C34.9. The exclusion
criteria were as follows: (1) age at diagnosis less than 18
years, (2) dead or without pathological information, and
(3) lack of complete epidemiology and clinical
information.
The demographic and clinical pathological data included age, gender, race, anatomical site, laterality,
tumor size, tumor degree, grade, and treatment forms.
Race was divided into black, white, and others. Three
groups were formed according to age (less than 60 years,
60–75 years, and more than 75 years). The anatomic
sites were divided into upper, middle, lower, bronchus,
and others. Laterality included left and right. The extent
of tumor was divided into local and regional, and the
grading was classified as good, moderate, poor, undifferentiated, and NOS. The forms of treatment were surgery, chemotherapy, and radiotherapy. The complete
SEER session information was added to a supplemental
document.
Statistical analysis
The primary end-point of the study was cause-specific
mortality. According to the cause of death (COD) code,
we classified the cause of death as cancer-specific death
and death resulting from other causes. The covariates
added to the model were mainly selected from the available clinically prognostic factors recorded in the SEER
database. The covariates included were gender, age, race
(black, white, or others/unknown), anatomic sites
(upper, middle, lower, bronchus, or others), laterality
(left or right), tumor size, extent of tumor (local or regional), grading (good, moderate, poor, undifferentiated,
or NOS), chemotherapy (yes or no), radiotherapy (yes or
no), and surgery (yes or no). For describing the probability of death, we chose the cumulative incidence function
(CIF) and Gray’s test [3]. Ages at diagnosis were
regrouped as follows: less than 60 years, 60–75 years,
and more than 75. Tumor sizes were grouped into three
categories: ≤3 cm, 3–5 cm, and > 5 cm.
We adopted the Fine and Gray proportional hazards
model to assess the three- and five-year probabilities of
the two competing mortality events [4]. The restricted
Li et al. BMC Cancer
(2020) 20:793
cubic splines with three empirical knots (10, 50, and
90%) were fitted to the model [5]. Gray’s test was used
to compare the difference in the CIF between the two
different outcomes. Backward stepwise selection based
on Bayesian Information Criterion was used to further
eliminate redundant variables. The resulting multivariate
Cox regression model was used to calculate risk score
and build the final nomogram prognostic model. The
Harrell C index5 was applied to indicate the discrimination, and the calibration plot obtained using the
method provided by Gray [3] was adopted to evaluate
the calibration [6, 7]. Both discrimination and calibration
were assessed by bootstrapping with 1000 resamples.
All the statistical analyses were carried out with the R
software (v3.3.3). The R packages cmprsk [8], mstate [9]
and rms [10] were used for modeling and developing the
nomogram. All the reported significance levels were
two-sided, and the P value for statistical significance was
defined as P < 0.05.
Results
Patient characteristics
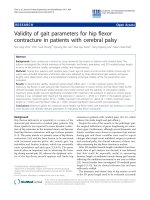
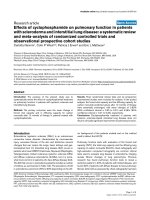
We selected 1811 eligible stage I SCLC patients (Fig. 1).
The distribution of the patients’ demographics and
Page 3 of 10
clinical characteristics is presented in Table 1. Of these,
342 (18.9%) patients were aged < 60 years, 981 (54.2%)
were aged 60–74 years, and 488 (26.9%) were aged more
than 75 years. The number of female patients was 949
(52.4%) and that of the Caucasians was 1578 (87.1%).
The most common site was the upper lobe (56.6%),
followed by the lower lobe (27.9%) and the other areas
(15.56%). The number of patients with a right-sided primary tumor was 1018 (56.2%). The distribution of the
tumor size was 53.4, 28.9, and 17.7% for < 3 cm, 3–5 cm,
and > 5 cm. As for the tumor extension, the local and
the regional ones accounted for 84.3 and 15.7%, respectively. In all, 457 (25.2%) patients were treated with
surgery, 929 (51.3%) patients were treated with radiotherapy, and 1217 (67.2%) patients were treated with
chemotherapy.
The median follow-up for these patients was 16
months (range: 7 to 33 months). During the followup period, 1221 patients died: 986 died of specific
causes, and 235 died of other causes. The top three
other causes of death were heart disease (27.2%),
chronic obstructive pulmonary disease (COPD) and
allied conditions (20.9%), and cerebrovascular
diseases (4.7%).
Fig. 1 Flow chart showing the process of patient selection. Patients were selected according to several criteria: (1) stage IA-IB, (2) cases with
complete information about survival, follow-up months, and cause of death, (3) cases with known tumor size
Li et al. BMC Cancer
(2020) 20:793
Page 4 of 10
Table 1 One-, three-, and five-year cumulative incidence of mortality in stage I SCLC patients
Characteristics
Total
N
%
1811
Event
%
1221
Cancer-specific death
Death from other causes
1-year (%)
3-year (%)
5-year (%)
28.7
56.5
61.5
Age at diagnosis
P
1-year (%)
3-year (%)
5-year (%)
5.8
11.1
13.6
< 0.001
0.001
< 60 years
342
18.9
192
15.7
18.6
49.8
53.1
5.2
7.7
8.2
60–75 years
981
54.2
640
52.4
26.1
53.5
59.5
5.5
10.7
14.3
> 75 years
488
26.9
389
31.9
40.9
67.1
71.4
6.9
14.2
15.9
Female
949
52.4
619
50.7
27.3
56.3
60.5
5.1
9.1
11.3
Male
862
47.6
602
49.3
30.1
56.7
62.6
6.5
13.3
16.0
Gender
0.574
Race
0.016
0.690
0.183
White
1578
87.1
1064
87.1
28.9
56.1
60.8
5.9
11.3
13.8
Black
167
9.2
111
9.1
26.4
57.9
66.0
5.7
7.8
9.9
Others
66
3.7
46
3.8
27.7
64.3
66.6
3.3
15.1
17.4
Anatomic sites
< 0.001
0.048
Upper
1025
56.6
685
56.1
26.5
55.9
60.6
5.6
11.8
14.5
Middle
115
6.4
76
6.2
22.7
51.6
55.1
12.5
19.8
19.8
Lower
505
27.9
336
27.5
29.4
55.7
61.8
5.1
8.0
11.1
Bronchus/others
166
9.2
124
10.2
43.6
66.0
70.5
4.5
9.9
10.8
Left-sided
793
43.8
522
42.8
28.1
55.3
59.8
6.2
12.0
14.1
Right-sided
1018
56.2
699
57.2
29.1
57.4
62.8
5.5
10.4
13.1
Primary tumor location
0.221
Tumor size
0.682
< 0.001
0.030
≤ 3 cm
967
53.4
602
49.3
23.7
50.6
55.0
5.7
12.1
15.7
3–5 cm
523
28.9
379
31.0
30.5
59.6
66.1
7.1
10.9
12.1
321
17.7
240
19.7
40.5
68.8
73.3
3.9
8.5
9.5
> 5 cm
Tumor extension
< 0.001
0.005
Local
1526
84.3
1020
83.5
27.9
55.4
59.7
6.3
11.8
14.6
Regional
285
15.7
201
16.5
32.5
62.2
71.3
3.3
7.3
8.0
Good or moderate
34
1.9
18
1.5
16.3
36.6
41.3
3.1
6.8
16.7
Poor
343
18.9
207
17.0
26.3
51.3
54.1
4.9
11.8
13.3
Undifferentiated
439
24.2
318
26.0
26.5
58.0
65.0
5.6
8.4
11.6
NOS
995
54.9
678
55.5
30.8
58.1
62.9
6.3
12.3
14.5
Grading
0.038
Surgery
0.375
< 0.001
0.593
Yes
457
25.2
214
17.5
11.2
35.6
40.4
4.6
9.5
12.0
No
1354
74.8
1007
82.5
34.5
63.4
68.5
6.2
11.6
14.1
Yes
1217
67.2
783
64.1
23.8
54.0
60.0
3.6
8.6
11.2
No
594
32.8
438
35.9
38.7
61.8
64.6
10.4
16.3
18.6
Chemotherapy
< 0.001
Radiotherapy
P
< 0.001
< 0.001
0.773
Yes
929
51.3
595
48.7
21.7
52.1
58.8
4.1
10.3
13.3
No
882
48.7
626
51.3
36.0
61.2
64.4
7.6
12.0
13.8
Li et al. BMC Cancer
(2020) 20:793
Probability of death
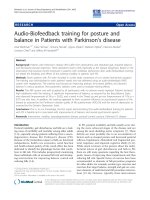
The cumulative incidence function curves are plotted in
Fig. 2. The one-, three-, and five-year estimates of the
cumulative incidence of mortality according to the age
at diagnosis, gender, race, anatomic sites, laterality,
tumor size, tumor extension, grading, and treatment are
summarized in Table 1. The five-year cumulative incidence of mortalities resulting from specific causes and
other causes was 61.5 and 13.6%, respectively. Patients
with the characteristics of big tumor size, regional tumor
extension, older age, and no surgery, chemotherapy, and
radiotherapy were associated with high cause-specific
death probabilities. Patients aged more than 75 years had
the highest probability of death resulting from specific
causes (71.4%). The cumulative incidence of causespecific death for patients who did not undergo surgery
was as low as 40.4%. As for the patients who did not receive chemotherapy and radiotherapy, their cumulative
incidence of cause-specific death was 64.6 and 64.4%,
respectively.
Considering the non-linear effect of age and tumor
size, we used restricted cubic splines to flexibly model
continuous variables. We conducted the joint test to see
whether the group of coefficients as a whole was statistically significant or not (P < 0.001). As the results of
competing risk model displayed on Table 2, tumor size,
extent of tumor, laterality of tumor, surgery, and radiotherapy could strongly predict cancer-specific death.
Patients who underwent surgery or radiotherapy had a
lower cause-specific mortality, with a subdistribution
hazard ratios (sdHR) of 0.370 (95%CI 0.304–0.450) and
0.553 (95%CI 0.477–0.641), respectively. Patients with
regional tumor extension were more likely to die of their
disease, with an sdHR of 1.434 (95%CI 1.216–1.693),
when compared with local extension. Additionally, rightsided and larger tumor size were also associated with
worse cancer-specific outcomes. For those patients who
died from other causes, age, male, local extension, and
patients without chemotherapy had a more aggressive
impact, with a higher sdHR.
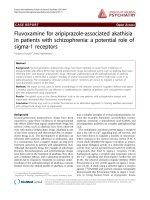
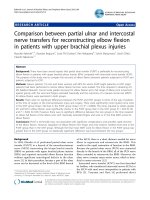
Nomogram
The nomogram built on the basis of Fine and Gray’s
model is shown in Fig. 3. The nomogram was used to
find the corresponding score on the points row above
the graph for each variable included in the model. All
the assigned scores of the variables were added to obtain
the total score, and then, a straight line was drawn to
the bottom of the graph to estimate the probability of
death.
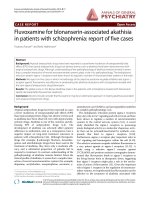
Model performance
The Harrell C index [5] was applied to indicate the
discrimination, and a calibration plot obtained using the
Page 5 of 10
method provided by Gray [2], which was adopted to
evaluate calibration. Discrimination, as measured by the
1000 resample bootstrap-corrected C index, was 0.696
(95% CI: 0.688–0.705) for the cancer-specific death and
0.672 (95% CI: 0.650–0.694) for other causes resulting in
death. The calibration plot (Fig. 4) showed a high
consistency between the predicted and the observed
events.
Discussion
In this study, we assessed the cumulative incidence of
mortality resulting from different causes in stage I
SCLC patients, who were a part of a large cohort
considered in the SEER database. At the same time,
we constructed a proportional sub-distribution model
and a competing risk nomogram with variables to
investigate the three- and five-year cause-specific
mortality.
Previous study [11–16] showed that the five-year
cumulative incidence rate in patients diagnosed with
stage I SCLC who were instructed to undergo surgery
was from 40 to 60%. A retrospective analysis from
the SEER database showed that patients with stage I
SCLC who underwent lobectomy had a higher 5-year
survival of 50.3% [17]. In our study, the five-year cumulative incidence rates of cause-specific and other
cause-related mortality were 61.5 and 13.6%, respectively, indicating that SCLC had a high mortality rate
and poor prognosis. However, many patients died
from other diseases despite the poor prognosis. With
an increase in the age and the tumor size, the cumulative incidence of death resulting from all the causes
gradually increased. The treatment of SCLC, including
surgery, chemotherapy, and radiotherapy, diminished
the cumulative incidence of mortality of all the
causes. The regional extent of a tumor statistically increased the cumulative incidence, which indicated
that the treatment of the limited early stage of cancer
was beneficial to the patients’ prognosis. For example,
a 70 years patient with tumor size of 4 cm and
regional extent of tumor, receiving surgery and radiotherapy has an estimate of 3-year and 5-year probability of death due to lung cancer of 33.7 and 38.1%,
respectively.
According to the present competing risk model, the
predictors of cause-specific death for stage I SCLC
included tumor size, extent of tumor, surgery, and
radiotherapy. There was a high probability in patients
with the characteristics of the regional extent of
tumor, large tumor size, no surgery, or radiotherapy
to die of SCLC. Gender did not affect the causespecific mortality, but the male patients were more
prone to dying from other causes. Age affected other
cause-related SCLC mortality. Hence, it is important
Li et al. BMC Cancer
(2020) 20:793
Page 6 of 10
Fig. 2 Cumulative incidence estimates of mortality of stage I SCLC patients by key characteristics (dotted line: death from other causes, solid line:
cause-specific death)
Li et al. BMC Cancer
(2020) 20:793
Page 7 of 10
Table 2 Proportional Subdistribution Hazard Models of Probabilities of Cancer-Specific Death and Death from Other Causes for
Patients with Stage I SCLC
Characteristics
Cancer-Specific Death
Death from Other Causes
Coefficient
sdHR
P
Coefficient
sdHR
Age
0.011
1.010 (0.997–1.024)
0.130
0.056
1.057 (1.010–1.105)
0.015
Age’
0.015
1.015 (0.999–1.031)
0.065
−0.050
0.951 (0.911–0.993)
0.024
(95%CI)
(95%CI)
P
Tumor size
0.118
1.125 (1.013–1.249)
0.027
−0.106
0.899 (0.746–1.083)
0.260
Tumor size’
−0.071
0.931 (0.806–1.076)
0.340
0.044
1.045 (0.780–1.399)
0.770
Male
−0.024
0.976 (0.858–1.110)
0.720
0.332
1.393 (1.071–1.811)
0.013
Black
− 0.022
0.978 (0.805–1.187)
0.830
−0.454
0.634 (0.368–1.094)
0.100
Others
−0.159
0.853 (0.591–1.231)
0.400
−0.028
0.972 (0.490–1.929)
0.940
Middle
−0.248
0.780 (0.580–1.050)
0.100
0.424
1.528 (0.937–2.492)
0.089
Lower
0.011
1.010 (0.874–1.168)
0.880
−0.256
0.774 (0.564–1.060)
0.110
Bronchus/Other
0.256
1.291 (1.018–1.636)
0.034
−0.192
0.825 (0.492–1.382)
0.470
Right-sided
0.149
1.160 (1.015–1.324)
0.028
−0.132
0.876 (0.669–1.147)
0.340
0.361
1.434 (1.216–1.693)
< 0.001
− 0.516
0.597 (0.381–0.934)
0.024
0.171
1.186 (0.701–2.006)
0.520
−0.213
0.807 (0.317–2.053)
0.650
Race
Anatomic sites
Regional
Grading
Poorly
Undifferentiated
0.229
1.257 (0.748–2.111)
0.390
−0.353
0.702 (0.277–1.779)
0.460
NOS
0.156
1.168 (0.698–1.955)
0.550
−0.108
0.897 (0.356–2.259)
0.820
Surgery
−0.992
0.370 (0.304–0.450)
< 0.001
−0.162
0.850 (0.590–1.223)
0.380
Chemotherapy
−0.064
0.937 (0.801–1.096)
0.420
−0.582
0.558 (0.411–0.758)
< 0.001
Radiotherapy
−0.592
0.553 (0.477–0.641)
< 0.001
0.182
1.199 (0.885–1.625)
0.240
Note: Age’ and Tumor size’ are constructed spline variables (when k = 3)
to take actions to prevent older patients from dying
from other diseases irrespective of the SCLC treatment. We did not find any significant effects of race
and laterality on cause-specific death and death from
other causes. Anatomic sites and grading were only
significant in the cases of cause-specific death. Wang
et al. [18] developed a nomogram prognostic model
for SCLC patients and validated the model using an
independent patient cohort. Their nomogram performs better than earlier models, including those
using AJCC staging. However, because of lacking the
Stage I SCLC competing risk analyses in their model,
we cannot compare the results between Wang’s
model and our model in this study.
Patients diagnosed with SCLC without any lymph
node metastasis at a very early stage may undergo
surgical resection of the lesion as the initial treatment
procedure. According to the National Comprehensive
Cancer Network guidelines, postoperative chemotherapy is recommended for stage I SCLC rather than
radiation. Our study showed that surgery could effectively reduce the number of cancer-specific deaths and
that the one-year cumulative incidence dropped from
34.5 to 11.2%. Like surgery, chemotherapy and radiotherapy improved the one-year survival rate. It is necessary to consider radiation before or after surgery,
and this needs more validation. As SCLC is characterized by rapid growth, high invasiveness, and early metastasis, the five-year cumulative incidence was
relatively high irrespective of the form of treatment.
Our results indicated that treatment did not benefit
the five-year survival rate. Therefore, early diagnosis
and treatment are very critical and can markedly improve the one-year survival rate.
It is undeniable that our prediction model has some
limitations. First, approximately 27% of the patients in
our study were diagnosed during 2012–2014, which
resulted in relatively short follow-up time. We could
expect that longer follow-up time may help to improve the accuracy of model prediction. Second,
several treatment-related factors weren’t included in
the model, such as the plans of chemotherapy, number of cycles, the doses and methods of radiotherapy
and the follow up treatment after recurrence. These
Li et al. BMC Cancer
(2020) 20:793
Page 8 of 10
Fig. 3 Nomogram to predict three- and five-year probabilities of mortality due to different causes for stage I SCLC patients: a cause-specific death
and b death from other causes
factors can also influence the prognosis. Third, our
model only provides a reference to clinical doctors.
More complicated clinical factors will also be taken
into account in their treatment decisions. Fourth, the
comorbidity was a significant factor when physicians
deciding treatment strategies. It was indeed a limitation that we established a prognostic model without
comorbidity information. But we considered other
vital clinical characters which could be obtained in
SEER database with large sample and we believed this
model could also providing valuable implications in
clinical practice for stage I SCLC patients.
Conclusions
The cumulative incidence of mortality due to specific
causes and other causes in stage I SCLC patients was
calculated using a SEER database analysis. We also constructed the competing risk regression model for stage I
Li et al. BMC Cancer
(2020) 20:793
Page 9 of 10
Fig. 4 Calibration plot indicating the performance of the nomogram
SCLC and a competing risk nomogram to predict the
three- and five-year cause-specific mortality individually.
The nomogram could predict the prognosis conveniently
and directly for stage I SCLC patients and help clinicians
to make critical treatment decisions and choose appropriate strategies.
Supplementary information
Supplementary information accompanies this paper at />1186/s12885-020-07271-9.
Additional file 1.
Abbreviations
SCLC: Small-cell lung cancer; CIFs: Cumulative incidence functions;
NCCN: National Comprehensive Cancer Network; SEER: Surveillance,
Epidemiology, and End Results; sdHR: Sub-distribution hazard ratio;
COPD: Chronic obstructive pulmonary disease; NOS: Not otherwise specified;
CI: Confidence interval
Funding
This work was financially supported by the Science Foundation of Peking
University Cancer Hospital(18–02); Beijing Municipal Administration of
Hospitals Incubating Program (PX2019038); Science Foundation of Peking
University Cancer Hospital (2017–18).
Availability of data and materials
Limited Use Agreement for Surveillance, Epidemiology, and End Results
(SEER) Program () SEER*Stat Database: accession
number (15586-Nov2016). The data can be used publicly.
Ethics approval and consent to participate
The study was exempted from ethical review by the Beijing Cancer Hospital.
We obtained the data agreement and downloaded the files directly from the
SEER website in accordance with SEER requirements. The reference number
was 15586-Nov2016.
Consent for publication
Not applicable.
Competing interests
The authors declare that they have no competing interests.
Author details
Key Laboratory of Carcinogenesis and Translational Research (Ministry of
Education/Beijing), Department of Thoracic Medical Oncology, Peking
University Cancer Hospital & Institute, 52 Fucheng Road, Haidian District,
Beijing 100142, China. 2Department of Epidemiology and Biostatistics, School
of Public Health, Peking University, Beijing, China.
1
Acknowledgments
The authors acknowledge the efforts of the SEER program in the creation of
the SEER database.
Authors’ contributions
ZP. W and J. Z conceived and designed of the research. JJ. L and QW. Z
carried out data acquisition analysis and interpretation. JJ. L and XH. Z
drafted and revised the manuscript. TT. A, MN. W, YY. W and ML. Z provided
assistance for the interpretation of the results. J. Z, B. J, X. Y and HX. C
provided assistance for data acquisition, data analysis and statistical
analysis. Z. D, JJ. W, YJ. C and XY. Z collected the background information.
All the authors have read and approved the content of the manuscript.
Received: 19 September 2019 Accepted: 7 August 2020
References
1. Lu T, Yang XD, Huang YW, Zhao MN, Li M, Ma K, Yin JC, Zhan C, Wang Q.
Trends in the incidence, treatment, and survival of patients with lung
cancer in the last four decades. Cancer Manag Res. 2019;11:943–53.
Li et al. BMC Cancer
2.
3.
4.
5.
6.
7.
8.
9.
10.
11.
12.
13.
14.
15.
16.
17.
18.
(2020) 20:793
National Comprehensive Cancer Network. (NCCN) Clinical Practice Guide
lines in Oncology. Small Cell Lung Cancer (V2.2018). Available at https://
www.nccn.org/professionals/physician_gls/pdf/sclc.pdf.
Gray RJ. A class of k-sample tests for comparing the cumulative incidence
of a competing risk. Ann Stat. 1988;16:1141–54.
Fine JP, Gray RJ. A proportional hazards model for the sub-distribution of a
competing risk. J Am Stat Assoc. 1999;94:496–509.
Harrel FE. Regression Modeling strategies: general aspects of fitting
regression models. New York, NY: Springer; 2001.
Harrell F. Regression modeling strategies: with applications to linear models,
logistic and ordinal regression, and survival analysis. Springer Series in
Statistics: Springer; 2015.
Wolbers M, Koller MT, Witteman JC, Steyerberg EW. Prognostic models with
competing risks: methods and application to coronary risk prediction.
Epidemiology. 2009;20:555–61.
Harrell FJ, Lee KL, Mark DB. Multivariable prognostic models: issues in
developing models, evaluating assumptions and adequacy, and measuring
and reducing errors. Stat Med. 1996;15(4):361–87.
Gray B. cmprsk: Sub-distribution Analysis of Competing Risks. R package
version 2.2–7; 2014.
de Liesbeth C. Wreede, Marta Fiocco, Hein putter. Mstate: an R package for
the analysis of competing risks and multi-state models. J Stat Slftw. 2011;
38(7):1–30.
Harrell FE. rms: Regression Modeling Strategies. R package version 5.1–2;
2018.
Schreiber D, Rineer J, Weedon J, Vongtama D, Wortham A, Kim A, Han P,
Choi K, Rotman M. Survival outcomes with the use of surgery in limitedstage small cell lung cancer: should its role be re-evaluated? CANCER-AM
CANCER SOC. 2010;116(5):1350–7.
Brock MV, Hooker CM, Syphard JE, Westra W, Xu L, Alberg AJ, Mason D,
Baylin SB, Herman JG, Yung RC, et al. Surgical resection of limited disease
small cell lung cancer in the new era of platinum chemotherapy: its time
has come. J Thorac Cardiovasc Surg. 2005;129(1):64–72.
Lim E, Belcher E, Yap YK, Nicholson AG, Goldstraw P. The role of surgery in
the treatment of limited disease small cell lung cancer: time to reevaluate. J
Thorac Oncol. 2008;3(11):1267–71.
Shields TW, Higgins GJ, Matthews MJ, Keehn RJ. Surgical resection in the
management of small cell carcinoma of the lung. J Thorac Cardiovasc Surg.
1982;84(4):481–8.
Yu JB, Decker RH, Detterbeck FC, Wilson LD. Surveillance epidemiology and
end results evaluation of the role of surgery for stage I small cell lung
cancer. J Thorac Oncol. 2010;5(2):215–9.
Schneider BJ, Saxena A, Downey RJ. Surgery for early-stage small cell lung
cancer. J Natl Compr Cancer Netw. 2011;9(10):1132–9.
Wang S, Yang L, Ci B, Maclean M, Gerber DE, Xiao G, Xie Y. Development
and validation of a Nomogram prognostic model for SCLC patients. J
Thorac Oncol. 2018;13(9):1338–48.
Publisher’s Note
Springer Nature remains neutral with regard to jurisdictional claims in
published maps and institutional affiliations.
Page 10 of 10