Comparative analysis of 14-3-3 isoform expression and epigenetic alterations in colorectal cancer
Bạn đang xem bản rút gọn của tài liệu. Xem và tải ngay bản đầy đủ của tài liệu tại đây (1.01 MB, 10 trang )
Young et al. BMC Cancer (2015) 15:826
DOI 10.1186/s12885-015-1856-y
RESEARCH ARTICLE
Open Access
Comparative analysis of 14-3-3 isoform
expression and epigenetic alterations in
colorectal cancer
Gavin M. Young1, Vijayababu M. Radhakrishnan2, Sara M. Centuori4, Cecil J. Gomes4,5 and Jesse D. Martinez3,5*
Abstract
Background: The 14-3-3 family is a group of intracellular proteins found in all eukaryotic organisms. Humans have
seven isoforms that serve as scaffolds to promote interactions of regulatory phospho-proteins involved in many
vital cellular processes and previous studies have shown that disturbances in native 14-3-3 levels can contribute
significantly to the development of various cancers.
Methods: DNA and RNA was extracted from frozen tissue samples collected by the Human Cooperative
Tissue Network. RNA samples were reverse transcribed and subjected to qRT-PCR analysis using fluorescently
labelled probes. Genomic DNA was treated with bisulfite and cloned into bacterial vectors for subsequent
high-resolution sequencing. Mammalian NIH3T3 cells were transformed with 14-3-3 eta and Ras expression vectors
synthesized from cDNA. Colonies were counted and transforming capability assessed after 21 days of growth. Cell
lysates were analyzed by western blot to verify protein expression.
Results: Here we examined normal and cancerous 14-3-3 expression levels of all seven isoforms in a cohort of
sporadic colorectal adenocarcinomas and in a group of tumors and their matched normals using qRT-PCR analysis. We
found a statistically significant decrease in the levels of 14-3-3 sigma, eta, and zeta observed among adenocarcinomas
compared to normal tissue. A parallel analysis of microarray data from the TCGA dataset confirmed that expression of
sigma and eta were down-regulated in colon tumors. To explore the mechanisms behind 14-3-3 expression changes,
we examined the methylation status of the sigma, eta, and zeta gene promoters in selected samples. Our data identified
novel CpG methylation sites in the eta promoter consistent with epigenetic silencing of both 14-3-3 sigma and eta
isoforms during colon tumorigenesis. Because epigenetic silencing is the hallmark of a tumor suppressor we tested eta
in focus formation assays and found that it is capable of suppressing ras-induced transformation of NIH3T3 cells.
Conclusion: To our knowledge, this is the first study to identify the 14-3-3 eta gene as a tumor suppressor and that its
expression is suppressed in colon tumors by DNA hypermethylation. These data suggest a link between 14-3-3
expression levels and the development of colon cancers.
Keywords: qRT-PCR, Colorectal cancer, 14-3-3, DNA methylation, Epigenetics
* Correspondence:
3
Department of Cell & Molecular Medicine, University of Arizona Cancer
Center, 1515 N. Campbell Ave, Tucson 85724, Arizona, USA
5
University of Arizona Cancer Center, 1515 N. Campbell Ave, Tucson 85724,
Arizona, USA
Full list of author information is available at the end of the article
© 2015 Young et al. Open Access This article is distributed under the terms of the Creative Commons Attribution 4.0
International License ( which permits unrestricted use, distribution, and
reproduction in any medium, provided you give appropriate credit to the original author(s) and the source, provide a link to
the Creative Commons license, and indicate if changes were made. The Creative Commons Public Domain Dedication waiver
( applies to the data made available in this article, unless otherwise stated.
Young et al. BMC Cancer (2015) 15:826
Background
The 14-3-3 proteins are a family of small, highly conserved,
acidic proteins with molecular masses of 28–33 kDa. They
are found in all eukaryotic species. There are seven different 14-3-3 proteins in mammalian cells, each designated
by a Greek letter (β-beta, γ-gamma, δ-delta, ε-epsilon,
ζ-zeta, θ/τ-theta/tau, η-eta) and each protein is nearly
80 % similar in their amino acid sequences. There is
a highly conserved ligand-binding domain that interacts with phosphorylated serine residues on cellular
proteins which targets two high-affinity binding motifs:
RSXpSXP (mode1) and RXXXpSXP (mode 2). The ligandbinding domains are the most highly conserved regions of
14-3-3 proteins and all have uniformly high affinity for the
binding motifs [1]. It is through these interactions that 143-3 proteins exert their biological activity since they have
no enzymatic or transcriptional activity of their own.
Although very similar in structure, 14-3-3 proteins
serve a number of diverse functions throughout human
tissues. Individual regulation of 14-3-3 family members
is tightly controlled in many tissues including dermal
and epidermal layers [9], bones [14], and developing
neurons [2, 17]. Several studies have also shown 14-3-3
proteins play critical roles as signal integration points
for cell cycle control, apoptosis, and mitogenic signal
transduction [4, 5]. Dysregulation of these proteins has
also been linked to several human diseases and that 143-3s have even been proposed as potential therapeutic
drug targets [31].
14-3-3 proteins have recently come to prominence due
to new evidence suggesting they may play a role in human tumorigenesis [29]. For example several studies
have shown that 14-3-3 sigma acts as a tumor suppressor and that its expression is often suppressed during
the development of breast cancers [12]. Consistent with
these findings, 14-3-3 sigma expression is induced by
p53 [8] and can suppress the formation of foci induced
by ras and myc in rodent cell transformation assays [24].
The expression of other 14-3-3 isoforms, such as gamma
and zeta, appears to be upregulated in a number of human tumors [23, 27], suggesting they may exhibit oncogenic properties. Studies in lung and breast cancers have
identified a dysregulation of 14-3-3 gene expression in
these tumors compared to normal tissue [18, 22]. Loss
of 14-3-3 sigma expression remains one of the most
consistently observed molecular changes in both breast
and colon cancers [3, 20].
To date, only a few studies of human tumors in
lung [22], in astrocytomas [30], and in meningiomas
[15] have simultaneously characterized the expression
levels of all seven 14-3-3 isoforms. The expression
levels of the 14-3-3 isoforms have not been characterized
in colorectal cancers. Our objective was to determine
whether there is a change in expression in relation to
Page 2 of 10
normal colonic tissue as well as to identify 14-3-3 genes
who’s expression is altered during colon tumorigenesis.
Methods
Clinical characteristics of patients and samples
A total of 123 tissue samples were analyzed, taken from
113 patients of varying background: 48 male, 75 female,
average age 63 years (range, 15–89 years), 10 black, 99
white, 14 unspecified. Sample set consisted of 71 malignant adenocarcinomas and 52 non-tumor controls including 11 patient-matched pairs. All adenocarcinomas
(56 Grade II and 15 Grade III) were confirmed by pathological evaluation and contained a minimum density of
51 % lesion/49 % stroma. Stromal tissue does not appear
to contribute significantly to a tissue’s 14-3-3 expression
when analyzed by immunohistochemistry [23]. The dataset included patients with varying stages of colorectal cancer (14 Stage I, 28 Stage II, 28 Stage III, and 4 Stage IV).
The control group included various diagnoses: 12 diverticulosis, 5 polyps, and 32 non-tumor. Deidentified tissue
samples were provided by the Cooperative Human Tissue
Network (CHTN Western Division, Vanderbilt University,
Nashville, TN) which is funded by the National Cancer
Institute. Other investigators may have received specimens from the same subjects. Samples were kept frozen
at −70 °C until needed. These studies were reviewed by
and designated as exempt by the University of Arizona
Human Subjects Protection Program.
RNA extraction and purification
Total RNA was extracted from tissue samples using the
RNeasy® Mini Kit (Qiagen, Hilden, Germany) according
to the manufacturer’s guidelines. To preserve RNA integrity, all tissue samples were maintained over dry ice prior
to sample disruption using a VDI 12 Tissue Homogenizer
(VWR, Radnor, PA). RNA concentration and quality were
determined using a NanoDrop® ND-1000 Spectrophotometer (Thermo Fisher Scientific, Waltham, MA).
Real-time reverse transcription analysis
cDNA was synthesized from 1 μg total RNA using
iScript™ cDNA Synthesis Kit (Bio-Rad, Hercules, CA),
diluted into 15 μL with nuclease-free water. PCR products
were detected with ROX using iTaq™ Supermix (Bio-Rad)
and TaqMan® Gene Expression Assays (Applied Biosystems, Foster City, CA) for 14-3-3 gamma (YWHAG,
Hs01113553_mH), beta (YWHAB, Hs00268732_m1),
epsilon (YWHAE, Hs00356749_g1), zeta (WYHAZ,
Hs01122445_g1), theta (YWHAQ, Hs00863277_g1),
eta (YWHAH, Hs00607046_m1), and sigma (SFN,
Hs00968567_s1). Cycle threshold (Ct) values for all
seven 14-3-3 genes were normalized to GAPDH
(Hs02758991_g1, Applied Biosystems).
Young et al. BMC Cancer (2015) 15:826
DNA extraction and purification
Genomic DNA was extracted from fresh-frozen tissue
samples using the QIAamp® DNA Mini Kit (Qiagen), according to manufacturer’s guidelines. Samples were
digested with 25 units each of bovine pancreas ribonuclease A (Sigma, St. Louis, MO) for five minutes to
remove residual RNA. DNA concentration and quality
were determined using a NanoDrop® ND-1000 spectrophotometer (Thermo Fisher Scientific).
Page 3 of 10
Sequencing and analysis of bisulfite-treated 14-3-3
promoter DNA
Sequencing of 14-3-3 promoter constructs was conducted by The University of Arizona Genetics Core Facility using an Applied Biosystems 3730 DNA Analyzer.
Cloned sequences for each 14-3-3 isoform were aligned
against established gene sequences using a ClustalW alignment algorithm and BioEdit© Software (Ibis Biosciences,
Carlsbad, CA).
Bisulfite treatment of methylated human DNA
Plasmids
Four matched pairs of tumor and non-tumor genomic
DNA (eight samples total) were subjected to bisulfite
treatment using EpiTect® Bisulfite Kit (Qiagen), according to the manufacturer’s guidelines. Following column
purification, samples were eluted into 10 μL buffer TE
(10 mM Tris, pH 8.0; 1 mM EDTA).
The T24-C3 vector (activated H-ras inserted into pBR322
plasmid) was obtained from Dr. Radhakrishnan, University
of Arizona, AZ, USA. FNpCDNA3 vector was obtained
via Addgene (plasmid 45346). The Flag-14-3-3 eta plasmid
was created by PCR amplification of 14-3-3 eta cDNA
(16) followed by sub-cloning into the FNpCDNA3 vector
using BamHI/EcoRI restriction enzymes (NEB, MA).
Amplification of 14-3-3 promoter regions from
bisulfite-treated DNA
Promoter regions were amplified using primers designed
against 14-3-3 sigma (5’- GGTATTGTGAAAGTGG
ATTTGA -3’ and 5’- ACTATCCAACAAACCCAAC
AC -3’), 14-3-3 eta (5’- AGTAGGTGAYGTTATT
TTGAAA -3’ and 5’- ACCCAACCTCAAAAAATAAC -3’),
and 14-3-3 zeta (5’- GGAAATTTTTTTTTTGGTTTGT -3’
and 5’- AATTTTCCTACCCAAATAAAACTTT -3’).
When used to amplify bisulfite-treated, genomic DNA,
these primer pairs generate products of 702, 651, and
655 base pairs long, respectively. PCR was conducted
using Platinum® Taq DNA Polymerase (Invitrogen,
Grand Island, NY) according to the manufacturer’s
guidelines. Reactions were run for 35 cycles using an
annealing temperature of 55 °C and 1 μL of template
bisulfite-treated DNA. Resultant PCR products were
analyzed on a 1 % TAE agarose gel to verify sample
quality. DNA bands of the desired mass were excised and
subsequently purified using QIAquick® Gel Extraction Kit
(Qiagen), according to manufacturer guidelines. Samples
were eluted into 30 μL buffer TE for immediate use.
Single-copy isolation of 14-3-3 promoter regions
by subcloning
Purified fragments of 14-3-3 promoter regions were ligated into bacterial cloning vectors using pGEM®-T Easy
Vector System I (Promega, Madison, WI) according to
the manufacturer’s guidelines. Ligated constructs were
immediately used to transform DH5α competent cells
and grown on IPTG/β-Gal/Ampicillin positive agar plates
for 24 h. Twelve white colonies were randomly selected
from each plate and grown in 2 mL liquid cultures overnight. Plasmid DNA was then extracted and purified using
AxyPrep Easy-96 Plasmid DNA Kit (Axygen, Union City,
CA) according to the manufacturer’s guidelines.
Cell culture and transfection conditions
NIH3T3 cell line was obtained from ATCC (American
Type Culture Collection). Cells were grown in Dulbecco’s
modified minimal essential medium (Cellgro, VA) supplemented with 100 U of penicillin, 100 mg of streptomycin,
and 5 % fetal bovine serum (Sigma) and maintained in a
humidified atmosphere of 5 % CO2.
Transformation assay
Early passages of NIH3T3 cells were plated in 30 mm,
6-well plates at a density of 300,000 cells/well. 1 μg of
each plasmid mixed in FuGene 6 transfection reagent
(Promega) was slowly added to culture plates under
gentle agitation. After 24 h, the transfected cells were
trypsinized and counted. About 5,000 cells were plated
into 100 mm dishes, each. Cells were grown in DMEM
with 5 % fetal calf serum, changed every 84 h. After
21 days, cells were stained with 0.05 % crystal violet solution (Thermo Scientific #88101) and foci were counted
using a ColCount colony counter (Oxford Optronix, UK).
Western blotting
To verify exogenous protein expression, cell lysates were
collected 96 h after transformation. Total protein was
extracted and analyzed by SDS-PAGE. Two rabbitprimary antibodies were used to probe for total Ras (Cell
Signaling antibody #3339) and Flag peptide (Cell Signaling
antibody #2368), incubated overnight in 5 % BSA at a dilution of 1:800. Uniform protein loading was verified using
mouse anti-β-actin primary antibody (Sigma #A3853), also
incubated overnight in 5 % BSA at a dilution of 1:800.
Anti-rabbit HRP-conjugated secondary antibody (Jackson
ImmunoResearch antibody #111-035-003) and anti-mouse
HRP-conjugated secondary antibody were both used at a
Young et al. BMC Cancer (2015) 15:826
Page 4 of 10
1:10,000 dilution in 5 % blotting-grade blocker (Bio-Rad
#170-6404).
Statistical analysis
Statistics were calculated using R© version 2.13.2 software (R Foundation for Statistical Computing, Vienna,
Austria). A two-tailed Student’s t-test and Mann–Whitney
U-test were used to compare differences in 14-3-3 mRNA
expression between tumor and non-tumor sample groups.
P-values less than 0.01 were considered significant.
Results & discussion
Previous studies have examined changes in the expression of several 14-3-3 isoforms in lung, head and neck,
breast, and gastric cancers [10, 13, 22, 27]. Analysis of
all seven 14-3-3 family members by immunohistochemistry showed an increase in epsilon, zeta, and theta isoforms in human meningiomas [15] however, there have
been no equivalent studies in colon tumors.
In order to characterize 14-3-3 expression in human
colorectal adenocarcinomas we began with a cohort of
samples that consisted of 71 cancerous and 52 noncancerous colonic tissues. The relative levels of mRNA
expression of each of the 14-3-3 isoforms were determined using primers specific to each isoform in quantitative real-time PCR reactions. The cycle-threshold
values (ΔCt) were normalized to a GAPDH control. In
order to test the quality of our qRT-PCR reactions we
also randomly selected the RNA from 24 patients (19
tumor, 5 non-tumor) and performed independent duplicate reactions to test for reproducibility and found that
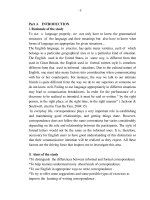
there was less than 1 % variation on average. The expression results were pooled and are graphed in Fig. 1.
Statistical analysis revealed that three 14-3-3 isoforms,
zeta, eta, and sigma, showed a statistically significant decrease (p < 0.001) in mRNA expression in tumor tissue
when compared to non-tumor samples whereas little or
no change was seen in the other isoforms. In both tumor
and non-tumor samples, 14-3-3 isoforms zeta and epsilon exhibited the highest overall expression, consistent
with previous 14-3-3 expression data collected in lung
tissues [22]. We further analyzed our expression results
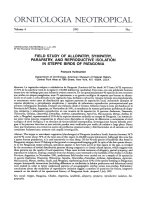
by calculating the fold differences in mRNA expression
in tumor verses non-tumor groups using the mean ΔCt
values. The results, graphed in Fig. 2a, reveal that cancerous tissues showed a nearly 1.4 fold drop in expression of 14-3-3 sigma. This is consistent with what has
been reported for breast cancers and suggests that depression of 14-3-3 sigma expression may also be important in the development of colorectal tumors. Similarly,
the depression of 14-3-3 eta expression suggests that
suppressed expression of this isoform is also associated
with colorectal tumorigenesis.
Fig. 1 Expression levels of 14-3-3 genes in tumor and non-tumor
colon tissues as determined by RT-PCR. Purified whole-RNA extracts
taken from frozen tissues were reverse-transcribed and quantified using
real-time PCR. Each of the seven human 14-3-3 isoforms are normalized
to the housekeeping gene GAPDH (ΔCt). Box plot compares expression
of all seven 14-3-3 isoforms in tumor (T, n = 71) and non-tumor
(N, n = 52) sample groups. Y-axis is plotted as inverse ΔCt. The
dark, horizontal bar indicates sample mean and box outlines mark first
and third quartiles. Whiskers extend to sample minimum and maximum.
Brackets indicate statistically significant differences (determined by
Student’s t-test, P < 0.001)
For comparison and further evaluation we also analysed a subset of eleven tumors along with their matched
normal tissues. Fold differences in expression were calculated for each matched pair individually and averaged
(Fig. 2b). We found that 14-3-3 eta and sigma showed a
1.3 and a 4.4 fold decrease in the expression of these
genes in tumor compared with their matched normal.
Indeed, the magnitude of the fold change in expression
of all of the isoforms was increased when tumor samples
were compared with matched normals suggesting that
using matched normals increases the sensitivity of detection of changes in gene expression. We saw no correlation between expression changes and the patient’s age,
sex, or race.
To expand our 14-3-3 mRNA dataset, we analyzed
colorectal-adenocarcinoma microarray expression data
(normalized, Level 3 data) provided by The Cancer
Genome Altas ( The dataset was comprised of 155 patients (50 % male, average
age at diagnosis: 71, Stage I & II: 48 %, Stage III & IV:
52 %) yielding 155 tumors and 19 non-tumor tissues.
Fold changes in mRNA expression of all seven 14-3-3
isoforms were calculated, as before, for all tumors
(Fig. 2c) and for matched pairs only (Fig. 2d). TCGA
data shows a decrease in 14-3-3 eta and sigma isoforms,
supporting our qRT-PCR findings. 14-3-3 depletion becomes more apparent when considering tumor/normal
matched pairs again suggesting that using matched pairs
Young et al. BMC Cancer (2015) 15:826
Page 5 of 10
Fig. 2 Ratio of 14-3-3 gene expression between tumor and non-tumor sample groups. a 14-3-3 expression level comparison of total tumor population
with total non-tumor population. Values represent fold difference in the average level of 14-3-3 expression of all 71 tumor samples compared to the
average expression level of all 52 non-tumor samples. Fold change = 2|ΔΔCt|-1, where ΔΔCt was calculated from the mean of tumor and non-tumor
group ΔCt values for each isoform. b 14-3-3 expression level comparison of tumor and non-tumor matched pairs. ΔCt values of tumor and non-tumor
samples taken from the same patient were compared to each other (ΔΔCt) for eleven matched pairs. Values indicated the average fold difference
(2|ΔΔCt|-1) in expression of each 14-3-3 isoform. c 14-3-3 expression level comparison of total tumor population with total non-tumor population of
TCGA COAD Dataset. d 14-3-3 expression level comparison of tumor and non-tumor matched pairs of TCGA COAD Dataset
can enhance the magnitude of the observed changes
(Fig. 2b & d).
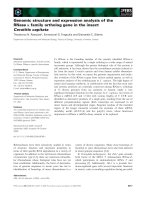
We further analyzed the TCGA microarray data set by
examining 14-3-3 gene expression levels and tumor
stage. For this analysis we grouped tumor stages I and II
together into the early stage group and grouped tumor
stages III and IV together into the late stage group. Next
we plotted the level of expression for each of the 14-3-3
isoforms for early and late stage tumor groups and compared these to the levels of expression in normal samples. The results are depicted in Fig. 3. As might be
expected from previous reports, 14-3-3 sigma showed a
statically significant drop in average expression in both
early and late stage tumors. Interestingly the magnitude
of the level of the decrease in sigma expression became
more pronounced in late stage tumors compared to
early stage tumors suggesting that repression of this
gene increases during tumor development. 14-3-3 eta
expression also decreased but did not reach significance
and appeared bimodal. That is the drop in expression
was more pronounced in some tumors over others. In
contrast 14-3-3 epsilon and gamma expression showed a
significant increase in both early and late stage tumors.
Notably, the average expression level of 14-3-3 beta was
reduced in early stage tumors relative to normal cells,
but was elevated in late stage tumors. Moreover, change
in direction of the expression of this gene (eg. decreased
in early stage tumors but increased in late stage tumors)
explains why no statistically significant change in expression was observed when the expression results from all
tumors was pooled together as was done in Fig. 1.
Having observed decreases in mRNA levels of several
isoforms among colorectal tumors, we sought to explore
the mechanisms responsible for driving 14-3-3 depletion.
Previous studies have indicated that silencing of gene
transcription through promoter hypermethylation is a
Young et al. BMC Cancer (2015) 15:826
Page 6 of 10
Fig. 3 14-3-3 Gene mRNA Expression Data from TCGA. Histograms generated using data from 155 tumors and 19 non-tumor tissues taken from
The Cancer Genome Atlas COAD dataset are shown for all seven 14-3-3 genes. Density curves are overlaid highlight distribution. Sample groups
are split up into early stage tumors (stage I & II, purple), late stage tumors (stage III & IV, pink), and non-tumor tissues (green). Statistically significant
differences in mRNA expression between the populations are shown with brackets
primary mechanism of dysregulation for 14-3-3 sigma in
many cancers. Aberrant methylation of the YWHAS
gene’s 5’-regulatory region has been reported in cancers
of prostate, bladder, and liver tissues [7, 19, 21]. Epigenetic alteration of sigma has shown clinical significance,
and hypermethylation correlates strongly with the development of melanomas and squamous cell carcinomas of
the vulva [26, 28]. Hypermethylation and down-regulation
of 14-3-3 sigma has been consistently observed in a large
portion of breast cancers for over a decade and remains a
promising biomarker for the disease today [3, 6]. The nature of epigenetic alteration of 14-3-3 and its relationship
to cancer, however, appears to be tissue specific. Hypomethylation of 14-3-3 sigma and subsequent up-regulation of
the gene has been observed in non-small cell lung carcinomas [25]. The large body of evidence supporting an epigenetic mechanism for regulation of 14-3-3 prompted us
to examine the methylation status of the promoter regions
of zeta, eta, and sigma.
Although the promoter region and the CpG islands that
are methylated in the sigma gene are well documented
[16], the promoters and potential methylation sites for
zeta and eta are not known. Hence, we began with a computational analysis of all seven of the 14-3-3 promoter sequences using EMBOSS Cpgplot ( />The predicted methylation sites for all seven of the 14-3-3
genes are shown in supplemental Additional file 1: Figure
S1. The predicted CpG islands for eta, zeta, and sigma are
displayed in Fig. 3 as dashed lines and represent likely regions of methylation based on GC density. Potential CpG
islands predicted to occur in the promoter regions of each
of the three 14-3-3 isoforms were used to guide our
bisulfite-coupled genomic sequencing efforts. Importantly,
the individual CpG methylation sites predicted by
EMBOSS and subsequently observed in the bisulfite
sequencing of the 14-3-3 sigma gene match previously
reported methylation positions [16].
To conduct the analysis genomic DNA was extracted
from patient-matched pairs of tumor and non-tumor tissues and subjected to bisulfite treatment to differentiate
methyl-cytosines from unmethylated cytosines [11]. PCR
amplification of a roughly 650 bp region centered near the
Young et al. BMC Cancer (2015) 15:826
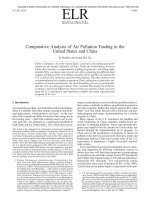
start of transcription (depicted in Fig. 4) was conducted
for 14-3-3 zeta, eta, and sigma genes. Bacterial subcloning
was then used to isolate single copies of the promoter regions for subsequent sequencing and analysis. Figure 4
shows the location of each methylated CpG site that was
observed along all three targeted genes. Vertical bars represent average changes in the proportion of methylpositive clones for matched tumor/non-tumor clones.
Positive values indicate an increase in percent methylation of adenocarcinomas compared to their nontumor controls.
Of the three 14-3-3 genes examined two, sigma and
eta, showed significant hypermethylation. The sigma
Page 7 of 10
promoter exhibited an overall hypermethylated state
(14.0 % methylation of CpG sites in non-tumor tissues
versus 34.9 % methylation in tumors), consistent with
the epigenetic changes of 14-3-3 established in other
cancers [3, 6, 16]. The eta promoter displayed a large
number of methylation sites within a roughly 250 basepair region centered on the gene’s start of transcription.
The proportion of methyl-positive CpG sites within
100 bp of the gene’s transcriptional start site was higher
in tumor tissues (29.8 %) compared to non-tumor tissues
(18.2 %). Such a large shift in promoter methylation suggests that the eta isoform may be dysregulated in a manner similar to 14-3-3 sigma. The zeta isoform did not
Fig. 4 Changes in methylation status of 14-3-3 sigma, eta, and zeta promoter regions. Relative changes in methylation status for each identified
CpG site are plotted for all three genes. Upward-facing bars indicate tumor hypermethylation at a particular CpG site, while downward-facing bars
indicate hypomethylation. The relative positions of transcriptional start sites and first exons are shown below methylation maps for each isoform.
Scales in units of base pairs up or down-stream are shown for reference. Short, horizontal arrows indicate the recognition sites of the forward
and reverse primers used to amplify each region. Lightly shaded bars indicate the first exon of each 14-3-3 gene. Start codons for 14-3-3 sigma
and eta genes are also shown for reference (coding regions are shown with dark shading). Boxes outlined by dashed lines indicate likely CpG
islands (as determined computationally by EMBOSS Cpgplot)
Young et al. BMC Cancer (2015) 15:826
exhibit strong methylation in either tumor or nontumor groups, suggesting its observed down-regulation
in colon cancers is the result of some unidentified mechanism. To our knowledge, this is the first study that
identifies individual CpG methylation sites in the 14-3-3
zeta and eta genes.
14-3-3 sigma’s established role in colorectal cancers as
a tumor suppressor and the similarities in dysregulation
of expression of 14-3-3 eta prompted us to test whether
eta could also act as a tumor suppressor. A mammalianexpression vector containing full-length 14-3-3 eta was
constructed and used to transform human NIH3T3 cell
lines. A 900 bp segment of cDNA comprising the entire
coding region of 14-3-3 eta was generated (see Methods)
and ligated into an FNpCDNA3 vector containing an Nterminal FLAG tag. The multiple cloning site was sequenced to confirm the construct’s integrity and reading
frame continuity. The expression plasmid was used in
focus formation assays to test whether eta could suppress Ras-induced transformation of NIH3T3 cells. The
resultant foci were counted according to the Methods section, results are shown in Fig. 5. H-ras transformants exhibited a statistically-significant increase (p < 0.05) in foci
Page 8 of 10
count, as compared to non-treated NIH3T3 controls
(Fig. 5a & c). This transforming potential of H-ras was significantly suppressed by cotransfection with 14-3-3 eta, a
result that is similar to what we observed previously when
we cotransfected with 14-3-3 sigma [24]. Cells derived
from expanding foci from each transformation assay were
grown and collected on day 4 and lysates parepared and
analyzed by western blot (see Methods) to confirm exogenous expression of FLAG-14-3-3 eta and H-ras
(Fig. 5d). Overexpression of 14-3-3 eta did not increase
foci count over the control group, further supporting
14-3-3 eta’s potential role as a tumor suppressor. To
verify that the FNpCDNA3 vector alone was not responsible for the tumor suppressor effects seen in the
14-3-3 eta plus H-ras groups, another focus formation
assay was run comparing H-ras transformants and Hras plus empty FNpCDNA3 vector cotransformants
(shown in panels b, c, and e of Fig. 5). Ras and Ras
plus vector groups showed an equivalent amount of
Ras expression by western blot and significantly
higher expression than endogenous levels of Ras seen
in the vector alone group. Ras and Ras plus empty
FNpCDNA3 did not show a statistically significant
Fig. 5 Overexpression of 14-3-3 eta inhibits Ras-induced focus formation in NIH3T3 cells. a H-ras and Flag-14-3-3 eta expression plasmids were
transfected into NIH3T3 cells as described in the Methods section, replated 24 h after transfection and maintained for an additional
21 days. Subsequently, the cells were stained with crystal violet and the number of foci quantified using an Oxford Optronix colony counter, UK. The
experiment was conducted in octuplicate. Representative plates from each of the four experimental groups are depicted. b In a parallel control
experiment NIH3T3 cells were transfected with H-ras and H-ras plus empty vector and treated as in a. The experiment was conducted in
octuplicate. c The number of foci in panels a and b were quantified and plotted. Horizontal bars depict the average number of foci per dish. (*: p < 0.05,
Student’s t-Test). d A western blot was used to verify the expression of H-ras and N-terminally-tagged Flag-14-3-3 eta proteins in NIH3T3 transformants. e A
western blot was used to verify expression of H-ras in both Ras and Ras plus Vector group transformants shown in panel b
Young et al. BMC Cancer (2015) 15:826
difference in the number of foci per dish at the end
of 21 days.
Conclusions
Dysregulation of specific 14-3-3 isoforms has been detected in a number of tumor types suggesting that these
proteins play a role in maintenance of the normal cell
phenotype but can promote tumorigenesis if expression
of these genes is altered. Here we examined the expression levels of all seven of the 14-3-3 family members in
colorectal adenocarcinomas and found that, in general,
the expression of most of the 14-3-3 genes was down
regulated in the tumors analyzed by quantitative rtPCR.
Of these we found that a statistically significant decrease
in 14-3-3 zeta, eta, and sigma expression occurred in
tumor samples using rtPCR as compared to non-tumor
controls. Comparison of the fold change values obtained
for our tumor cohort and the fold change values for the
TCGA data set confirm that the expression of sigma and
eta are indeed suppressed in colon tumors. However, we
found that normalizing using matched controls increased
the sensitivity for detecting changes in gene expression.
This suggests that the expression level of 14-3-3 genes
varies between individuals.
Importantly, analysis of the expression values for colon
tumors in the TCGA data set revealed that the change
in expression of 14-3-3 genes is complex that we first realized. When compared with tumor stage several 14-3-3
genes exhibited a diverse change in expression. For example, 14-3-3 sigma expression levels, a putative tumor
suppressor, decreased in late stage tumors relative to
early stage tumors. In contrast the expression of 14-3-3
gamma, an oncogenic 14-3-3 family member, increases
in more advanced tumors. However, the most dynamic
change in expression was shown by 14-3-3 beta. Here
we found that expression of the beta gene was depressed
in early stage tumors but increased in late stage tumors.
The significance of this change in direction of expression
is unclear. However, one possible explanation is that the
contribution of this gene to colon tumorigenesis changes
with tumor stage. Overall the level and direction of the
change in 14-3-3 expression appears to correlate with
the degree of advancement of the tumor and appears to
be associated with the biological function of the protein.
The expression of some 14-3-3 genes in tumors is
thought to be regulated epigenetically. Consequently,
prompted by the well documented hypermethylation of
the sigma promoter we examined the promoter methylation status of eta and zeta using bisulfite-coupled
genomic sequencing and found that the eta promoter
was also extensively hypermethylated in colorectal tumors. Indeed the extent of methylation at the eta promoter was considerably more extensive than what we
observed for 14-3-3 sigma. Hence, as with 14-3-3 sigma,
Page 9 of 10
the expression of 14-3-3 eta is also negatively regulated
epigenetically in human tumors suggesting that it may
be a tumor suppressor. Consistent with this, 14-3-3 eta
could also suppress focus formation induced by an activated Ras oncogene confirming that eta can act as a
tumor suppressor.
Overall, our studies show that 14-3-3 gene expression
is altered in colon tumors, but that the direction of the
change in expression levels varies with each gene and
may be a reflection of the role that individual proteins
play in the tumorigenic process. Further analysis of how
14-3-3 expression is regulated and how these proteins
can influence tumor development is warranted.
Additional file
Additional file 1: Figure S1. Computer Predicted CpG Islands Near
14-3-3 Promoter Regions. Genomic sequences of all seven 14-3-3
isoforms were analyzed using EMBL’s Cpgplot service. Regions of at
least 200 bp in length with a CG density greater than 60 % (using a
100 bp window) are highlighted as red boxes. Height of red boxes indicates
the relative density of CG nucleotides within each identified island. Exons
for all seven genes are represented by green arrows. (TIFF 357 kb)
Abbreviations
ATCC: American Type Culture Collection; BSA: bovine serum albumin;
CHTN: Cooperative Human Tissue Network; EMBOSS: European Molecular
Biology Open Software Suite; GAPDH: glyceraldehyde 3-phosphate dehydrogenase; HRP: horseradish peroxidase; PCR: polymerase chain reaction; qRTPCR: quantitative real-time polymerase chain reaction; SDSPAGE: sodium dodecyl sulfate polyacrylamide gel electrophoresis;
TCGA: the Cancer Genome Altas.
Competing interests
The authors declare that they have no conflicts of interest that might
influence our interpretation of the presented data.
Authors’ contributions
Gavin Young performed most of the experiments in this study. He isolated
RNA from the tumor specimens, conducted the PCR and performed the data
analysis TCGA dataset. He also analyzed the 14-3-3 gene promoters to identify
likely methylation sites in preparation for the methylation analysis described in
the results. Mr. Young wrote most of the manuscript. Dr. Maratiradhakrishnan
worked with Mr. Young to perform the bisulfite sequencing. He helped to
optimize the cloning and PCR needed to conduct the studies. Dr. Centuori and
Mr. Gomes helped Mr. Young conduct the focus formation assays. They helped
to optimize the transfection procedure and analyze the results. Dr. Martinez
conceptualized the experiments and provided guidance in interpreting the
data. He also wrote portions of and edited the manuscript. All authors have
reviewed this manuscript and approve of its contents.
Acknowledgements
This work was funded, in whole or in part, by National Institutes of Health
Grants CA107510 and CA023074 (to J.D.M.) and Cooperative Human Tissue
Network grant number 5U01CA091664.
Author details
Undergraduate Biomedical Research Program, University of Arizona Cancer
Center, 1515 N. Campbell Ave, Tucson 85724, Arizona, USA. 2Department of
Pediatrics, Steele Children’s Research Center, University of Arizona Cancer
Center, 1515 N. Campbell Ave, Tucson 85724, Arizona, USA. 3Department of
Cell & Molecular Medicine, University of Arizona Cancer Center, 1515 N.
Campbell Ave, Tucson 85724, Arizona, USA. 4Cancer Biology Graduate
Interdisciplinary Program, University of Arizona Cancer Center, 1515 N.
1
Young et al. BMC Cancer (2015) 15:826
Campbell Ave, Tucson 85724, Arizona, USA. 5University of Arizona Cancer
Center, 1515 N. Campbell Ave, Tucson 85724, Arizona, USA.
Received: 21 January 2015 Accepted: 27 October 2015
References
1. Aitken A. 14-3-3 proteins: a historic overview. Semin Cancer Biol.
2006;16:162–72.
2. Chen J, Lee CT, Errico SL, Becker KG, Freed WJ. Increases in expression of
14-3-3 eta and 14-3-3 zeta transcripts during neuroprotection induced by
delta9-tetrahydrocannabinol in AF5 cells. J Neurosci Res. 2007;85:1724–33.
3. Ferguson AT, Evron E, Umbricht CB, Pandita TK, Chan TA, Hermeking H, et al.
High frequency of hypermethylation at the 14-3-3 sigma locus leads to gene
silencing in breast cancer. Proc Natl Acad Sci U S A. 2000;97:6049–54.
4. Fu H, Subramanian RR, Masters SC. 14-3-3 proteins: structure, function, and
regulation. Annu Rev Pharmacol Toxicol. 2000;40:617–47.
5. Gardino AK, Smerdon SJ, Yaffe MB. Structural determinants of 14-3-3 binding
specificities and regulation of subcellular localization of 14-3-3-ligand
complexes: a comparison of the X-ray crystal structures of all human 14-3-3
isoforms. Semin Cancer Biol. 2006;16:173–82.
6. Gheibi A, Kazemi M, Baradaran A, Akbari M, Salehi M. Study of promoter
methylation pattern of 14-3-3 sigma gene in normal and cancerous tissue
of breast: A potential biomarker for detection of breast cancer in patients.
Adv Biomed Res. 2012;1:80.
7. Herath NI, Leggett BA, MacDonald GA. Review of genetic and epigenetic
alterations in hepatocarcinogenesis. J Gastroenterol Hepatol. 2006;21:15–21.
8. Hermeking H, Lengauer C, Polyak K, He TC, Zhang L, Thiagalingam S, et al.
14-3-3 sigma is a p53-regulated inhibitor of G2/M progression. Mol Cell.
1997;1:3–11.
9. Kilani RT, Medina A, Aitken A, Jalili RB, Carr M, Ghahary A. Identification of
different isoforms of 14-3-3 protein family in human dermal and epidermal
layers. Mol Cell Biochem. 2008;314:161–9.
10. Leal MF, Calcagno DQ, Demachki S, Assumpção PP, Chammas R, Burbano RR,
et al. Clinical implication of 14-3-3 epsilon expression in gastric cancer. World J
Gastroenterol. 2012;18:1531–7.
11. Li Y, Tollefsbol TO. DNA methylation detection: bisulfite genomic
sequencing analysis. Methods Mol Biol. 2011;791:11–21.
12. Li Z, Liu JY, Zhang JT. 14-3-3sigma, the double-edged sword of human
cancers. Am J Transl Res. 2009;1:326–40.
13. Lin M, Morrison CD, Jones S, Mohamed N, Bacher J, Plass C. Copy number
gain and oncogenic activity of YWHAZ/14-3-3zeta in head and neck
squamous cell carcinoma. Int J Cancer. 2009;125:603–11.
14. Liu Y, Ross JF, Bodine PV, Billiard J. Homodimerization of Ror2 tyrosine
kinase receptor induces 14-3-3(beta) phosphorylation and promotes
osteoblast differentiation and bone formation. Mol Endocrinol.
2007;21:3050–61.
15. Liu Y, Tian RF, Li YM, Liu WP, Cao L, Yang XL, et al. The expression of seven
14-3-3 isoforms in human meningioma. Brain Res. 2010;1336:98–102.
16. Lodygin D, Hermeking H. Epigenetic silencing of 14-3-3sigma in cancer.
Semin Cancer Biol. 2006;16:214–24.
17. McConnell JE, Armstrong JF, Hodges PE, Bard JB. The mouse 14-3-3 epsilon
isoform, a kinase regulator whose expression pattern is modulated in
mesenchyme and neuronal differentiation. Dev Biol. 1995;169:218–28.
18. Nakanishi K, Hashizume S, Kato M, Honjoh T, Setoguchi Y, Yasumoto K.
Elevated expression levels of the 14-3-3 family of proteins in lung cancer
tissues. Hum Antibodies. 1997;8:189–94.
19. Negraes PD, Favaro FP, Camargo JL, Oliveira ML, Goldberg J, Rainho CA, et al.
DNA methylation patterns in bladder cancer and washing cell sediments: a
perspective for tumor recurrence detection. BMC Cancer. 2008;8:238.
20. Perathoner A, Pirkebner D, Brandacher G, Spizzo G, Stadlmann S, Obrist P, et al.
14-3-3sigma expression is an independent prognostic parameter for poor
survival in colorectal carcinoma patients. Clin Cancer Res. 2005;11:3274–9.
21. Pulukuri SM, Rao JS. CpG island promoter methylation and silencing of
14-3-3sigma gene expression in LNCaP and Tramp-C1 prostate cancer
cell lines is associated with methyl-CpG-binding protein MBD2.
Oncogene. 2006;25:4559–72.
22. Qi W, Liu X, Qiao D, Martinez JD. Isoform-specific expression of 14-3-3
proteins in human lung cancer tissues. Int J Cancer. 2005;113:359–63.
Page 10 of 10
23. Qi W, Liu X, Chen W, Li Q, Martinez JD. Overexpression of 14-3-3gamma
causes polyploidization in H322 lung cancer cells. Mol Carcinog.
2007;46:847–56.
24. Radhakrishnan VM, Martinez JD. 14-3-3gamma induces oncogenic
transformation by stimulating MAP kinase and PI3K signaling. PLoS ONE.
2010;5:e11433.
25. Radhakrishnan VM, Jensen TJ, Cui H, Futscher BW, Martinez JD.
Hypomethylation of the 14-3-3sigma promoter leads to increased
expression in non-small cell lung cancer. Genes Chromosomes Cancer.
2011;50:830–6.
26. Schultz J, Ibrahim SM, Vera J, Kunz M. 14-3-3sigma gene silencing during
melanoma progression and its role in cell cycle control and cellular
senescence. Mol Cancer. 2009;8:53.
27. Song Y, Yang Z, Ke Z, Yao Y, Hu X, Sun Y, et al. Expression of 14-3-3gamma
in patients with breast cancer: correlation with clinicopathological features
and prognosis. Cancer Epidemiol. 2012;36:533–6.
28. Wang Z, Trope CG, Suo Z, Troen G, Yang G, Nesland JM, et al. The
clinicopathological and prognostic impact of 14-3-3 sigma expression on
vulvar squamous cell carcinomas. BMC Cancer. 2008;8:308.
29. Wilker E, Yaffe MB. 14-3-3 Proteins–a focus on cancer and human disease.
J Mol Cell Cardiol. 2004;37:633–42.
30. Yang X, Cao W, Lin H, Zhang W, Lin W, Cao L, et al. Isoform-specific
expression of 14-3-3 proteins in human astrocytoma. J Neurol Sci.
2009;276:54–9.
31. Zhao J, Meyerkord CL, Du Y, Khuri FR, Fu H. 14-3-3 proteins as potential
therapeutic targets. Semin Cell Dev Biol. 2011;22:705–12.
Submit your next manuscript to BioMed Central
and take full advantage of:
• Convenient online submission
• Thorough peer review
• No space constraints or color figure charges
• Immediate publication on acceptance
• Inclusion in PubMed, CAS, Scopus and Google Scholar
• Research which is freely available for redistribution
Submit your manuscript at
www.biomedcentral.com/submit