Study of the impact of the use of a mixed inoculum on the methane yield in anaerobic digestion process
Bạn đang xem bản rút gọn của tài liệu. Xem và tải ngay bản đầy đủ của tài liệu tại đây (743.61 KB, 4 trang )
SCIENCE - TECHNOLOGY
P-ISSN 1859-3585 E-ISSN 2615-9619
STUDY OF THE IMPACT OF THE USE OF A MIXED INOCULUM
ON THE METHANE YIELD IN ANAEROBIC DIGESTION PROCESS
NGHIÊN CỨU VỀ ẢNH HƯỞNG CỦA HỖN HỢP TÁC NHÂN HỖ TRỢ ĐỐI VỚI NĂNG SUẤT SINH KHÍ MÊ TAN
CỦA QUÁ TRÌNH PHÂN HỦY SINH HỌC YẾM KHÍ
Dinh Quang Hung1,*, Do Trong Mui1,
Damien Lagar2, Mai Thị Linh1, Hoang Thi Linh1
ABSTRACT
Batch experiments were conducted to study the impact of the use of a mixed
inoculum on the methane yield for wet, mesophilic, discontinuous anaerobic
digestion of food waste. Three different inocula were used: cow rumen, AD (anerobic
digestion) sludge and UASB (Upflow anaerobic sludge blanket) sludge. The results
indicated that the use of a mixed inoculum does not lead to any improvements in the
methane yield. On the contrary, the yield decreases and the kinetic of the reaction
slows down. The best-performing inoculum is AD sludge, while cow rumen and
UASB sludge appear to be inadequate choices of inoculum for food waste AD.
Keywords: Food waste, anaerobic digestion, biogas, energy, fertilizer.
TÓM TẮT
Nghiên cứu này tập trung vào đánh giá ảnh hưởng của các tác nhân khác
nhau đến khả năng sinh khí mê-tan đối với quá trình phân hủy ướt theo mẻ đối
với chất thải thực phẩm trong điều kiện ưa ấm. Ba tác nhân được sử dụng là hỗn
dịch trong dạ dày bò, bùn từ bể AD (bể phân hủy yếm khí) và bùn từ bể UASSB
(bể kỵ khí). Kết quả nghiên cứu chỉ ra rằng việc sử dụng hỗn hợp của ba tác nhân
trên không cải thiện năng suất sinh khí mê-tan. Việc sử dụng tác nhân là bùn từ
hệ thống AD có hiệu quả tốt hơn hỗn dịch từ dạ dày bò Trong khí đó nào về năng
suất khí mêtan. Ngược lại, năng suất giảm và động học của phản ứng chậm lại.
Chất cấy có hiệu suất tốt nhất là bùn AD, trong khi dạ cỏ bò và bùn UASB dường
như không phù hợp với lựa chọn cấy cho chất thải thực phẩm AD.
Từ khóa: Chất thải thực phẩm, phân hủy yếm khí, khí sinh học, năng lượng,
phân bón.
waste recovery and an energy production without
plundering natural resources.
According to Gustavsson et al. (2011) working with the
food and agriculture organization, 1.3 billion tonnes of
food produced in the world for human consumption every
year gets lost or wasted, which represents roughly one
third of the production [1]. Knowing that the food waste
has a high biochemical methane potential (BMP), and the
huge quantity of food waste available, one can appreciate
the potential of AD.
The AD process needs an inoculum to provide the
methanogenic bacteria needed. The quality and the quantity
of the inoculum is a key-parameter of the process. The use of
a mixed inoculum might provide more diverse nutrients and
microorganism to achieve AD than a single inoculum.
The effectiveness of different types of food waste and
different types of inoculum and their proportion have
already been the subject of many publications. However,
there are still many scientific and technical locks, which
require more research. The objective of this study is to
measure the impact of the use of a mixed inoculum on the
methane yield. This study will focus on wet, mesophilic,
discontinuous anaerobic digestion of food waste.
2. MATERIALS AND METHODS
2.1. Experimental set-up
1
School of Environmental Science and Technology, Hanoi University of Science
and Technology
2
National Institute of Applied Sciences of Lyon
*
Email:
Ngày nhận bài: 25/5/2020
Ngày nhận bài sửa sau phản biện: 30/6/2020
Ngày chấp nhận đăng: 18/8/2020
1. INTRODUCTION
In our world, where the population and its needs in
terms of energy and waste management are constantly
increasing, anaerobic digestion (AD) can be part of a global
solution. AD is a biological process, which degrades
biodegradable waste in the absence of oxygen; it allows a
Website:
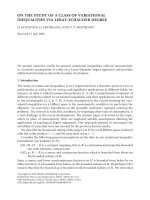
Figure 1. Set-up of a digester
The experimental set-up is made of a water bath
containing 30 digesters kept at a temperature of 37°C. Each
of them has a rubber stopper with 2 valves. The first valve
lets the gas produced in the digester to go in a gas bag; the
second one allows the specimen collection for
Vol. 56 - No. 4 (Aug 2020) ● Journal of SCIENCE & TECHNOLOGY 125
KHOA HỌC CÔNG NGHỆ
P-ISSN 1859-3585 E-ISSN 2615-9619
measurements. An illustration of the set-up is available
below in Figure 1.
2.2. Gas measurements
In the absence of volumetric measurement device, the
water displacement method has been used. The premise of
this system is that 1mL of water occupies as much volume
as 1mL of gas.
2.3. Parameters analysis
AD process is a complex operation with a large number
of factors either due to environmental conditions or
operational parameters; both affecting the methane
production. They have to be cautiously controlled at all
time. All the measured parameters and their determination
methods are detailed in the Table 1.
The food waste has been collected from the canteen of
one industrial company. It has been stored for 2 days at 5°C
to prevent biodegradation. The food waste was mainly
composed of rice, noodles, shrimp, beef, chicken, cabbage,
water spinach, chayote, chilli, lemon and water. Before use,
it has been crushed to get a size smaller than 1.5mm.
Table 1. Measured parameters and determination methods
Parameters
Determination method
Drying sample in a proofer at 105°C during 12h [2]
TS
Ashing sample in muffle furnace at 550°C during
VS
2h [2]
pH
pH-paper
Temperature
Thermometer
Alkalinity
Titration using Kapp method [3]
VFA
Titration using Kapp method [3]
Biogas production
Water displacement method
Methane production NaOH solution + water displacement method
Inocula have been collected from three different plants:
- Cow rumen from a local slaughterhouse.
- AD sludge from a homemade AD set-up. The
feedstock of the AD plant is pig manure and human feces.
- Upflow anaerobic sludge blanket (UASB) sludge from
a local wastewater treatment plant.
2.4. Substrate and inocula
Table 2. Characteristics of the food waste and of the inocula
Parameters
(n = 3)
TS (%)
VS (%)
VS/TS (%)
pH
Alkalinity (gCaCO3/L)
VFA (mgCH3COOH/L)
Food
Waste
19.79
18.33
92.06
4.47
1.024
3741.0
Cow
Rumen
19.28
16.40
85.04
7.49
11.65
6591.8
AD
sludge
1.15
0.84
72.61
7.56
4.26
1377.4
UASB
sludge
8.27
5.45
65.92
7.34
5.17
1490.9
The characteristics of the food waste and the inocula
shown in Table 2 have been compared with literature data.
The TS and VS values are really close to the literature data.
The volatile solids to total solids ratio (VS/TS) of the food
waste is 85.04% when it is usually above 80% [4]. The VS/TS
ratio for the cow rumen is at 85.04% when 84% can be
126 Tạp chí KHOA HỌC VÀ CÔNG NGHỆ ● Tập 56 - Số 4 (8/2020)
expected, 72% for AD sludge for 71% expected and 65.92%
for UASB for 63% expected [5]. One can say that the food
waste and the inocula completely have similar parameters
value than the literature data, which is an important
parameter for the reproducibility of the experiment.
3. RESULTS AND DISCUSSIONS
Figure 2 shows the methane production for all the
digesters. It can be noticed that digesters 10, 11, 12, 16, 17,
25, 26 and 27 have a negative production or really close to
zero. They did not achieve to produce more gas than the
endogenous production of their inoculum. Leakages checks
have been confirmed. They have therefore been set aside.
Figure 2. Methane production during the 19 first days
During the 19 first days, the methane production in
most of the digesters is really limited. According to Figure
2, only digesters 1, 2, 3, 13, 14 and 15 have produced a
consequent amount of biogas (only production over
100mL/gVS has been plotted) and they are among the few
digesters to be in the optimal pH range on day 19 (Figure
3). It should be noted that the methane production in
Figure 2 also contains the endogenous production.
As explained in the state of the art, a too low pH value
prevents the acetogenesis and the methanogenesis to
efficiently occur. And as we can see in the Figure 3, the
majority of the digesters, which experienced a serious pH
drop during the 19 first days, had a limited methane
production over this time.
The chosen control strategy was to maintain a low
concentration of VFA and a pH range of 6.5 < pH < 7.5.
Sodium bicarbonate has been added in the digesters with a
pH lower than 5.5 in order to level up the pH. Table 6 shows
that experiments 6, 7, 8 and 10 that benefits from the pH
correction have seen their methane production increase.
However, experiment 9, which also did benefit from the pH
correction looks unchanged. After the pH-correction, most of
the experiments have kept a pH close to the optimal range
until the end of the experiment (Figure 3). From the same
figure, it can be noted that the experiments: 4, 6, 9 and 10,
which have the lowest pH at the end of the 50 days also have
the highest VFA level at the end of the experiment (Figure 4).
All the digesters of experiment 2 experienced a pH drop
to 4.5 or less during the 19 first days. The digesters did not
recover from the pH-drop even after the pH-adjustment.
Small quantity of gas has been measured few days after the
pH-adjustment, but this is all. The pH-drop experienced by
Website:
SCIENCE - TECHNOLOGY
P-ISSN 1859-3585 E-ISSN 2615-9619
the digesters has been too severe to be fixed with a pH
adjustment.
Table 3 shows the percentage of the total methane
produced by the endogenous production. The results are
particularly high; they are in the range 17 - 40%, which are
generally the values for a low S/I ratio set-up. However, in
this study a rather high S/I ratio has been used. This might be
explained by the fact that the study has been stopped after
50 days of experiments, which might not have been long
enough for some digesters (Table 4). The digesters in grey in
Table 3 have produced until the last day of experiment.
experiments 4 to 6, which are using only one inoculum,
produce 84 - 93% of their methane in the same time.
Difficulties in VFA and alkalinity measurements have
been observed during the first three weeks of the
experiment due to a heterogeneous feedstock and the
detection of VFA accumulation has not been possible. The
VFA and alkalinity measurements have finally only been
conducted for the start and the end of the experiment.
The Figure 4 shows the change in VFA between the start
and the end of the experience compared with methane
production. Experiments 5, 7 and 8 have ended with small
VFA quantity and produced a significant amount of
methane, while experiments 4, 6, 9 and 10 have seen their
VFA been multiplied up to 7 times their initial value and they
hardly produced any methane. As explained in the state of
the art, VFA are a product of the acidogenesis, they are then
used by the next reactions to produce methane. However,
when too much VFA are produced, inhibitions of the
methane production may occur. The amount of remaining
VFA is as many methane that as not be produced.
Digester N°
13 14 15 18 19 20 21 22 24 28 29 30
% of CH4 produced
by the endogenous 17 17 19 30 18 22 17 22 21 30 40 34
production (%)
Table 4. Methane production along the time and BMP
Figure 4. How VFA impact methane production
According to Figure 5, the methane represents 55% to
75% of the volume of biogas. It is slightly higher than the
range of value from the literature data, which can be
explained by the assumption that biogas is only made of
methane and carbon dioxide. The solution of hydroxide
sodium only removes the carbon dioxide, thus other gas
remains in the volume considered as methane.
Experiment Total CH4 Total CH4 Total CH4 % of total CH4 BMP50
N°
Produced in Produced Produced production in (mL
the 17 first in the 25 in 50 the first 25 CH4/gVS)
days
days
first days days
1
103.2
185.3
217.4
84%
–
2
45.3
106.5
153.8
70%
–
3
178.4
358.5
425.5
84%
–
4
130.8
159.1
176.4
93%
-30.9
5
968.5
1313.3 1353.1
96%
321.5
6
185.6
327.3
391.7
84%
18.0
7
128.8
344.5 1497.4
25%
243.3
8
114.3
192.1
920.4
32%
156.9
9
135.2
135.2
266.7
53%
-7.4
10
180.7
356.5
919.0
39%
90.9
The use of a mixed inoculum as in the experiments 7 to 10
slows down the AD. According to Table 4, these experiments
produce 25 - 53% of their methane in 25 the first days, whereas
Figure 5. Daily methane and biogas production
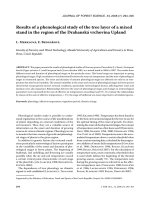
The experiments have been sorted along their methane
production in a decreasing order:
- Experiment 5: food waste + AD sludge.
- Experiment 7: food waste + Cow rumen + AD sludge.
- Experiment 8: food waste + AD sludge + UASB sludge.
- Experiment 10: food waste + Cow rumen + AD sludge
+ UASB sludge.
Figure 3. Changes in pH
Table 3. Percentage of endogenous production
Website:
Vol. 56 - No. 4 (Aug 2020) ● Journal of SCIENCE & TECHNOLOGY 127
KHOA HỌC CÔNG NGHỆ
- Experiment 6: food waste + UASB sludge.
The results obtained in experiment 5 (Figure 6) using
the AD sludge provided by a running AD plant gave results
close to the literature data - represented by the two
horizontal lines - which indicates that the experimental setup works well.
An analysis of variance was initially planned for all the
experiments; however, because some digesters have been
set aside, analysis of variance can only be conducted
between experiments 5, 7 and 10.
For those experiments:
- The homogeneity of variances and the normal
distribution of the variable do not need to be checked,
because the samples have the same size.
- Independence of observation is checked by the study
design.
The analysis of variance gives us the following results:
- The use of only AD sludge as inoculum produces
significantly more biogas and methane than the use of a
mixed of AD sludge and cow rumen (p < 0.05).
- The use of only AD sludge as inoculum produces
significantly more biogas and methane than the use of a
mixed of AD sludge, cow rumen and UASB sludge (p < 0.01).
- The use of a mixed inoculum of AD sludge and cow
rumen produces significantly more biogas and methane
than the use of a mixed of AD sludge, cow rumen and UASB
sludge (p < 0.01).
Figure 6. Total biogas and methane yield
Even if no analysis of variance could have been done on
experiment 8 because it ended up containing only 2 digesters,
it shows interesting results. The use of a mixed inoculum of AD
sludge and UASB sludge seems to give results between only
AD sludge and a mix of AD sludge and cow rumen. Cow
rumen and UASB sludge are not as suitable choice for an
inoculum, indeed experiments 4 and 6 using as inoculum
respectively cow rumen and UASB sludge did both fail except
digester 18 but its results are not conclusive. The largest
biogas and methane production have been obtained while
using a single inoculum: AD sludge. Any mix of AD sludge with
another inoculum has only lower the gas production as it can
be seen in experiments 7, 8 and 10.
4. CONCLUSIONS
The goal of the study was to determine the impact of
the use of a mixed inoculum on the methane yield. The use
of a mixed inoculum was expected to provide more diverse
128 Tạp chí KHOA HỌC VÀ CÔNG NGHỆ ● Tập 56 - Số 4 (8/2020)
P-ISSN 1859-3585 E-ISSN 2615-9619
nutrients and microorganism to achieve anaerobic
digestion than one inoculum. For the chosen inoculum and
food waste, the use of a mixed inoculum did not lead to any
improvement in the methane production and even slow
down the kinetic of the reaction.
The use of a single inoculum AD sludge gave better
results, while the cow rumen and UASB sludge seems to be
inadequate inoculum for food waste AD. This AD sludge
came from a homemade AD plant, where the feedstock is
based on pig manure and human feces. However, this
study presents some bias, only one type of food waste has
been used, which can lead to different results in methane
production due to different affinities between the food
waste and the inocula. Moreover, strong assumptions have
been made for the S/I ratio and for the simplification of the
biogas composition.
Further researches must be conducted to focus on the
identification of the reasons for the differences in methane
yield between the digesters. They should investigate the
inhibitions occurrences and use a microbiological
approach. Anaerobic digestion must be considered as one
of the few technologies that can both produce energy and
reduce environmental pollution,
ACKNOWLEDGEMENTS
This research was financed by Hanoi University of
Science and Technology (HUST), Vietnam, in a project name
T2018-PC 080.
REFERENCES
[1]. Gustavsson, Jenny, Christel Cederberg, Ulf Sonesson, 2011. Global Food
Losses and Food Waste: Extent, Causes and Prevention; Study Conducted for the
International Congress Save Food! At Interpack 2011, [16 - 17 May], Düsseldorf,
Germany. Rome: Food and Agriculture Organization of the United Nations.
[2]. André, Laura, 2016. Étude de Verrous Scientifiques et Technologiques Pour
La Compréhension et l’optimisation Du Procédé de Méthanisation Voie Sèche
Discontinu
de
Sous-Produits
d’origine
Agricole.
Compiègne.
/>[3]. Buchauer K., 2007. A Comparison of Two Simple Titration Procedures to
Determine. n.d., 8.
[4]. Zhang, Ruihong, Hamed M. El-Mashad, Karl Hartman, Fengyu Wang,
Guangqing Liu, Chris Choate, Paul Gamble, 2007. Characterization of Food Waste
as Feedstock for Anaerobic Digestion. Bioresource Technology 98, no. 4, 929–35.
/>[5]. Capson-Tojo, Gabriel, Maxime Rouez, Marion Crest, J-P Steyer, J-P
Delgenes, Renaud Escudié, 2017. Stabilization of Anaerobic Digestion of Food
Waste for Methane Production. Conference: 1st International ABWET Conference:
Waste-to-bioenergy: Applications in Urban areas, At Paris, FRANCE.
THÔNG TIN TÁC GIẢ
Đinh Quang Hưng1, Đỗ Trọng Mùi1, Damien Lagar2, Mai Thị Linh1,
Hoàng Thị Linh1
1
Viện Khoa học và Công nghệ môi trường, Trường Đại học Bách khoa Hà Nội
2
Viện Nghiên cứu ứng dụng quốc gia Lyon
Website: