The trade off between interest income and non interest income of vietnam commercial banks
Bạn đang xem bản rút gọn của tài liệu. Xem và tải ngay bản đầy đủ của tài liệu tại đây (221.56 KB, 23 trang )
Vu Thi Le Giang & Hoang Hai
Yen | 719
The trade off between interest income
and non-interest income of Vietnam
commercial banks
VU THI LE GIANG
University of Economics HCMC –
HOANG HAI YEN
University of Economics HCMC –
1. Introduction
The main traditional activities of banks include deposit taking
and lending. Besides these activities, banks also diversify their
activities to non-interest income activities and this trend become
more and more popular. Research of Stiroh (2004) on American
banks stated that in 1980s non-interest income activities account
for 19% total banks’ income while 2001 this number was 43%.
Studies of Lepetit, Nys, Rous, and Tarazi (2008) on European
banks also got the same results, the percentage of non-interest
income increased from 26% to 41%. This trend is also repeated in
other countries such as Australia, China although the growth rate
is not as high as in US and Europe. The strong increasing in noninterest income raises a question for bank managers and
researchers: whether increasing in non-interest income activities
is good for banks? Should banks continue this trend? Many
researches related to this field are conducted but results are mix
findings.
Vietnam also follows this trend. With difficulties in credit
expansion, banks are increasingly seeking revenues from noninterest income activities. Results of this shift are not fully
assessed. Prior researches in Vietnam only studied about the sole
impact of diversify income (interest income and non-interest
income) to profit or to risk but these researches haven’t assessed
systematically the trade-off between risk and return of interest
income activities and non-interest income activities. That the
reason why we study about “the trade-off between interest
income and non-interest income of Vietnam commercial banks”.
720 | ICUEH2017
Non-interest income include “fiduciary income, service charges,
trading revenue, and fees and other income” (Stiroh, 2004). In our
research, we use “Total Non-interest Operating Income” in the
balance sheet of banks as a noninterest income. To exploit the
problems, we use two ratios to measure the trade-off between risk
and return (Vi and RAP as Williams and Prather (2010). Data from
27 Vietnam commercial banks between 2006 and 2015 is
collected from Bankscope. We find that diversification activities to
non-interest income increases return against one unit of risk.
However, this return will reduce if we continue to shift to noninterest income activities. This result encourages banks to invest
in non-interest income activities but they also need to control
these activities to avoid over-investment.
Our paper is constructed into five parts. The next part will be
literature review about income diversification. The third part
describes data and methodology. The fourth part discusses the
results and final part is conclusions.
2. Literature review
Researches about diversification banking activities to
noninterest income activities got mix findings. Some research
conclude that shifting toward noninterest income activities can
bring back higher returns for banks while other studies prove that
diversification doesn’t add benefit for banks but banks have to
suffer higher risks. However, all the researches agreed at the
same point that traditional activities are less risk than noninterest
activities.
DeYoung and Roland (2001) examines on 472 US commercial
banks between 1988 and 1995. They tried to answer whether, how
and to what degree the shifts to noninterest income affect the
volatility of bank earnings. Results reveal that shifting from
traditional activities to non-traditional activities was increasing and
bank’s return increased when they diversify to noninterest income
activities. However, the volatility of bank earnings was also higher.
Stiroh (2004) had the same point of view with DeYoung and Roland
(2001) that non-interest income was more volatile than traditional
income. Author studied US banks from the late 1970s to 2001 to
examine the affections of non-interest income to banks profit and
revenue. He found that there was a reduction in volatility of bank
revenue growth in 1990s but this was because of the lower volatility
of net interest income “rather than the diversification benefits from
increased noninterest income” (Stiroh, 2004). He concluded that
noninterest income was still more volatile than net
Vu Thi Le Giang & Hoang Hai
Yen | 721
interest income. Other research conducted in Europe by Lepetit et
al. (2008) using data from 734 banks also found the same result.
Authors compared risk level of banks which diversified to
untraditional activities with banks which didn’t follow this strategy.
Results revealed that diversifying banks suffered higher risks and
these risks highly correlated with commission and fee incomes
than trading activities. In Vietnam, (Vo & Tran, 2015) studied 37
commercial banks from 2006 – 2013. They concluded that banks
increasing fee-based activities may get lower profits and higher
risks than banks pursuing traditional activities.
In contrast with the above researches, the following studies
confirmed that shift to noninterest income activities bring benefits
to banks. Smith, Staikouras, and Wood (2003) studied the
variability and the correlation between interest and non-interest
income for banks in European countries from 1994-1998. Sample
included 200 large banks having total assets over 10 billions USD
and 2455 small banks. The research found that shift to noninterest income make profits in European banks stable in the
research period. In addition, recent study of Lee, Yang, and Chang
(2014) for 967 banks of 22 Asia countries from 1995 to 2009
about the impacts of non-interest income on profits and risks
found that non-interest income reduced risks but did not increase
profit. Especially, results became complicated when bank
specialization and a country's income level were considered. To
saving banks, profit reduced and risks increased when they shift
to non-interest income activities. In high income countries, these
activities increased bank risks while in middle and low income
countries, non-interest income activities increased profits and
decreased risks.
Other researches did not examine sole impacts of shifting to feebased income activities to returns and risks but they accessed the
trade-off between returns and risks. Results from these researches
are also mix findings. Some empirical researches find fee-based
income activities have negative impacts to the trade-off between
returns and risks while other studies get opposite results. DeYoung
and Rice (2004) proved that increasing noninterest income activities
lead to higher volatilities in returns. They researched 4,712
commercial banks in United State from 1989 to 2001 with 37,175
observations about the relationships of non-interest income, business
strategies, market conditions, technological changes and financial
performance. The results stated that increasing in non-interest
income made the trade-off between risks and returns poorer. In
addition, study of Stiroh and Rumble (2006) for Financial Holding
Companies – FHCs in United
722 | ICUEH2017
State also got the same results. They researched 1800 FHCs from
1997 to 2002 and found evidences about the benefits of
diversification. However, these benefits were offset by increasing
companies’ investments in non-interest income activities which
were volatility and “not necessarily more profitable than
traditional activities” Stiroh and Rumble (2006). With some typical
companies, shift to fee-based income decreased risk-adjusted
returns. This confirmed that these FHCs must accept more risks to
get non-interest incomes.
Besides studies stated that non-interest income had negative
impacts to the trade-off between risks and returns, some studies
found opposite results. Williams and Prather (2010) stated there
was a positive impact to the trade-off between risks and returns
when banks shift from traditional activities to fee-based income
activities. Williams and Prather (2010) researched on 49
commercial banks which included 4 big banks accounted for 65%
total assets of commercial banks in Australia and issued most of
financial products, the second group was domestic banks
specialized in retail finance and the third group was foreign banks.
They concluded that non-traditional activities were riskier than
traditional activities. However, combining these two activities was
benefit for shareholders in diversification their portfolio and
reduced risks for banks.
3. Data description and methodologies
3.1. Data description
Our research uses data of 27 commercial banks in Vietnam
from 2006-2015. Foreign bank, foreign bank branches, jointventure banks aren’t included in the sample because data of
these banks aren’t updated in Bankscope. As statistic of State
Bank of Vietnam, there are 33 commercial banks. This research
excludes 6 commercial banks: Global Petro Bank, National Citizen
Bank, BacA Bank, KienLongBank, HDBank and Vietbank because
data of these banks aren’t updated in 5 years consecutive from
2006-2015.
When studying the differences between state-owned banks and
other joint stock commercial banks, we use the classification of
State Bank of Vietnam. However, group of state-owned banks just
includes 4 banks: Bank for Foreign Trade of Vietnam, Bank for
Investment and Development of Vietnam, Vietnam Bank for
Agriculture and Rural Development, Vietnam Joint-Stock
Commercial Bank for Industry and Trade. The other state-owned
banks were acquired by State Bank of Vietnam during the
restructuring
Vu Thi Le Giang & Hoang Hai
Yen | 723
banking systems. Therefore, if we include the data of these banks
in the data of state-owned banks, the data will be biased.
3.2. Methodologies
We use two indexes to measure the trade-off between risks and
returns in research of Williams and Prather (2010).
First, descriptive statistic is conducted to compare non-interest
income and net interest income for all banks in the sample and in
2 groups of banks (state-owned banks and other joint stock
commercial banks). Results from descriptive statistic reveal the
stable of these income sources and which source is the main
income source of banks. After that, the percentage of each
income source is calculated to know the trend of shifting to noninterest income activities in Vietnam banking system.
Second, in order to understand whether diversification into noninterest income activities is benefit for banks, the authors
undertake three steps.
Calculate correlation of five elements: net interest income against
total assets, non-interest income against total assets, net interest
income against total equity, non-interest income against total equity
and ROE before tax. Results reveal whether the combination of both
traditional and non-traditional activities can reduce bank risks or not.
Besides, results also state if non-interest income activities is benefit
for shareholders.
Calculate Vi (Williams & Prather, 2010). This index state how
much risk banks have to tradeoff for one unit of return.
Vi =
бi
µi
бi is the annual standard deviation of returns for
income source i µi is the average annual return
for the income source i
Calculate RAP (Williams & Prather, 2010) which is the return
premium for each unit of risk. Comparison RAP of net interest
income, RAP of non-interest income and RAP of total income will
give the conclusion whether shift to non-interest income bring
benefit for banks or not.
RAPi =
ri - rf
бi
724 | ICUEH2017
Where:
ri : the average annual return for the income source i over the
study period
rf : the average annual return for the risk-free asset over the
study period
бi : the annual standard deviation of returns for the income
source i for the study period
Results getting from the above three steps will be discussed
and summarized to find the final results for the research.
4. Results
4.1. Descriptive statistic
Table 1
Indicators related to net interest income and non-interest income
All banks
Mean
Standard deviation
Max
Min
N
State owned bank
Mean
Standard deviation
Max
Min
N
Other joint stock commercial bank
Mean
Standard deviation
Max
Min
N
Vu Thi Le Giang & Hoang Hai
Yen | 725
Source: Calculated from Bankscope by authors
Means of net interest income aren’t different for banks in two
groups. However, standard deviation of net interest income for
state owned banks is smaller than that value for other joint stock
commercial banks. About non-interest income against total
assets, mean of state-owned banks is higher than the value of
joint stock commercial banks but the volatility of non-interest
income against total assets for second group of banks is much
higher than the first group. The results from table 1 also state
traditional activities are main source of income for banks with the
proportion of interest income in total income is above 90%.
During the 80s, non-interest incomes in United State accounted
for 19% total income while in 2001 this rate was 43% (Stiroh,
2004). The same trend also happened in Europe with increasing
from 26% in 1989 to 41% in 1998 (ECB2000). In Vietnam, shift to
non-interest income activities is not as strength as the above
regions. Statistic in research period from 2006-2015, the
percentage of non-interest income only accounts for 8% of total
income and this proportion has been reducing since 2010 until
now. Before 2011, the percentage of non-interest income was
about 11% of total income but in 2011-2015, it was only 5-6%.
These number state that there was a strong reducing in the
proportion of non-interest income. We don’t investigate the
reasons of this reducing. However, the time starting for the down
trend was the same with the time the State Bank of Vietnam
started to restructure the banking systems. Therefore, we
question whether the restructuring banking systems had impacts
to the proportion of non-interest income. From the above analysis,
we divide the research period into two parts: first period is from
2006 to 2010 and the second period is from 2011-2015 .
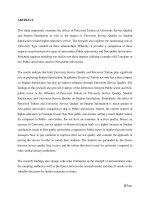
Figure 1: The proportion of interest income and non-interest income
over total income
726 | ICUEH2017
100.0%
80.0%
The proportion
of non- interest
income against
total income
60.0%
40.0%
20.0%
0.0%
2006
The proportion of non- interest…
Source: calculated from Bankscope data
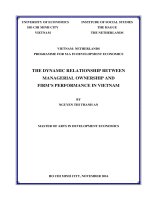
Figure 2: The percentage of net interest income and non-interest
income against total assets
3.50%
3.00%
2.50%
2.00%
1.50%
1.00%
0.50%
0.00%
2
Source: calculated from Bankscope data
The above figures state that during the research period from
2006 to 2015, net interest income was still the main source of
income for banks and two sources of income had opposite trend.
Therefore, we expect that these two sources of income may have
negative correlation and combination these two sources of income
in the investment portfolio of banks may reduce total risk.
Vu Thi Le Giang & Hoang Hai
Yen | 727
4.2. The risks and returns trade-off when banks invest
in both traditional
activities and fee income activities
To determine whether investing in non-traditional activities
reduces risks or not, we calculate the correlation between
traditional income and non-interest income. The results state that
the correlation of these two sources of income for the group of all
banks or for the group of join stock commercial banks are
negative. These results confirm that combining interest income
activities and non-interest income activities can reduce total risk
for banks. In addition, the correlations between pre-tax ROE and
non-interest income against equities for these two groups of
banks are positive. It means that increase non-interest income will
have positive impact to pre-tax ROE.
The correlation between net interest income and non-interest
income of state-owned bank group is small and the signs of
correlation are both negative and positive. The correlation
between non-interest income against total assets and net interest
income against total assets is -0.05 while the correlation between
non-interest income against total equity and net interest income
against total assets is +0.04. Therefore, from the above
information, it’s hard to conclude whether the combination of
interest income activities and non-interest income activities is
good or not for state-owned banks.
Table 2
Correlation of elements
ALL BANKS
Net interest income/total
assets
Non-interest income/total
assets
Net interest income/total
equity
Non-interest income/total
equity
Pretax ROE
STATE-OWNED BANKS
728 | ICUEH2017
Net interest income/total
assets
Non-interest income/total
assets
Net interest income/total
equity
Non-interest income/total
equity
Pretax ROE
OTHER JOINT STOCK COMMERCIAL BANKS
Net interest income/total
assets
Non-interest income/total
assets
Net interest income/total
equity
Non-interest income/total
equity
Pretax ROE
Source: calculated from Bankscope data
To determine the risks and returns trade-off, we use two
indexes presented in research of Williams and Prather (2010). The
first index Vi measures level of risks against one unit of return.
The results for Vi are presented in the following table.
Table 3
Vi index for indicators in each bank group
Net
interest
margin
ALL BANKS
Mean
3.43%
SD
1.23%
n
226
Vi
35.89%
STATE-OWNED BANKS
Mean
3.46%
SD
0.73%
n
39
Vi
21.01%
OTHER JOINT STOCK COMMERCIAL BANKS
Mean
3.47%
SD
1.31%
n
179
Vi
37.75%
Source: calculated from Bankscope data
Vi index measures level of risk against one unit of income which
banks have to suffer. The results from the above table show that
fee-based income is much riskier than traditional incomes. This
result is consistent with researches in the literature review. When
we compare two groups: state-owned banks and joint stock
commercial banks, Vi indexes of state-owned banks group are
much smaller than these indexes in joint stock commercial banks
group and the differences between Vi of interest income and noninterest income of state-owned banks group are also smaller than
the differences of joint stock commercial banks group. This
confirms that state-owned banks suffer less risk than joint stock
commercial banks.
Although risks from non-interest income activities are much
higher than risks from traditional activities, Vi of total net interest
income and non-interest income/total equity is smaller than net
interest income/total equity. This result states that shifting to feebased income will reduce risks which shareholders have to suffer.
Consider risks and returns tradeoff at another angle, we use
RAPi which is an index measuring excess return per unit of risk.
Results of RAPi of each bank group are presented in the following
table.
730 | ICUEH2017
Table 4
RAPi for indicators in each bank group
ALL BANKS
Year
RAP
2015
2014
2013
2012
2011
2010
2009
2008
2007
2006
20062015
20062010
20102015
STATE-OWNED BANKS
Year
RAP
2015
2014
2013
2012
2011
2010
2009
2008
2007
2006
20062015
20062010
20102015
JOINT STOCK COMMERCIAL BANKS
Year
RAP
2015
2014
2013
2012
2011
2010
2009
2008
2007
2006
20062015
20062010
20102015
Source: calculated from Bankscope data
During the research period, RAP of total net interest income and
non-interest income are higher than RAP of net interest income,
except in 2011 (all bank group and joint stock commercial banks
group) and in 2008 (state-owned banks group). These results prove
that when diversification to non-interest income activities, return per
unit of risk will be higher than return per unit of risk if banks just
invest in interest income activities. RAP in the whole research period
2006-2015 or RAP in each period 2006-2010 and 2011-2015 for all
banks or for each group of banks also get the same result. This one
more time confirms that the combination of non-interest income
activities and interest income
732 | ICUEH2017
activities gets higher return per unit of risk than just investing in
net interest income.
Therefore, shifting to fee-based income is reasonable.
The above results also reveal that at a certain time, RAP of noninterest income is negative. At that time, although RAP of total net
interest income and non-interest income is higher RAP of net
interest income, instead of investing in non-interest income,
investing in risk free rates will produce better return.
Another issue we find from the above result is that during 20062010 when the proportion of non-interest income is about 11% of
total income, RAP of all banks and RAP of joint stock commercial
banks are lower than these values in 2011-2015 when the
proportion of non-interest income is only about 5-6% of total
income. This result reveals that although diversification to noninterest income activities increases return per unit of risk, the
more invests in non-interest income activities, the less benefit
derive from diversification because return per unit of risk will
reduce.
5. Conclusions
Using Vi and RAPi, we find that although risks to shareholders
reduce when banks diversification to non-interest income activities,
returns from these non-traditional activities are riskier than returns
from traditional activities. Besides, when banks diversify their
activities, return per unit of risk increase. However, the more invests
in fee-based income activities, the less benefit derive from
diversification because return per unit of risk will reduce. In
summary, diversification to non-interest income activities is right
track but increasing the proportion of non-interest income activities,
return per unit of risk will decrease. Therefore, bank managers
should control their shifting to non-interest income activities to
exploit the benefit of diversification and avoid disadvantages.
Testing the difference of risk and return trade-off between two
bank groups (state-owned banks and joint stock commercial
banks) we find that there is a difference in risk suffered by two
groups. Risk per unit of return of state-owned banks is much
smaller than this value of other joint stock commercial banks.
Although diversification to non-interest income activities is
expanding in many countries in the world and the proportion of these
non-traditional activities account for 20%-40% of total income, the
opposite trend is happening in Vietnam. The proportion of non-
interest income activities reduces from 11% in the period 2006-2010
to about 5%
Vu Thi Le Giang & Hoang Hai
Yen | 733
in the period 2011-2015. Our results confirm that commercial
banks should diversify their activities to non-interest income
activities. However, they also should notice that the benefit from
diversification will reduce when they increase their investment in
non-interest income activities. In addition, interest income
activities are still main source of income and they are less risk
than non-interest income activities. Facing with difficulties in
expanding credit, banks may shift to fee-based income activities
to increase returns, reduce risks for shareholders but if banks
have opportunities to expand lending, they should focus their
resources in this activity.
Besides the above results, our research has some limitations.
First, data was collected only in 10 years (2006-2015). Therefore,
this limitation is also influence to the findings. Second, we exclude
foreign banks, foreign bank branches and joint-venture banks
from our data because of insufficient data. It’s better if we can
include these banks in the data because they are different from
domestic banks and they may have different strategies in
developing non-interest income activities. Comparing foreign bank
group and domestic bank group may give a deeper understanding
about diversification to fee-based income activities. Third, our
research has not suggested an optimal proportion which bank
managers should invest in non-interest income activities. From
the above limitations, we suggest future researches should
include data of foreign banks, foreign bank branches and jointventure banks to get better findings. In addition, a research about
level of investment in non-interest activities will be benefit for
bank managers.
References
Alhassan, A. L. (2015). Income diversification and bank efficiency in an
emerging market. Managerial Finance, 41(12), 1318-1335.
doi:doi:10.1108/MF-12-2014-0304
DeYoung, R., & Rice, T. (2004). Noninterest income and financial performance at
US commercial banks.
Financial Review, 39(1), 101-127.
DeYoung, R., & Roland, K. P. (2001). Product mix and earnings volatility at
commercial banks: Evidence from a degree of total leverage model. Journal
of financial intermediation, 10(1), 54-84.
Ho, M. T. H., & Nguyen, C. T. (2015). Đa dạng hóa thu nhập và các yếu tố tác
động đến khả năng sinh lời của các ngân hàng thương mại Việt Nam. Công
nghệ Ngân hàng, 106 & 107.
Lee, C.-C., Hsieh, M.-F., & Yang, S.-J. (2014). The relationship between revenue
diversification and bank performance: Do financial structures and financial
reforms matter? Japan and the World Economy, 29, 18-35.
734 | ICUEH2017
Lee, C.-C., Yang, S.-J., & Chang, C.-H. (2014). Non-interest income, profitability,
and risk in banking industry: A cross-country analysis. The North American
Journal of Economics and Finance, 27, 48-67.
Lepetit, L., Nys, E., Rous, P., & Tarazi, A. (2008). Bank income structure and risk:
An empirical analysis of European banks. Journal of Banking & Finance,
32(8), 1452-1467.
Smith, R., Staikouras, C., & Wood, G. (2003). Non-interest income and total
income stability.
Stiroh, K. J. (2004). Diversification in banking: Is noninterest income the
answer? Journal of Money, Credit, and Banking, 36(5), 853-882.
Stiroh, K. J., & Rumble, A. (2006). The dark side of diversification: The case of
US financial holding companies. Journal of Banking & Finance, 30(8), 21312161.
Vo, V. X., & Tran, M. T. P. (2015). Lợi nhuận và rủi ro từ đa dạng hóa thu nhập
của Ngân hàng thương mại Việt Nam. Tạp chí Phát triển kinh tế, 26(8), 5470.
Williams, B., & Prather, L. (2010). Bank risk and return: the impact of bank noninterest income.
International journal of managerial finance, 6(3), 220-244.