Growth performance and radiation use efficiency of transplanted rice under varied plant densities and nitrogen levels
Bạn đang xem bản rút gọn của tài liệu. Xem và tải ngay bản đầy đủ của tài liệu tại đây (370.27 KB, 9 trang )
Int.J.Curr.Microbiol.App.Sci (2017) 6(5): 1429-1437
International Journal of Current Microbiology and Applied Sciences
ISSN: 2319-7706 Volume 6 Number 5 (2017) pp. 1429-1437
Journal homepage:
Original Research Article
/>
Growth Performance and Radiation Use Efficiency of Transplanted
Rice under Varied Plant Densities and Nitrogen Levels
R. Swarna, P. Leela Rani*, G. Sreenivas, D. Raji Reddy and A. Madhavi
Department of Agronomy, College of Agriculture, Professor Jayashankar Telangana state
Agricultural University, Rajendranagar, Hyderabad - 500 030, India
*Corresponding author
ABSTRACT
Keywords
Leaf Area Index
(LAI), Nitrogen,
Plant densities,
PAR, RUE, Rice.
Article Info
Accepted:
17 April 2017
Available Online:
10 May 2017
A field experiment was conducted at Agricultural Research Institute, Rajendranagar,
Hyderabad during the Kharif season of 2012 with four nitrogen levels (120 kg ha -1, 180 kg
ha-1, 240 kg ha-1 and 300 kg ha-1) as factor one and three plant densities - farmers practice –
zigzag planting (28 hills m-2), 15×15 cm (44.44 hills m-2), 25×25 cm (16 hills m-2) as factor
two in randomized block design with factorial concept replicated thrice. Increased number
of tillers m-2, leaf area index (LAI), intercepted radiation and radiation use efficiency
(RUE) was noticed with increased plant density from 16 to 44.44 hills m -2. Application of
300 kg N ha-1 showed more number of tillers m-2, LAI, intercepted radiation and RUE and
was onpar with 180 kg N ha-1. A highly significant linear relationship observed between
cumulative intercepted photosynthetically active radiation (PAR) and biomass production.
So plant density of 44.44 hills m-2 and application of 180 kg N ha-1 could be considered as
optimum for improved growth and radiation use efficiency of transplanted rice in South
Telangana Region of Telangana State.
Introduction
Rice (Oryza sativa L.) is the world’s second
most important cereal crop and staple food for
more than 60% of the global population. It is
estimated that more than 50 kg of rice being
consumed per capita per year worldwide
(FAO, 2016). Since the world population is
increasing at 1.17% annually, an annual
increase in rice production by 0.6- 0.9% is
required until 2050 to meet the anticipated
demand (Carriger and Vallee, 2007). India
ought to add 1.7 million tones of additional
rice every year to ensure national food
security (Dass and Chandra, 2013).
Previously, this demand was met by
extending the area under cultivation, aided by
advancement in irrigation facilities. In future,
the competition for land and other natural
resources will render it difficult to extend the
area. This puts a huge challenge to the rice
scientists as the incremental rice productions
are to be met from shrinking, depleting
resources and changing climate situations.
Hence, to sustain the rice yields with
improved resource use efficiency, attempts
should be made to increase the yield per unit
area through improved technology and proper
agronomic management practices. Among the
crop management practices, judicious
application of nitrogenous fertilizer with
optimum plant density is paramount important
for yield enhancement and improved resource
use in rice.
1429
Int.J.Curr.Microbiol.App.Sci (2017) 6(5): 1429-1437
Nitrogen is the kingpin for any fertilizer
management programme in rice cultivation.
Inadequate N leads to reduced leaf area,
thereby,
limiting
light
interception,
photosynthesis and finally biomass growth,
grain yield, radiation use efficiency and water
productivity (Sinclair, 1999). Therefore, using
higher N rates for increasing rice yield is a
promising management recommendation.
When N-fertilizer is applied in proper amount
at correct time, N-fertilizer recovery can be
achieved up to 50–70% of total nitrogen
applied (Wang et al., 2002 and Ligeng et al.,
2004).
Plant density plays a key role in boosting rice
yields, as it influences the tiller formation,
solar radiation interception, nutrient uptake,
rate of photosynthesis and ultimately affect
the growth and development of rice plant. The
amount of solar radiation intercepted by a
crop is a major determinant of the total dry
matter (TDM) produced (Biscoe and
Gallagher, 1978). Optimum plant spacing
ensures plants to grow properly both in their
aerial and underground parts through
utilization of solar radiation and nutrients,
therefore proper manipulation of planting
density may lead to increase in the economic
yield of transplanted rice. Considering these
facts, the present study was undertaken to
determine the suitable plant density and
nitrogen level for optimum growth and
improved radiation use efficiency of
transplanted rice.
Materials and Methods
The experiment was conducted at Agricultural
Research Institute, Professor Jayashankar
Telangana State Agricultural University,
Rajendranagar, Hyderabad during the period
from July to November 2012. The soil of the
experimental site was sandy loam in texture,
alkaline in reaction, low in available nitrogen,
phosphorus and high in available potassium.
The experiment was laid out in a factorial
randomized complete block design with three
replications. The treatments comprised of
three plant densities (PD1- farmers practice:
28 hills m-2, PD2- 15x15cm: 44.44 hills m-2
and PD3- 25x25 cm: 16 hills m-2) and four
nitrogen levels (N1: 120, N2: 180, N3: 240 and
N4: 300 kg ha-1). Cultivar MTU 1010 was
used as test variety. Recommended dose of
P2O5, k2O and Zn fertilizers were applied @
60, 40 and 50 kg ha-1 through single super
phosphate (SSP), muriate of potash (MOP)
and zinc sulphate. The whole amount of SSP,
MoP and ZnSO4 were applied at the time of
final land preparation. Nitrogen was applied
as per the treatments in the form of urea (46%
N) in three equal splits at planting, 20 days
after planting (DAP) and at panicle initiation
(PI) stage. Irrigation along with other
intercultural operations was done as and when
required. Data on plant height, tiller number
and leaf area index were collected as per
standard procedures.
Radiation interception and radiation use
efficiency
Canopy light interception was measured
between 11.00 and 13.00 h at mid tillering,
panicle initiation, Heading and physiological
maturity stages using Sunscan Canopy
Analysis System. In each plot, incident,
transmitted and reflected photosynthetically
active radiation (PAR) were measured
periodically at the top, middle and bottom of
rice crop throughout the season. These
measurements were used to derive the
Intercepted PAR (IPAR). Intercepted
radiation during the entire growing season
was the summation of intercepted radiation
during each growth period. Radiation use
efficiency (RUE) was calculated as the ratio
of above ground total dry weight to
intercepted radiation during the entire
growing season. The collected data were
statistically analyzed and mean differences
were compared using SAS programme.
1430
Int.J.Curr.Microbiol.App.Sci (2017) 6(5): 1429-1437
Results and Discussion
Plant height (cm)
Plant height increased progressively with
advancement of crop growth and attaining
maximum at physiological maturity stage.
The rate of increase, however, varied
depending on the growth stages. A significant
variation in plant height was observed due to
nitrogen levels at heading, dough and
physiological maturity stages but not with
planting density (Table 1). Even though 300
kg N ha-1 recorded significantly more plant
height and was comparable with 240 and 180
kg N ha-1. These were significantly superior
to 120 kg N ha-1 application. The increase in
plant height with increased nitrogen
application irrespective of plant density might
be primarily due to enhanced vegetative
growth with more nitrogen supply to plant.
Sharma et al., (2012) also reported taller
plants at higher (150 and 180 kg ha-1) levels
of nitrogen application than at lower level of
N (120 kg ha-1).
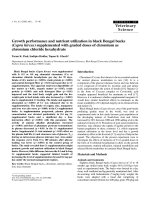
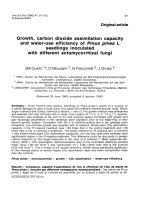
Number of tillers m-2
The tiller production initiated at 17 days after
transplanting (DAT) and thereafter it was
increased linearly as the crop growth
progressed and reached to maximum at 31-38
days after transplanting (maximum tillering
stage), but thereafter it decreased gradually
towards maturity stage due to tiller mortality
and the senescence of plants (Figs. 1&2).
These results were in conformity with
findings of Yoshida (1981) where the tiller
number declines after the maximum tillering
stage. Significant increase in tillers m-2 was
observed with increase in plant density from
16 to 44.44 hills m-2 and the highest number
of tillers m-2 was recorded with 44.44 hills m-2
at all the crop growth stages and was
significantly superior to 28 and 16 hills m-2,
which in turn recorded the lowest number of
tiller m-2. This more number of tillers m-2 at
higher plant densities might be due to more
plants m-2 (Yadav, 2007). There was a
significant effect of graded levels of nitrogen
on tillers m-2. More tillers m-2 was observed
with 180 kg N ha-1 and was on a par with 240
kg N ha-1 and 300 kg N ha-1 and significantly
superior to 120 kg N ha-1. The increase in
tillers m-2 might be due to increased cell
division and cell expansion with the increased
N availability (Sharma et al., 2012).
Leaf area index
LAI of rice with varied planting density and
nitrogen levels showed substantial differences
over the growth stages (Table 2). LAI values
increased sharply, reached maximum at
heading stage and then decreased irrespective
of treatment differences. The rate of decrease
of LAI after attaining peak was more rapid.
Significantly higher leaf area index values
was noticed at tillering and heading stages
with 44.44 hills m-2, and was on par with 28
hills m-2, and were significantly superior to 16
hills m-2. The higher LAI at increased plant
density might be due to more number of
leaves produced per unit area (Yadav, 2007).
With respect to nitrogen levels, maximum
LAI was obtained from 300 kg N ha-1 and it
was on par with 240 and 180 kg N ha-1 and
were significantly superior to 120 kg N ha-1.
The increased LAI was due to more number
of leaves and their better growth under
adequate nitrogen (Sharma et al., 2012).
Intercepted radiation
Plant density and N levels differed
substantially in intercepted radiation. Light
intercepted values varied from 38 to 54% at
tillering and steadily increased, reached
maximum at heading stage and thereafter, %
interception decreased as the crop proceeds
towards physiological maturity. This was due
to senescence of leaves and tiller mortality.
1431
Int.J.Curr.Microbiol.App.Sci (2017) 6(5): 1429-1437
Per cent light interception increased with
increasing planting density from 16 to 44.4
hills m-2 and the highest per cent interception
was recorded with 44.4 hills m-2 at all the
stages of crop growth. This might be due to
increased leaf area index at higher plant
densities
over
low
plant
densities.
Development of adequate leaf area index
necessary for interception and utilization of
incident solar radiation is important and has
been shown to be closely related to final grain
yield (Baloch et al., 2006). The present results
are in agreement with the recent findings of
Gorgy et al., (2010), where increased plant
density (33 hills m-2) reduced the light
intensity between rows of transplanted rice
with increased light interception. Among the
nitrogen levels, higher % light interception
was observed with 300 kg followed by 240,
180 and 120 kg N ha-1. At higher nitrogen
levels, higher light interception might be due
to more tillers m-2, leaf area index, dry matter
production. Similar results were reported by
Haque et al., (2006) where significantly
higher light interception was observed at
heading stage with increasing nitrogen levels
(Table 3).
Radiation use efficiency (RUE)
Radiation use efficiency is increased as the
crop age progressed and it was varied with
plant densities and nitrogen levels. Higher
RUE was observed with 44.44 hills m-2 and
was followed by 28 hills m-2 and the lowest
values were observed with 16 hills m-2 (Table
4).
Table.1 Effect of plant densities and nitrogen levels on plant height of rice
Treatments
Plant height (cm)
Heading Dough
Tillering
PI
PM
33
33
34
0.7
NS
68
68
68
0.5
NS
93
93
92
1.3
NS
110
110
112
1.3
NS
111
110
112
1.3
NS
33
33
34
34
0.8
NS
68
68
68
69
0.6
NS
89b
93a
94a
94a
1.1
3.1
105b
111a
112a
114a
1.5
3.2
106b
111a
113a
114a
1.5
3.0
1.4
NS
1.0
NS
2.6
NS
2.6
NS
2.5
NS
-2
Plant densities (PD) (hills m )
Farmers practice ( 28)
15×15cm (44.44)
25×25cm (16)
SEd+
CD (P=0.05)
Nitrogen (N) (kg ha-1)
120
180
240
300
SEd+
CD (P=0.05)
Interaction (PD×N)
SEd+
CD (P=0.05)
Note: Means with same letter are not significantly different. PI- panicle initiation; PM- physiological maturity
1432
Int.J.Curr.Microbiol.App.Sci (2017) 6(5): 1429-1437
Table.2 Leaf area index (LAI) of rice at different growth stages as influenced by plant
densities and nitrogen levels
Treatments
Tillering
Leaf area index
PI
Heading
Farmers practice (28)
0.78b
2.21
4.26ab
2.40
15×15cm (44.44)
25×25cm (16)
SEd+
CD (P=0.05)
Nitrogen (N) (kg ha-1)
120
180
240
300
SEd+
CD (P=0.05)
Interaction (PD×N)
SEd+
CD (P=0.05)
1.06a
0.52c
0.1
0.2
2.30
1.88
0.2
NS
4.37a
3.92b
0.1
0.3
2.50
2.27
0.2
NS
0.58b
0.84a
0.88a
0.83a
0.1
0.2
1.56b
2.22a
2.31a
2.41a
0.2
0.5
3.16b
4.40a
4.54a
4.63a
0.2
0.3
1.53b
2.55a
2.64a
2.83a
0.2
0.4
0.2
NS
0.4
NS
0.3
NS
0.4
NS
PM
-2
Plant densities (PD) (hills m )
Note: Means with same letter are not significantly different.
PI- panicle initiation; PM- physiological maturity.
Table.3 Intercepted PAR (%) of rice at different growth stages as influenced by plant
densities and nitrogen levels
Treatments
Tillering
Panicle
initiation
Heading
Physiological
maturity
45.02
53.56
37.88
65.63
69.22
59.02
89.92
92.95
89.76
88.19
88.96
86.36
36.40
47.36
48.07
50.12
56.25
62.63
68.11
71.52
86.39
90.30
93.05
93.78
80.64
87.26
90.47
92.97
Plant densities (PD) (hills m-2)
Farmers practice ( 28)
15×15cm (44.44)
25×25cm (16)
Nitrogen (N) (kg ha-1)
120
180
240
300
1433
Int.J.Curr.Microbiol.App.Sci (2017) 6(5): 1429-1437
Table.4 Radiation use efficiency (g MJ-1) of rice at different growth stages as influenced by plant
densities and nitrogen levels
Treatments
Tillering
Panicle
initiation
Heading
Physiological
maturity
141
169
108
615
637
543
1263
1227
1123
1831
1796
1717
118
146
150
144
524
597
666
608
1090
1211
1223
1293
1607
1781
1828
1909
Plant densities (PD) (hills m-2)
Farmers practice ( 28)
15×15cm (44.44)
25×25cm (16)
Nitrogen (N) (kg ha-1)
120
180
240
300
Fig.1 Progress of tiller production (tillers m-2) of rice under different nitrogen levels
1434
Int.J.Curr.Microbiol.App.Sci (2017) 6(5): 1429-1437
Fig.2 Progress of tiller production (tillers m-2) of rice under different plant densities
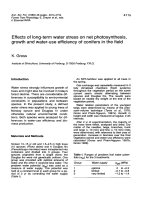
Fig.3 Relationship between intercepted PAR and biomass of rice under variable plant densities
and nitrogen levels
1435
Int.J.Curr.Microbiol.App.Sci (2017) 6(5): 1429-1437
Considering the nitrogen application, as the N
rate increased RUE increased. Highest RUE
was noticed with 300 kg N ha-1 and the values
decreased with corresponding decrease in
nitrogen rate, with lowest values in 120 kg N
ha-1. Increased RUE with increasing nitrogen
fertilizer dose has been reported in several
experiments (Biouki et al., 2014). The
difference in RUE could be due to difference
in the absorbed PAR (Siddique et al., 1989).
Further environment, management and plant
factors such as nitrogen status of the plant
also alter the RUE (Board, 2000).
There was a strong and linear relationship
between total biomass and intercepted PAR
(Fig. 3). The common regression revealed that
intercepted PAR accounted for 99%
variability in the biomass, and the regression
gave a value of 2.43 g MJ-1. Thus, overall
RUE of rice for South Telangana Zone of
Telangana State was estimated to be 2.43 g
MJ-1. Similar results were reported by Ahmad
et al., (2008) who stated that total dry matter
and accumulated intercepted PAR were
linearly related. Kiniry et al., (1989) reported
RUE of 2.2 g MJ-1 of intercepted PAR for a
non-stressed rice crop.
In conclusion, plant density of 44.44 hills m-2
along with application of 180 kg N ha-1 should
be considered optimum for improving growth
performance and radiation use efficiency of
transplanted rice in South Telangana region of
Telangana State.
References
Ahmad, S., M. Zia-ul-Ha, H. Ali, S.A. Shad,
A. Ahmad, M. Maqsood, M.B. Khan, S.
Mehmood and Hussain, A. 2008. Water
and radiation use efficiencies of
transplanted rice (Oryza sativa L.) at
different plant densities and irrigation
regimes under semi-arid environment.
Pak. J. Bot., 40(1): 199-209.
Baloch, M.S., I.U. Awan and Hassan, G.
2006. Growth and yield of rice as
affected by transplanting dates and
seedlings per hill under high
temperature of Dera Ismail Khan,
Pakistan. J. Zhejiang Univ. Sci. A., 7:
572-577.
Biscoe, P.V., and Gallagher, J.N. 1978.
Physical analysis of cereal yield. I.
Production of dry matter. Agric.
Progress, 34-50.
Board, J. 2000. Light interception efficiency
and light quality affect
yield
compensation of soybean at low plant
population. Crop Sci., 40: 1285-1294.
Carriger, S., and Vallee, D. 2007. More crop
per drop, Rice today.
Dass, A., and Chandra, S. 2013. Irrigation,
spaqcing and cultivar effects on net
photosynthetic
rate,
dry
matter
partitioning and productivity of rice
under system of rice intensification in
Mollisol of Northern India. Exp
Agric., 49(4): 504-23
FAO. 2016. FAOSTAT Data (available at:
http://faostat3. fao.org/browse/FB/CC/E
[Accessed on 03 March 2016]).
Gorgy, R.N. 2010. Effect of transplanting
spacings and nitrogen levels on growth,
yield and nitrogen use efficiency of
some promising rice varieties. J Agric
Res., Kafer El-Shiekh University. 36(2):
2010.
Haque, K.M.S., Q.A. Khaliq and Aktar, J.
2006. Effect of nitrogen on phenology,
light interception and growth in
aromatic rice. 2006. Int. J. Sust. Crop
Prod., 1(2): 01-06.
Kiniry, J.R., C.A. Jones, J.C. O'Toole, R.
Blanchet, M. Cabelguenne and Spanel,
D.A. 1989. Radiation-use-efficiency in
biomass accumulation prior to grain
filling for five grain crop species. Field
Crops Res., 20: 51-64.
Ligeng, J., D. Tingbo, J. Dong, C. Weixing,
G. Xiuqin and Shanqing, W. 2004.
1436
Int.J.Curr.Microbiol.App.Sci (2017) 6(5): 1429-1437
Characterizing physiological N-use
efficiency as influenced by nitrogen
management in three rice cultivars.
Field Crops Res., 83: 239.
Sharma, P., V. Abrol and Kumar, R. 2012.
Effect of water regimes and nitrogen
levels on rice crop performance and
nitrogen uptake. Ind. J. Soil Conserv.,
40(2): 122-128.
Siddique, K.H.M., R.K. Belford, M.W. Perry
and Tennant, D. 1989. Growth,
development and light interception of
old and modern wheat cultivars in a
Mediterranean type environment. Aust.
J. Agric. Res., 40: 473-487
Sinclair, T.R., and Muchow, R.C. 1999.
Radiation use efficiency, In: Adv
Agron., 215-265.
Wang, H., B. A. M. Bouman, Z. Dule, C,
Wang and Moya, P.F. 2002. Aerobic
rice in northern China: opportunities
and challenges. In Bouman, B. A. M.,
Hengsdijk, H., Hardy, B., Bindraban, P.
S., Tuong, T. P., Ladha, J. K. (Eds.),
Water-Wise
Rice
Production.
Proceedings of the International
Workshop on Water Wise Rice
Production, 8–11 April. International
Rice Research Institute (pp. 143- 154),
Los Banos, Philippines.
Yadav, V.K. 2007. Studies on the effect of
dates of planting, plant geometry and
number of seedlings per hill in hybrid
rice (Oryza sativa l.). Ph D Thesis.
Chandra Shekhar Azad University of
Agriculture and Technology, Kanpur208 002 (U.P.) India.
Yoshida, S. 1981. Fundamentals of rice crop
science. International Rice Research
Institute, Los Banos, Phillipines. 269.
How to cite this article:
Swarna, R., P. Leela Rani, G. Sreenivas, D. Raji Reddy and Madhavi, A. 2017. Growth
Performance and Radiation Use Efficiency of Transplanted Rice under Varied Plant Densities
and Nitrogen Levels. Int.J.Curr.Microbiol.App.Sci. 6(5): 1429-1437.
doi: />
1437