A study of customers’ satisfaction with Korean dramas in Vietnam
Bạn đang xem bản rút gọn của tài liệu. Xem và tải ngay bản đầy đủ của tài liệu tại đây (468.09 KB, 13 trang )
VNU Journal of Science: Economics and Business, Vol. 35, No. 5E (2019) 38-50
Original Article
A Study of Customers’ Satisfaction with
Korean Dramas in Vietnam
Nguyen Hoang Anh*, Nguyen Thi Nguyet Ha
Foreign Trade University, 91 Lang Thuong, Dong Da, Hanoi, Vietnam
Received 06 September 2019
Revised 20 December 2019; Accepted 26 December 2019
Abstract: Along with the spread of the Korean wave (Hallyu) since the 1990s, Korean dramas
have become popular worldwide and became a global phenomenon. Entering the Vietnamese
market from 1996, Korean dramas have been successful in both attracting audiences’ interest and
filmmakers’ attention. In order to find out the reasons behind the success of Korean films this
paper explored the factors affecting Vietnamese customers’ satisfaction with Korean TV dramas.
Based on the research of factors affecting customer satisfaction by different authors such as Philip
Kotler, Oliver, McColl and Truong, the authors have built up a model to explore audience
satisfaction with TV drama using 4 factors: actor (regarding popularity and appearance), script,
music, and cultural images. To empirically test the hypotheses, 226 responses have been collected
through an online questionnaire from November - December 2018 and tested by various statistical
analyses, such as factor analysis, regression analysis, and ANOVA.
The findings have indicated that script, music, cultural images have a correlation with Vietnamese
viewers’ satisfaction with Korean dramas while actors do not affect the overall satisfaction. Based
on the findings,the authors provide implications and offer suggestions to Vietnamese filmmakers
on improving customer satisfaction, thereby contributing to the development of TV drama
production in Vietnam.
Keywords: Korean drama, Korean wave (Hallyu), TV series, customer satisfaction, Vietnam.
1. Introduction*
development policies, South Korea today is
known to the world as not only one of the most
developed economies but also the leading
nation in exporting culture. The Korean wave
(Hallyu), referring to the rise in the global
popularity of South Korean culture since the
1990s, mainly driven by the widespread of
K-dramas and K-pop, have become a popular
phenomenon over the world. The best known
K-dramas (Television series made in South
In the 1960s, South Korea was one of the
poorest countries in the world and was virtually
unknown in the global film industry. However,
thanks to the strong will and appropriate
_______
* Corresponding
author.
E-mail address:
/>
38
N.H. Anh, N.T.N. Ha / VNU Journal of Science: Economics and Business, Vol. 35, No. 5E (2019) 38-50
Korea) such as “Winter Sonata”, “Jewel in the
Palace”1, or “Boys over Flowers” have
pioneered
the
Hallyu
and
achieved
unprecedented worldwide recognition [1].
39
The interest in Korean culture has
developed so rapidly in Asia that Korean films
and television series have become a staple for
viewers in the region.
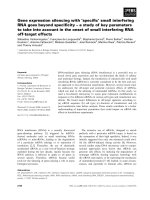
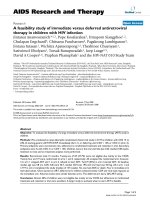
Figure 1. Export value of Korean dramas to the world (2007-2017).
Unit: 1.000 USD
Source: Compiled from the broadcasting industry survey report 2008-2018,
Korea communications commission & ministry of science and KT [2].
Over a decade, Korean drama exports have
grown sharply from US $ 79,951.1 in 2003 to
US $ 109,449 in 2013. This rapid growth is the
result of the Korean phenomenon, or m more
accurately, the Korean government’s policy of
cultural development and cultural export. In
particular, the film industry is put at a key
position. This is the foundation for the
appearance of many talented directors as well
as excellent film works As a result, Korean
films in general and dramas in particular
quickly established their firm position,
conquering both domestic and foreign markets.
The wave of Korean dramas has entered in
East Asia with a focus on Japan and China then
spread throughout Asia. After a decade, the
Korean dramas have never seemed to lose its
influence in this area.
Table 1. The situation of exporting Korean dramas in Asia in 2017
Unit: 1,000 USD
Country
Japan
Taiwan
Vietnam
Episodes
93,763
4,445
2,532
Export Value
45,540
21,672
4,425.0
Average price/series
0.49
4.88
1.75
Ratio (%)
36.60
17.42
3.56
China
268
3,786
14.13
3.04
Thailand
1,998
2,224
1.11
1.79
Campuchia
560
474
0.85
0.38
Myanmar
2,740
1,270
0.46
1.02
The world
137,774
124,410
0.90
100
Source: Compiled from 2018 television industry survey, Korea broadcasting institute.1
j
_______
1
A 2003 Korean drama first aired on MBC and one of the 10th highest rated Korean dramas of all time, known in Vietnam as
“Nàng Dae Jang Geum”.
40
N.H. Anh, N.T.N. Ha / VNU Journal of Science: Economics and Business, Vol. 35, No. 5E (2019) 38-50
2. Literature review
2.1. Customer satisfaction
Kotler (2000) defines satisfaction as “a
person’s feelings of pleasure or disappointment
resulting from comparing a product’s perceived
performance (or outcome) in relation to his or
her expectations” [3].
According to Hansemark and Albinsson
(2004), “satisfaction is an overall customer
attitude towards a service provider, or an
emotional reaction to the difference between
what customers anticipate and what they
receive, regarding the fulfillment of some need,
goal or desire” [4].
Expectations here can be understood as
what customers want and anticipate. It is based
on personal needs, shopping experiences,
feedback from relatives, friends, colleagues or
advertised information from the sellers.
Based on the above definition, it can be
understood that customer satisfaction is a threestage process: (1) First, when the demand
arises, customers form thoughts of how the
demand is met to solve existing problems and
form expectations about the quality that
products/services can bring to them. (2) After
that, the process of buying and using
products/services
would
contribute
to
customers’ beliefs about the real effectiveness
of the goods. (3) Finally, customer satisfaction
is the result of comparing what they expected
before purchasing goods with what they
received after use.
In summary, a customer’s level of
satisfaction depends on the difference
between the received results and his/her
expectations. This is classified into three (3)
levels. If the actual result is lower than
expected, the customer is not satisfied. If the
actual result is commensurate with the
expectations, the customer is satisfied. If the
actual result is beyond expectations, the
customer is very satisfied.
Customer satisfaction plays a vital role in
the success of any business. The more
competitive the environment is, the more
constantly business owners should strive to
bring great customers’ experience in order to
maintain a strong and healthy customer-supplier
bonding. Customer satisfaction, therefore, is the
key to purchase intentions and customer
loyalty, because satisfaction creates customer
loyalty. Oliver’s study (1980) stated that a high
level of customer satisfaction leads to greater
loyalty. Satisfaction also promotes positive
word of mouth as highly satisfied customers
are likely to recommend products/ services or
share about the positive experience they have
with
the
people
they
know
[5].
Furthermore, satisfaction reduces the cost for
businesses. Reichheld and Teal (2001) argues
that assessing satisfaction is an effective tool to
achieve strategic goals, such as customer
retention which directly affects profit [6]. This
should be taken into account because the cost to
retain existing customers is less than the cost to
acquire new customers. At the same time,
businesses also spend less to serve an existing
customer than a new one. Overall, satisfaction
can improve business efficiency as satisfied
customers are willing to purchase products at
higher prices, and thus increase profits. Price is
an important factor in the profit equation and is
directly related to profitability [7]. If the price is
not much higher than the average market price,
customer satisfaction will bring a competitive
advantage to the business.
2.2. Determinants of customer satisfaction with
television drama
Television drama is a special product because
it combines both tangible and intangible elements;
therefore, the influencing factors of customer
satisfaction are not only limited to the drama itself
but they also involve external elements such as
the drama service providers or the viewing
environment. For example, unstable Internet
connection, incorrect subtitles, local voice-overs
or too many advertisements during broadcast time
can sometimes have a substantial negative effect
on customer satisfaction.
However, within the scope of this research,
we decided to investigate only internal factors
N.H. Anh, N.T.N. Ha / VNU Journal of Science: Economics and Business, Vol. 35, No. 5E (2019) 38-50
that directly influence the quality of a drama.
Based on previous researches on films and
dramas, together with our own arguments, the
audience satisfaction with a drama can be
influenced by the following factors:
2.2.1. Actors
Appearance
McColl and Truong (2013) claim that
charisma and flawless looks have a positive
influence on the audience [8]. Hogarth (2013)
points out that the fact that Korean stars have
good looks, nice costumes, and makeup styles
in the film makes the audience feel attracted
[9]. The actors are the representatives of the
whole drama where they transform into
imaginary characters to express the characters’
personalities and emotions. Among a huge
number of TV dramas, looks/visuals can
become a unique selling point in the audience’s
drama selection process. In addition to content,
the number of people who watch dramas due to
handsome actors or fashionable trends is
significant. Actors or the characters they play in
a TV series are likely to become a fashion icon
for audiences, especially women.
Reputation
Some studies have shown the influence of
celebrities on consumers’ attitude and behavior.
According to Lee (2015), the personal
attractiveness and reputation of Korean stars get
many Asian consumers in front of the
television; as a result, their reputation is proved
to affect satisfaction [10]. Their personal
reputation is considered to be able to bring in
more viewers because fans often have a positive
attitude when it comes to their stars or idols. As
a result, satisfaction with the drama would
increase because the audience feels connected
with their idols.
2.2.2. Script
Yang and Zhong (2016) proved that moral
education and plot have an influence on film
attractiveness [11]. In particular, mind
purification and inspiration belong to the moral
education aspect; meanwhile, plot refers to the
logic of the film. It can be said that the audience
sees the film with both their heart and brain, for
that reason, to really improve their satisfaction,
41
a film must satisfy them both emotionally and
rationally. In addition, audience satisfaction is
determined primarily through subjective
feelings perceived by the heart and soul, rather
than external effects.
This proves that most audiences appreciate
inspirational life lessons in a film. This can also
apply to a drama series. Humane values in a
drama are reflected in the ability to reflect slices
of life and spread meaningful messages. A TV
series that can convey deep meaning, arouse
good spiritual values, inspire and motivate
self-improvement will surely be relatable,
and therefore, has a higher possibility to
satisfy viewers.
Additionally, viewers also evaluate a film
through the logic of the plot - whether a
problem is raised and solved reasonably and
persuasively. Especially for a drama, it is the
logic that draws viewers from one episode to
another and keeps them engaged until the end.
Any details which do not make sense or cause
confusion can lead to negative reactions from
the audience.
Nevertheless, the appeal of a drama also
lies in unexpected plot twists. The climax, if
successfully exploited, can immensely boost
viewer satisfaction level. This can be easily
seen when a dramatic scene or episode in a
series often has a higher rating than the rest.
2.2.3. Cultural image
The definition of “culture” varies greatly
depending on the field of study, however,
“culture” in our study includes non-material
aspects such as languages, ideas, values and
material aspects such as houses, clothing,
vehicles, etc.
Cultural values were built into viewers’
mind through images of objects, human beings
and even advertisements appearing in the film.
For example, Mercedes Benz partially reflects
German culture through features such as high
quality, safety, high technology, and good
organization. In the case of drama, audiences
have access to the culture of the country of
origin and get a feel of the daily life of the local
people through the way they think, dress or
behave. In addition, how the people in the
42
N.H. Anh, N.T.N. Ha / VNU Journal of Science: Economics and Business, Vol. 35, No. 5E (2019) 38-50
drama behave and treat one another provides
viewers with access to cultural perspectives on
relationships or values appreciated in society.
From this, viewers can see the differences and
similarities with their own cultures or countries.
Furthermore, watching dramas also
encourages viewers to learn about other
cultures. The feeling of this new experience
makes viewers excited to discover more.
According to Bae and Lee (2004), the phrase
“Entertainment - Education” refers to the
influence of media broadcast on the change in
individual behavior as well as on social change
[12]. Hasegawa’s study (2005) conducted an
interview with 58 Japanese audiences and
showed that through watching dramas, viewers
discovered similarities as well as differences
between Japan and Korea [13]. From that, they
developed a good impression towards Koreans
and South Korea in general. Besides, the
psychological distance with Koreans was also
narrowed and Japanese viewers even became
interested in Korean culture, history, and
Japan-Korea relations.
Thus, in addition to cognitive effects,
dramas also have an influence on hobbies,
lifestyle or even one’s viewpoint. If viewers
perceive the change to be positive, their
overall satisfaction with the drama may
increasingly improve.
2.2.4. Music
Music can serve several purposes that are
either supportive of the emotional side of the
TV series or help enhance the storytelling. It is
not only helpful but essential for any producer
to keep the music in mind when planning and
shooting a drama. Thanks to soundtracks,
emotional states and lives of the characters
become more lively, realistic and deeply
connecting for the viewers.
According to Ball, author of The Music
Instinct (2012), soundtracks can produce the
same reaction in us whether the music is good
or bad [14]. “Film composers know that and use
it to shortcut the logical part of our brain and
get straight to the emotional centres”. Kracauer
(1960) points out the if there was no music, the
scenes would lose its vitality [15].
Cohen (1999) identified eight functions of
film music: contributing to the narrative's
continuity, the emotional meaning of events,
induction of mood, creation, activation of
memory, maintenance of arousal, global
attention, associated sense of reality, and
finally, aesthetic experience [16].
In many cases, the music becomes the
characters’ second voice, effectively replacing
lines. This is especially true to any TV series
due to their long story with more dramatic
twists and emotional highlights. Without music,
romantic scenes would be dry while action
scenes may become less dramatic, and
therefore, easily fade away. Indeed, both visual
and sound elements can exist independently,
but their combination is indisputably
harmonious. A drama series appears more
beautiful, more emotional, and more multidimensional thanks to the music. On the other
hand, the music becomes more vivid and
symbolic thanks to the visual illustration of the
drama. Music itself has the ability to awaken
viewers’ senses, allowing the brain to reproduce
impressive scenes.
3. Methodology
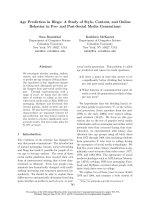
3.1. Research model and hypothesis
Based on the analysis above, the research
model was as follows:
According to the model, we made the
following hypotheses:
Hypothesis H1: The perception of actors is
positively related to customer satisfaction
with dramas.
Hypothesis H2: The perception of script is
positively related to customer satisfaction
with dramas.
Hypothesis H3: The perception of music is
positively related to customer satisfaction
with dramas.
Hypothesis H4: The perception of cultural
images is positively related to customer
satisfaction with dramas.
g
N.H. Anh, N.T.N. Ha / VNU Journal of Science: Economics and Business, Vol. 35, No. 5E (2019) 38-50
43
u
Actors
(Look, Reputation)
Script
(Moral values, Plot)
Cultural images
(Material, Non-material)
Customer satisfaction
Music
Figure 1. Model of customer consumer satisfaction with dramas.
3.2. Measurement instruments
Based on the research model, we designed a
detailed questionnaire with 35 questions,
divided into 3 parts:
Part I (5 questions): Basic information
about survey participants: gender, age,
educational level, occupation and place of
residence.
Part II (6 questions): Information about
habits and interests in watching Korean dramas
such as frequency, time, channels, reasons for
liking/disliking Korean dramas.
Part III (24 questions): There were 15
quantitative questions related to 4 factors
affecting customer satisfaction and 3 questions
about overall satisfaction level with Korean
dramas. Questions were designed according to
the Likert scale with 5 levels:
1: Strongly disagree
2: Disagree
3: Neutral
4: Agree
5: Strongly agree
In addition to 18 quantitative questions,
there were 6 multiple choice questions about
favorite actors and favorite dramas based on 3
aspects: script, cultural images, and music. We
selected multiple choices based on the attraction
and popularity of Korean dramas in Vietnam,
thereby getting a better insight into the taste of
Vietnamese consumers.
The survey was conducted from
November 2018 to December 2018 by sharing
an online Google form questionnaire on the
authors’ personal Facebook of more than
50,000 followers and several drama-related
Facebook pages.
We collected a total of 226 samples, all of
which were valid. The collected data was
analyzed through the Statistical Package for
Social Scientists (SPSS 20.0) to test the scale
and the relevance of the theoretical model.
Specifically, we evaluated the reliability of the
scale through Cronbach’s Alpha, EFA, Pearson
correlation coefficient and regression analysis.
The determinants of consumer satisfaction
with drama were as follows:
- Actor: measured by 4 observed variables
from A1 to A4
- Script: measured by 4 observed variables
from S1 to S4
- Music: measured by 3 observed variables
from M1 to M3
44
N.H. Anh, N.T.N. Ha / VNU Journal of Science: Economics and Business, Vol. 35, No. 5E (2019) 38-50
Cronbach’s Alpha is greater than 0.6 (Nunnally
and Bernstein, 1994).
- Cultural image: measured by 4 observed
variables from C1 to C4
These scales would be verified through
Cronbach’s Alpha coefficient to remove
irrelevant variables. The variable whose
corrected item-total correlation is less than 0.3
will be eliminated. The scale is selected when
3.3. Sampling and data analysis
The research sample could be described
as following:
Table 3. Sample’s characteristics by criteria
Age
Gender
57
< 21
18
Male
(25.2%)
Occupation
3
3
High school
(8.0%)
119
21-30
Education level
Businessman
(1.3%)
(1.3%)
207
University/
185
Teacher/
2
(91.6%)
College
(81.9%)
Professor
(0.9%)
1
Graduate
school
38
Female
(52.7%)
25
31-40
Other
(11.1%)
(0.4%)
(16.8%)
(7.5%)
Da
Nang
4
13
(5.8%)
Office
worker
(0.9%)
(1.8%)
193
(50.9%)
(3.5%)
17
2
Ha Noi
Freelancer
51-60
Bac
Giang
115
Student
8
41-50
Place
(85.4%)
Ho Chi
Minh
92
13
(5.8%)
1
Lao Cai
(40.7%)
(0.4%)
1
Seoul
10
(0.4%)
(Korea)
(4.4%)
Soc
Trang
1
Thai
Binh
1
Vinh
Phuc
1
Homemaker
Total
Out of 226 respondents, 91.6% were female
and only 0.4% were male. Regarding the age,
25.2% were under 21; 57.7% were between the
ages of 21-30; 11.1% were in the 31-40 age
group; 3.5% were in the age group 41-50, and
about 7.5% were more than 51 years old.
Regarding education level, the majority were
University/College students and Graduate school
students, accounting for 81,9% and 16,8%,
respectively; and high school students followed
with only 1.3%. In terms of occupation, 50.9% of
the survey participants were students while 40.7%
(0.4%)
(0.4%)
(0.4%)
226 (100%)
were office workers. Meanwhile, the percentages
of
freelancers,
businessmen,
teachers,
homemakers were 5.8%, 1.3%, 0.9% and 0.4%,
respectively. Regarding living places, people
living in Hanoi accounted for the highest
proportion with 85.4%. The rest was distributed
into other options with a considerably low ratio.
In summary, the representative sample for
Vietnamese consumers was female with a
relatively high educational level, aged from 18-30
years old, living in Hanoi, and most were students
and office workers.
N.H. Anh, N.T.N. Ha / VNU Journal of Science: Economics and Business, Vol. 35, No. 5E (2019) 38-50
45
Table 4. Cronbach’s Alpha output
No.
1
2
3
4
5
Variable
Scale mean if
item deleted
Cronbach’s Alpha if
item deleted
A1
A2
A3
A4
10,97
11,02
12,21
11,78
0,591
0,600
0,615
0,668
S1
S2
S3
S4
10,26
10,45
10,44
10,38
M1
M2
M3
8,15
8,14
8,28
C1
C2
C3
C4
11,73
12,00
12,27
11,91
OS1
OS2
OS3
7,92
7,69
7,75
Scale variance if
Corrected item-total
item deleted
correlation
Actor (Cronbach’s Alpha = 0,682)
5,030
0,532
4,991
0,506
4,397
0,466
3,986
0,423
Script (Cronbach’s Alpha = 0,847)
5,696
0,721
5,413
0,711
5,679
0,672
5,322
0,644
Music (Cronbach’s Alpha = 0,763)
2,827
0,633
2,887
0,624
2,398
0,555
Cultural image (Cronbach’s Alpha = 0,848)
5,178
0,715
4,680
0,717
4,849
0,692
4,801
0,636
Overall satisfaction (Cronbach’s Alpha = 0,9)
3,740
0,760
3,191
0,830
3,183
0,822
In the first analysis, Cronbach’s Alpha
coefficients of all scales were greater than 0.6.
Also, the corrected item-total correlation
coefficients of all observed variables were
greater than 0.3. Therefore, all observed
variables were accepted and used for further
analysis. This output of Cronbach’s Alpha test
showed that all 18 observed variables were
satisfactory to be tested in the Exploratory
Factor Analysis (EFA).
0,792
0,794
0,811
0,827
0,647
0,658
0,753
0,800
0,794
0,805
0,832
0,893
0,832
0,839
3.4. Analyzing exploratory factor
As shown in Table 5, all criteria were
satisfied when compared to the conditions,
which proved that the data used for factor
analysis was perfectly relevant.
It can be seen that all 15 observed variables
had factor loading greater than 0.5 and were
divided into 4 components as the initial scales.
Table 5. EFA output for the independent variables
Criterion
Result
In comparison with
the condition
Sig. in Bartlett test
0,000
0,000 < 0,05
KMO coefficient
0,849
0,5 < 0,849 < 1
Cumulative of
Variance
66,277%
66,277% > 50%
Eigenvalues
1,184
1,184 > 1
46
N.H. Anh, N.T.N. Ha / VNU Journal of Science: Economics and Business, Vol. 35, No. 5E (2019) 38-50
;
Table 6. Rotated component matrix
Component
Script
Culture images
Drama music
Actors
Component
1
2
.788
.783
.760
.750
.803
.791
.743
.687
Variable
S3
S1
S4
S2
C3
C2
C1
C4
M1
M3
M2
A1
A3
A2
A4
3
4
.773
.759
.756
.740
.718
.701
.611
Table 7. EFA for the dependent variable
Criterion
Result
Sig. in Bartlett test
KMO coefficient
0,000
0,742
In comparison with
the condition
0,000 < 0,05
0,5 < 0,742 < 1
Cumulative of Variance
83,381%
83,381% > 50%
Eigenvalues
2,501
2,501 > 1
According to the above table, all of the
coefficients satisfied conditions in the EFA.
After the EFA, 4 factors that would continue to
be tested in the model were Actors (A), Script
(S), Music (M) and Cultural images (C). The
value of each component was the average of its
observed variables (Table 8).
Pearson correlation coefficient between
“Overall satisfaction” and “Actors”, “Script”,
“Music”, “Cultural images” was 0.427, 0.634;
0.591; 0.606, respectively. In addition, the sig
values were equal to 0, less than 0.05.
Therefore, all pairs of variables were correlated,
and Pearson coefficients were statistically
significant.
3.5. Testing research hypotheses
Testing the relevance of the model (Table 9):
Table 8. Correlation output
Actors
Script
Pearson
Correlation
Sig. (2-tailed)
Pearson
Correlation
Sig. (2-tailed)
Actors
Script
Music
Cultural
images
Overall
satisfaction
1
0,382**
0,397**
0,408**
0,427**
0,000
0,000
0,000
0,000
1
0,406**
0,564**
0,634**
0,000
0,000
0,000
0,382**
0,000
N.H. Anh, N.T.N. Ha / VNU Journal of Science: Economics and Business, Vol. 35, No. 5E (2019) 38-50
Music
Cultural
images
Overall
satisfacti
on
Pearson
Correlation
Sig. (2-tailed)
Pearson
Correlation
Sig. (2-tailed)
Pearson
Correlation
Sig. (2-tailed)
0,397**
0,406**
0,000
0,000
0,408**
0,564**
0,492**
0,000
0,000
0,000
0,427**
0,634**
0,591**
0,606**
0,000
0,000
0,000
0,000
1
0,492**
0,591**
0,000
0,000
1
0,606**
47
0,000
1
Table 9. Model summary
Model
R
R2
Adjusted R2
1
0,758
0,574
0,566
Std. Error of
the Estimate
0,58999
R2 coefficient reflects dependent variables’
variation explained by independent variables. In
this study, the adjusted R2 coefficient was used
to assess more closely the relevance of the
multivariate linear regression model. The result
revealed that the adjusted R2 coefficient was
Durbin-Watson
2.110
56.6%, which meant 56.6% of the variation of
the “Satisfaction” variable was explained by the
independent variables; the remaining 43.4%
was due to errors, including measurement errors
and the effect of other variables outside
the model.
Table 10. ANOVA
1
Model
Regression
Residual
Total
Sum of Squares
103,636
76,926
180,562
df
4
221
225
The F-test used in the variance analysis was
to test the hypotheses about the relevance of the
overall linear regression model. As results of
Mean Square
25,909
0,348
F
74,434
Sig.
0,000
ANOVA analysis showed that Sig = 0.000, the
regression model of the study was appropriate.
Testing research hypotheses:
Table 11. Coefficients
Unstandardized
Coefficients
Standardized
Coefficients
B
Std. Error
Beta
Constant
-0,495
0,279
A
0,104
0,066
S
0,414
M
C
Model
1
t
Sig.
Collinearity Statistics
Tolerance
VIF
-1,777
0,077
0,079
1,565
0,119
0,761
1,314
0,064
0,353
6,438
0,000
0,642
1,558
0,352
0,061
0,306
5,821
0,000
0,698
1,432
0,280
0,072
0,224
3,898
0,000
0,582
1,719
d
The regression coefficients are divided into
two kinds: (1) unstandardized estimates and (2)
standardized estimates. With the unstandardized
regression coefficients (the symbol is B in
SPSS), their value depends on the scale,
therefore, it is not used to compare the
influence of independent variables on the
dependent variable in a model. Standardized
N.H. Anh, N.T.N. Ha / VNU Journal of Science: Economics and Business, Vol. 35, No. 5E (2019) 38-50
48
regression coefficients (the symbol is Beta in
SPSS) are standardized coefficients that should
be used to evaluate the relationship
among variables.
The variance inflation factors (VIF) of all
variables were less than 2, which confirmed that
there was no multicollinearity phenomenon.
The study used a significance level of 5% to
test hypotheses in correlation and regression
analysis. The regression result showed that the
Beta coefficient of the “Actors” variable was
0.079 with a sig value of 1.119 > 0.05. This
meant that overall satisfaction with Korean
dramas was not proved to be affected by actors
in this study. Meanwhile, the sig value of each
of the remaining variable was equal to 0,000 <
0.05, indicating that these variables had
an influence on viewer satisfaction with
Korean dramas.
Thus, among 4 independent variables
included in the initial regression model, there
were 3 variables positively related to the
dependent variable. Standardized regression
equation of the model was as follows:
OS = 0,353 S + 0,306 M + 0,224 C
Table 12. Result of testing hypotheses
Hypothesis
H1: The perception of actors is positively related to
customer satisfaction with dramas.
H2: The perception of script is positively related to
customer satisfaction with dramas.
H3: The perception of music is positively related to
customer satisfaction with dramas.
H4: The perception of cultural images is positively
related to customer satisfaction with dramas.
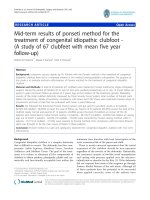
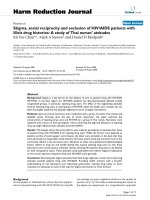
From the hypotheses and data analysis, the
final research model was summarized
as Figure 2.
To summarize, the study determined 3
factors influencing the satisfaction of
Vietnamese consumers with Korean dramas.
They are “Script”, “Music” and “Cultural
images”. Only the “Actors” variable was
eliminated from the model.
Result
Beta
Reject
0,079
Sig
0,119
Accept
0,353
0,000
Accept
0,306
0,000
Accept
0,224
0,000
In particular, “Script” with the Beta
coefficient = 0.353 is the most influential factor in
Vietnamese consumers’ satisfaction (Figure 2).
Ceteris paribus, if the perception of the script
increases by 1 unit, then the overall satisfaction
with the drama increases by 0.353 units. In
addition, according to the survey result,
Vietnamese viewers agreed that “Reply 1988”2.
was the best script among many Korean dramas.
Figure 2. The result of the research model
Script
(Moral values, Plot)
Cultural images
(Material, Non-material)
Music
0,353
0,224
Vietnamese viewer satisfaction
0,306
Figure 2. The result of the research model.2
_______
2
A South Korean TV series first broadcasted from November 6th, 2015 on tvN. It has become the second highest rated drama
in Korean cable TV history until now.
N.H. Anh, N.T.N. Ha / VNU Journal of Science: Economics and Business, Vol. 35, No. 5E (2019) 38-50
49
h
Indeed, during the broadcast of “Reply
1988”, the audience was looking forward to
each episode and made a lot of predictions
about the ending. An intriguing, touching and
flexible script was undeniably one of the key
factors that have kept the audience engaged and
created a resounding success for the series.
With creativity and perseverance, “Reply 1988”
filmmakers managed to bring the audience back
to the past with nostalgic scenes and old music.
With Beta = 0.306, the second most
important factor is “Music”. Ceteris paribus, if
the perception of drama music increases by
1 unit, the satisfaction increases by 0.306 units.
Besides, the survey data pointed out that the
most popular drama music belonged to
“Descendants of the Sun”3. In fact, according to
The Korean Times, the soundtrack of the series
swept the top spots in major local music charts
such as MelOn, Genie Music, Naver Music,
Bugs Music, Monkey3 and Soribada [17]. In
addition, The Korea Herald reported that
preorders for the soundtrack album surpassed
the 10,000 mark on March 18th, 2016, and
according to Yonhap News, the original
soundtrack eventually sold over 60,000 copies
[18]. The soundtrack of “Descendants of the
Sun” has complemented the drama perfectly
and contributed to its popularity worldwide.
Next, “Cultural images”, whose Beta was
0.024, is the least influential factor in the
overall satisfaction. Ceteris paribus, if the
perception of cultural images increases by 1
point, the satisfaction with the drama also
increases by 0.224 points. The survey result
indicated that the audience enjoyed the cultural
images in “Jewel in the Palace” most. For
example, the drama rekindled public interest in
traditional Korean cuisine, both locally and
abroad. “Jewel in the Palace” showcases the
period detail of Joseon gastronomic culture,
giving international prominence to Korean
cuisine and culture. As one of the pioneers of
_______
3
A South Korean soap opera first aired from February
24th, 2016 on KBS 2. The series was a major hit
worldwide, winning the Grand Prize in television at the
52nd Baeksang Arts Awards.
Korean waves, the drama has been exported to
over 90 countries and greatly contributed to
improving Korea’s image worldwide.
Although in this study, actors (regarding
their popularity and appearance) are not proved
to affect the satisfaction of Vietnamese viewers.
However, this element is undeniably one of the
outstanding strengths of K-dramas. The survey
data showed that actress Song Hye Kyo4 and
actor Song Joong Ki5 were loved the most. The
success of “Descendants of the Sun” in 2016 is
the most obvious evidence for the attraction of
the couple, reestablishing both of them as a
leader of the Hallyu. Even before “Descendants
of the Sun” was aired, the cooperation between
Song Hye Kyo and Song Joong Ki had drawn a
great deal of attention and had been highly
anticipated among citizens. Later, both Song
Hye Kyo and Song Joong Ki topped popularity
polls in Asia and won Daesang (Grand Prize),
the highest award at the 2016 KBS
Drama Awards.
References
[1] H. Han, S. Lee, “A Study on the KBS TV Drama
Winter Sonata and its Impact on Korea’s Hallyu
Tourism Development”, Journal of Travel &
Tourism Marketing 24 (2010) 115-126.
[2] Korea Communications Commission and Ministry
of Science and KT (2013-2018).
[3] P. Kotler, Marketing Management, 10th edn., New
Jersey, Prentice-Hall, 2000.
[4] O. Hansemark, M. Albinsson, “Customer
satisfaction and retention: The experiences of
individual employees”, Managing Service Quality:
An International Journal 14(1) (2004) 40-57.
[5] R.L. Oliver, Satisfaction: A Behavioral Perspective
on the Consumer, McGraw Hill, 1997.
[6] F. Reichheld, T. Teal, The loyalty effect, Boston,
Mass.: Harvard business school Press, 2001.
_______
4
Song Hye Kyo (born in 1981): A top South Korean
actress starring in many famous dramas such as “Autumn
in My Heart” (2000), “Full House” (2004), “That winter,
the Wind Blows” (2013).
5 Song Joong Ki (born in 1985): A South Korean actor
starring in the movie “A Werewolf Boy” (2012) and the
hit drama “Descendants of the Sun” which bolstered his
status as a top Hallyu star.
50
N.H. Anh, N.T.N. Ha / VNU Journal of Science: Economics and Business, Vol. 35, No. 5E (2019) 38-50
[7] C. Homburg, N. Koschate, W. Hoyer, “Do
Satisfied Customers Really Pay More? A Study of
the Relationship between Customer Satisfaction
and Willingness to Pay”, Journal of Marketing,
69(2) (2005) 84-96.
[8] R. McColl, Y. Truong, “The Effects of Facial
Attractiveness and Gender on Customer
Evaluations during a Web-Video Sales
Encounter”, Journal of Personal Selling & Sales
Management 33(1) (2013) 117-128.
[9] H. Hogarth, “The Korean Wave: An Asian
Reaction to Western-Dominated Globalization”,
Perspectives on Global Development and
Technology 12(1-2) (2013) 135-151.
[10] W. Lee, “The Effects of the Korean Wave
(Hallyu) Star and Receiver Characteristics on T.V
Drama
Satisfaction
and
Intention
to
Revisit”, International Journal of u- and e-Service,
Science and Technology 8(11) (2015) 347-356.
[11] D. Yang, X. Zhong, “The Perception of Film
Attractiveness and Its Effect on the Audience
Satisfaction, Intention and Investment”, Journal of
Service Science and Management 09(01) (2016)
21-27.
[12] H. Bae, B. Lee, “Audience involvement and its
antecedents: An analysis of the electronic bulletin
J
j
[13]
[14]
[15]
[16]
[17]
[18]
board messages about an entertainment-education
drama on divorce in Korea”, Asian Journal of
Communication 14(1) (2004) 6-21.
Hasegawa, Noriko, A Quantitative Analysis of
Japanese Images of Korea: Perceptual Changes
Brought about by TV Drama Viewing, 2006.
P. Ball, Music instinct, Oxford: Oxford University
Press, 2012.
S. Kracauer, Theory of film - The redemption of
physical reality, Oxford, UK, Oxford University
Press, 1960.
A.J. Cohen, The functions of music in
multimedia: A cognitive approach, In Music,
mind, and science, Seoul, Korea: Seoul National
University Press, 1999, pp.53-99.
The Korean Times, Songs from “Descendants of the
Sun” soundtrack rule music chart, Korea, 8 March.
/>98_199858.html/, 2016 (accessed 30 June 2019).
The Korea Herald, Preorders surge for
“Descendants of the Sun” soundtrack, Korea, 23
March.n />=20160323000329&ACE_SEARCH=1/,
2016
(accessed 30 June 2019).