Burkitt lymphoma beyond MYC translocation: N-MYC and DNA methyltransferases dysregulation
Bạn đang xem bản rút gọn của tài liệu. Xem và tải ngay bản đầy đủ của tài liệu tại đây (3.87 MB, 13 trang )
De Falco et al. BMC Cancer (2015) 15:668
DOI 10.1186/s12885-015-1661-7
RESEARCH ARTICLE
Open Access
Burkitt lymphoma beyond MYC translocation:
N-MYC and DNA methyltransferases dysregulation
Giulia De Falco1,2, Maria Raffaella Ambrosio1, Fabio Fuligni3, Anna Onnis1, Cristiana Bellan1, Bruno Jim Rocca1,
Mohsen Navari3, Maryam Etebari3, Lucia Mundo1, Sara Gazaneo1, Fabio Facchetti4, Stefano A. Pileri3,
Lorenzo Leoncini1*† and Pier Paolo Piccaluga3†
Abstract
Background: The oncogenic transcription factor MYC is pathologically activated in many human malignancies. A
paradigm for MYC dysregulation is offered by Burkitt lymphoma, where chromosomal translocations leading to
Immunoglobulin gene-MYC fusion are the crucial initiating oncogenic events. However, Burkitt lymphoma cases
with no detectable MYC rearrangement but maintaining MYC expression have been identified and alternative
mechanisms can be involved in MYC dysregulation in these cases.
Methods: We studied the microRNA profile of MYC translocation-positive and MYC translocation-negative Burkitt
lymphoma cases in order to uncover possible differences at the molecular level. Data was validated at the mRNA
and protein level by quantitative Real-Time polymerase chain reaction and immunohistochemistry, respectively.
Results: We identified four microRNAs differentially expressed between the two groups. The impact of these
microRNAs on the expression of selected genes was then investigated. Interestingly, in MYC translocation-negative
cases we found over-expression of DNA-methyl transferase family members, consistent to hypo-expression of the
hsa-miR-29 family. This finding suggests an alternative way for the activation of lymphomagenesis in these cases,
based on global changes in methylation landscape, aberrant DNA hypermethylation, lack of epigenetic control on
transcription of targeted genes, and increase of genomic instability. In addition, we observed an over-expression
of another MYC family gene member, MYCN that may therefore represent a cooperating mechanism of MYC in
driving the malignant transformation in those cases lacking an identifiable MYC translocation but expressing the
gene at the mRNA and protein levels.
Conclusions: Collectively, our results showed that MYC translocation-positive and MYC translocation-negative
Burkitt lymphoma cases are slightly different in terms of microRNA and gene expression. MYC translocationnegative Burkitt lymphoma, similarly to other aggressive B-cell non Hodgkin’s lymphomas, may represent a
model to understand the intricate molecular pathway responsible for MYC dysregulation in cancer.
Background
Burkitt lymphoma (BL) is a highly aggressive B-cell nonHodgkin lymphoma characterized by peculiar clinical,
morphological, immunophenotypical, cytogenetic, and
gene expression profile features [1]. The current World
Health Organization (WHO) classification of tumors of
hematopoietic and lymphoid tissue assesses that no single
parameter can be used as the gold standard to achieve the
* Correspondence:
†
Equal contributors
1
Department of Medical Biotechnologies, University of Siena, Italy - Via delle
Scotte, 6 - 53100 Siena, Italy
Full list of author information is available at the end of the article
diagnosis but that a combination of clinical, histological,
immunophenotypical and genetic criteria is necessary [1].
The presence of the MYC-associated translocation [t(8;14)
MYC/Immunoglobulin heavy chain gene (IGH)] or variants is necessary to confirm all but the most classic cases.
However, in the cases of otherwise typical BL, in which an
evident MYC translocation cannot be detected by the
standard procedures, the diagnosis of BL can still be made
[1]. Five to ten percent of BL cases show no translocation,
both by classical cytogenetics and molecular methods like
fluorescence in situ hybridization (FISH) analysis [2, 3].
This may be due to technical failure of FISH, as these cases
may present with a very small excision of MYC and
© 2015 De Falco et al. Open Access This article is distributed under the terms of the Creative Commons Attribution 4.0
International License ( which permits unrestricted use, distribution, and
reproduction in any medium, provided you give appropriate credit to the original author(s) and the source, provide a link to
the Creative Commons license, and indicate if changes were made. The Creative Commons Public Domain Dedication waiver
( applies to the data made available in this article, unless otherwise stated.
De Falco et al. BMC Cancer (2015) 15:668
insertion of the gene into one of the IG loci, which is
missed by the available probes [4]. Another option is that
the breakpoint is localized far outside the region covered
by the currently available FISH probes [4]. Even though
none of the techniques currently used to diagnose genetic
changes can unambiguously rule out all of MYC translocations [4], some observations suggest that mechanisms
other than translocation are responsible for elevated MYC
protein expression in BL even in the absence of genomic
rearrangements [5, 6]. Amplification, rearrangement or hypomethylation of the MYC oncogene are genetic alterations frequently occurring in many cancers, as carcinoma
of the cervix, colon, breast, lung and stomach [7–11], and
causing MYC to be activated and over-expressed. Previous
studies, by integrating structural and functional genomics
to catalogue the broad of somatic mutations in BL [12–14]
have found that the most mutated gene in BL is MYC itself
(70 % of cases approximately). Moreover, there is increasing evidence that MYC protein over-expression may occur
in tumors without apparent gene alterations [15] and it has
been suggested that a dysregulated expression of microRNAs (miRNAs) may represent one of the mechanisms
leading to MYC overexpression in BL cases lacking a classical MYC translocation, through either a direct or indirect
mechanism [5, 6]. In recent years, lymphoma studies have
uncovered various mechanisms by which miRNAs influence their target genes [16] and it has become clear that alterations in the expression of miRNAs contribute to the
pathogenesis of most, if not all, human malignancies [17].
All the mechanisms leading to MYC over-expression,
affect the expression of its downstream target genes that
are involved in various cellular processes such as cell
proliferation, cell growth, apoptosis, differentiation, and
stem-cell self-renewal, presumably through DNA overreplication [18]. In addition, MYC amplifies the existing
gene expression program and can also control global
chromatin structure by regulating histone acetylation [19].
Increasing information identifies other essential pathways
that are activated in the pathogenesis of BL and highlights
the fact that MYC translocation alone is insufficient to drive
lymphomagenesis. Therefore BL cases lacking the typical
MYC translocation, but expressing MYC at the protein level,
may represent a good model for a more detailed description
of MYC regulation. In this paper we investigated the microRNA profile of MYC translocation-positive and MYC
translocation-negative BL cases in order to uncover possible
differences at the molecular level. We found that MYC
translocation-positive and -negative BL cases are slightly different in terms of microRNA and gene expression, and we
validated our findings at the mRNA and protein levels. Interestingly, in MYC translocation-negative BLs we found overexpression of DNA methyltransferase (DNMT) family members, consistent to hypo-expression of hsa-miR-29 family.
This finding suggests an alternative way for the activation of
Page 2 of 13
lymphomagenesis in these cases, based on global changes in
methylation landscape, aberrant DNA hypermethylation,
lack of epigenetic control on transcription of targeted genes,
and increase of genomic instability. In addition, we observed
the over-expression of another MYC family gene member,
MYCN that may therefore represent an additional mechanism for malignant transformation.
Our findings may be helpful to explain the pathogenetic mechanisms of tumors in which overexpression of
MYC is independent of a chromosomal translocation or
a gene amplification.
Methods
Ethics
This study was approved by the ethics committee of the
University of Siena, Italy and of Lacor Hospital, Uganda.
Study participants or their legal guardians provided
written informed consent.
Case selection
109 Burkitt lymphoma cases, enrolled in the International
Network for Cancer Treatment and Research (INCTR)
study on African BL, were used for this study. All cases
were recorded in childhood and diagnosed as BL by an expert panel on histological slides stained with Haematoxylin
and Eosin (H&E) and Giemsa, and by immunophenotyping, according to the WHO classification [1, 20]. Ten cases
did not show the typical t(8;14), t(8;2) and t(8;22) MYCtranslocations at FISH analysis (MYC translocation negative in the following) by using both dual-fusion probes and
split-signal probes for IGH and Immunoglobulin light chain
gene (IGL) loci as well as an LSI IGH/MYC CEP 8 Tricolor dual-fusion probe (Vysis, Abbott Molecular IL, USA).
FISH analysis using BCL2 and BCL6 probes was also negative. All cases were otherwise completely typical in term of
clinical presentation (age: median 7, range 4–10; female/
male ratio: 4/6; nodal/extra-nodal ratio: 2/8), morphology
and immunophenotype (CD10+, BCL6+, BCL2-, CD38+,
CD44-, Ki-67 100 %) to make a diagnosis of BL.
The analysis of the EBV status was performed by in
situ hybridization for EBV-encoded RNA (EBER) as previously reported [6]. In particular, 8/10 MYC translocation negative cases were EBV-positive, whereas the
positivity to the virus was detected in 90 % of MYC
translocation positive cases.
Unfortunately, RNA extracted from formalin-fixed and
paraffin-embedded (FFPE) material precluded next generation sequencing (NGS) studies in most cases, which
was therefore performed only in one case, whose fresh
tissue was available.
RNA extraction
For gene expression analysis, RecoverAll™ Total Nucleic
Acid Isolation Kit (Life Technologies, Carlsbad, California,
De Falco et al. BMC Cancer (2015) 15:668
USA) was used to extract total RNA from FFPE tissues. Up
to five 10 μm sections were processed per reaction. FFPE
samples were deparaffinised using a series of xylene and
ethanol washes. Next, they were subjected to a rigorous
protease digestion with an incubation time tailored for recovery of total RNA. RNA was purified using a rapid glassfiber filter methodology that includes an on-filter DNAse
treatment and were eluted into the low salt buffer provided. On the other hand, for miRNA analysis RNA was
extracted from FFPE sections of primary tumors and reactive lymph nodes using the miRNeasy FFPE Kit (Qiagen,
Milan, Italy), according to the manufacturer’s instructions.
The amount and quality of RNA were evaluated by measuring the OD at 260 nm and the 260/230 and 260/280
ratios using a Nanodrop spectrophotometer (Celbio, Milan,
Italy). The quality of RNA was also checked using a Bioanalyzer 2100 (Agilent, CA, USA).
Next generation sequencing
High-throughput RNA sequencing produced about 66
million of 75 bp paired ends reads (theoretical coverage calculated on Ref Seq transcriptome 84X). Chromosomal
translocations were detected using a bioinformatic pipeline
that combines results from three different fusion-detection
tools (deFuse, Chimerascan and Tophat Fusion) [21–23]
and filtered on non-tumor controls using previously
sequenced control reactive lymph nodes. MYC gene expression was estimated in one MYC translocation-negative
sample and in other 21 endemic Burkitt lymphomas using
the transcripts parts per million (TPM) calculation
method [24].
Single Nucleotide Variants (SNVs) and short insertions
and deletions (Indels) were called using the Genome
Analysis Toolkit (GATK) [25] after mapping quality
score recalibration and local realignment around indels.
Table 1 Primers used for RTqPCR. Primer sequences for DNMT1
amplified a region of 88 bp. Primers for DNMT3a amplified a region
of 68 bp; Primers for DNMT3b amplified a region of 68 bp; Primers
for MYC amplified a region of 129 bp; Primers for HPRT amplified a
region of 191 bp
Gene
Primer sequence
DNMT1-FORWARD
5’-CGACTACATCAAAGGCAGCAACCTG-3’
DNMT1-REVERSE
5’-TGGAGTGGACTTGTGGGTGTTCTC-3’
DNMT3A-FORWARD
5’-TAT TGATGAGCGCACAAGAGAGC-3’
DNMT3A-REVERSE
5’-GGGTGTTCCAGGGTAACATTGAG-3’
DNMT3b-FORWARD
5’-GGCAAGTTCTCCGAGGTCTCTG-3’
DNMT3b-REVERSE
5’-TGGTACATGGCTTTTCGATAGGA-3’
MYC-FORWARD
5’-AGCGACTCTGAGGAGGAAC-3’
MYC-REVERSE
5’-TGTGAGGAGGTTTGCTGTG-3’
HPRT-FORWARD
5’-AGCCAGACTTTGTTGGATTTG-3’
HPRT-REVERSE
5’-TTTACTGGCGATGTCAATAAG-3’
Page 3 of 13
All of the mutations detected were filtered using tresholds based on quality, coverage and strand of the
mapped reads and according to variants already present
in public databases (Hapmap, dbSNP and 1000genome
project) [26]. The Annovar tool [27] was used for functional annotation of variants, including exonic functions
and aminoacid changes. All the mutations found in the
MYC gene, including variations in intergenic, intronic
and UTR regions, were manually checked and explorated using the Integrative Genomic Viewer 2.03 (IGV)
visualization tool [28].
MicroRNA array profiling
MiRNA profiling was performed by an external facility
(Exiqon, Copenhagen, Denmark). The samples were labelled
using the miRCURY™ Hy3/Hy5 Power labelling kit and
hybridized on the miRCURY™ LNA Array (5th Generation
arrays, hsa, mmu and rno, Exiqon).
Raw data was then received and analyzed in our
laboratories. Briefly, signals quantified by microarrays were
processed with a normalization pipeline using MIDAS v2.22
software [29]: bad channels (intensity values less than 1)
were filtered prior to normalization, and all the spots with a
signal/noise value less than 2 were marked as “bad” and excluded from analysis (background correction). Signals were
normalized using the global Lowess (Locally weighted scatterplot smoothing) regression algorithm [30] with a smooth
parameter of 0,33, which has been found to produce the
best within-slide normalization to minimize the intensitydependent differences between the dyes. Statistical Analysis
was performed using MeV v4.7.4 on a dataset including only
human miRNA annotated on miRBase [31]. Unsupervised
hierarchical clustering on dataset was used on Pearson correlation of log2(Hy3/Hy5) intensities and all of the samples
and miRNAs were clusterized using average linkage method.
Principal Component Analysis (PCA) was also used to
discriminate the different biological samples on the basis of
the distances of a reduced set of new variables (Principal
Components). Differentially expressed miRNAs between
the two groups (MYC translocation-positive versus MYC
translocation-negative) were identified with a two-tailed
T-test with Welch approximation for different variance
among groups and with different stringency criteria for false
discovery rate (adjusted Bonferroni correction and no
correction). Results of the test were filtered considering as
differentially expressed only miRNAs with adjusted
p-value less than 0,05 and fold change in absolute
value greater than 1 [fold change = mean (group A) mean(group B)].
Quantitative Real-Time Polymerase Chain Reaction (RT-qPCR)
Quantitative RT-PCR was performed to validate results of
both miRNA and gene expression profiling, and to assess
relative expression of MYC in ten MYC translocation
De Falco et al. BMC Cancer (2015) 15:668
Page 4 of 13
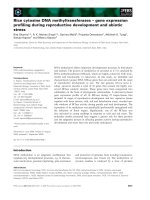
Fig. 1 MYC mRNA and protein expression in MYC translocation-positive and -negative BL cases. a Quantitative-RT-PCR. The expression of
MYC was analysed at the mRNA level in cases either carrying or lacking the translocation. RT-qPCR results show the up-regulation of the
gene also in the absence of MYC translocation; (b-c) Immunohistochemistry. In the exemplifying MYC translocation-positive case (b), a strong staining
in about 95 % of neoplastic cells is shown in contrast to the MYC translocation-negative one (c), in which the staining intensity was present in about
60 % of cells. b-c: MYC stain. Original Magnification (O.M): 20x
positive and ten MYC translocation negative cases. For
validation of differentially expressed miRNAs identified by
profiling, RNA samples were reverse transcribed using the
Universal cDNA synthesis kit (Exiqon, Copenhagen,
Denmark), according to the manufacturer’s instructions.
RT-qPCR amplification was performed using microRNA
LNA™ PCR primer sets (Exiqon, Copenhagen, Denmark)
specific for hsa-miR-29a-b, hsa-miR-513a-5p, and hsamiR-628-3p, and using hsa-Let-7c as a reference gene.
Validation of genes potentially targeted by the differentially expressed miRNAs (DNA (cytosine-5)-methyltransferase 1 (DNMT1), 3 alpha (DNMT3A), 3 beta (DNMT3B)
was also carried out by RT-qPCR using FluoCycle SYBR
green (Euroclone, Celbio, Italy) in 10 MYC-translocation
positive and 10 MYC-translocation negative cases according to manufacturer’s instructions. Non-neoplastic lymph
nodes were meant as a negative control; HPRT was used
as housekeeping gene. Primer sequences were designed
using Primer-BLAST [32] and are reported in Table 1.
Differences in gene expression were calculated using the
ΔΔCt method [33].
Immunohistochemistry
Immunohistochemistry analysis for MYC (Abcam; dilution
1:200), DNMT1 (BD Biosciences: dilution 1:50), DNMT3A
(Abcam; dilution 1:100), DNMT3B (Imgenex; dilution
1:200) and NMYC (ThermoScientific; dilution:1:100) was
performed on Bond III automated immunostainer (Leica
Microsystem, Bannockburn, IL, USA), with controls in
parallel. No epitope retrieval was exploited. Ultravision
Detection System using anti-Polyvalent HRP (LabVision,
Fremont, CA, USA) and diaminobenzidine (DAB, Dako,
Milan-Italy) as a chromogen was employed. The expression level of the proteins was evaluated in the ten MYC
translocation-positive and ten MYC translocation-negative
cases used for the RT-qPCR analysis, to validate results.
Immunoreactivity was assessed by two investigators and
cases with discrepancy were re-viewed to obtain a concordance ratio of more than 90 %. It is noteworthy that the
definition of MYC positivity by immunohistochemistry is
not universally standardized. However, the literature
reports that having at least 40 % of malignant lymphocytes
with nuclear MYC expression is considered positive [34];
therefore we used this cut-off to discriminate positive
and negative cases. For DNMT1 and DNMT3A, the
cut-off level was based on modified Choi et al. system
considering only the proportion of neoplastic cells
showing a nuclear positivity [35]. The expression of
DNMT1, DNMT3A and DNMT3B was considered absent/low if only 0–10 % of tumor cells were stained; intermediate whether the positivity was present in 11–50 % of
neoplastic cells, and high when the immmunoreactive
cells were >50 %. For N-MYC, only nuclear staining was
considered positive with no cut-off level.
De Falco et al. BMC Cancer (2015) 15:668
Page 5 of 13
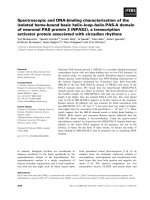
Fig. 2 a Genomic view of the distribution of MYC variants in sequenced sample. Sequence alignments of paired end reads are displayed
as greybars spanning exonic sequence of different MYC isoforms (blue segments below the reads alignment). Above the reads alignment
section, the coverage histogram shows the read depth distribution of the MYC gene base per base. b Histogram shows the distribution
of abundance of the MYC gene calculated in transcripts parts per million (TPM), in MYC translocation-negative sample (green) and other endemic MYC
translocation-positive Burkitt lymphomas RNA-seq samples (red)
Results
Next generation sequencing
MYC translocation-positive and MYC translocation-negative
BL cases express MYC at both the mRNA and protein levels
As we documented MYC expression in cases lacking the
typical translocation, we sought to verify whether cryptic
MYC abnormalities might have been missed by FISH analysis. To this aim, we studied by RNA-sequencing the only
MYC translocation-negative BL case for which adequate
material was available. Indeed, analysis of the MYC locus
revealed a normal structure of MYC transcripts (Fig. 2
and Additional file 1: Table S1).
We found that all of MYC translocation-positive cases
expressed MYC at the mRNA and protein levels
(Fig. 1a-c). By immunohistochemistry, a strong positivity
was observed in about 95 % of neoplastic cells. As far
as MYC translocation-negative BLs is concerned, we
observed that all the 10 samples expressed MYC
mRNA at variable level (Fig. 1a). The same was true
for MYC protein whose positivity was detectable in a
percentage of neoplastic cells ranging from 50 to
80 % (Fig. 1b-c). These findings confirmed that MYC
translocation-negative cases used in this study, even
lacking the typical MYC translocation, do express the
MYC protein (Fig. 1c), suggesting the existence of alternative mechanisms regulating MYC expression.
MYC translocation-positive and MYC translocation-negative
BL cases present with different microRNA expression
patterns
To ascertain whether there was a distinctive miRNA signature for MYC translocation-positive and negative BLs,
we profiled ten MYC translocation-positive BLs and ten
De Falco et al. BMC Cancer (2015) 15:668
Page 6 of 13
Fig. 3 Unsupervised analysis of Burkitt lymphomas. a The heat map diagram shows the result of the two-way unsupervised HC of miRNAs and samples
based on the expression of 1,375 miRNAs. HC, roughly discriminated MYC translocation-negative (yellow) and MYC translocation-positive (blue) cases
based on the miRNA expression pattern. In the matrix, each row represents a miRNA and each column represents a sample. The color scale illustrates the
relative expression level of a miRNA across all samples: red represents an expression level above the mean and green represents expression lower than
the mean. b PCA confirmed the distinction between MYC translocation-positive (blue) and MYC translocation-negative (yellow) samples
MYC translocation-negative BLs. Unsupervised hierarchical clustering (HC) showed that MYC translocationpositive and -negative BLs could be roughly separated in
two groups (Fisher exact test, p = 0.01) (Fig. 3a). In
addition, PCA confirmed the distinction between MYC
translocation-positive and -negative samples (Fig. 3b).
When a supervised approach was adopted, we identified
4 differentially expressed miRNAs out of 894 between
MYC translocation-positive and -negative BLs, (T-test,
p-values lower than 0.05 and fold change in absolute
value greater than 1) (Fig. 4a-b and Table 2). Again, consistently with previous unsupervised analyses, the HC
showed a clear distinction between MYC translocationpositive and -negative BLs (Fisher exact test, p = 0.001).
By contrast, when we applied the previously described
miRNA signature able to discriminate BL from diffuse
large B-cell lymphomas (DLBCL) constituted by 30 miRNAs containing MYC-regulated and nuclear factor-kB
pathways-associated miRNAs [36], we failed to discriminate BL cases according to the presence of MYC translocation, this ruling out bona fide the possible presence
of DLBCLs morphologically mimicking classical BL in
the present series (i.e. BL/DLBCL) [1]. Actually, hsamiR-29b that is up-regulated in DLBCL, is downregulated also in BL and mostly in MYC translocation
negative cases.
Validation of the results was performed on all the dysregulated miRNAs so identified (hsa-miR-29a, hsa-miR29b, hsa-miR-513a-5p, and hsa-miR-628-3p). Quantification of these miRNAs was performed using RT-qPCR in
all of the MYC translocation-positive and 10 MYC
translocation-negative cases. Collectively, fold changes of
hsa-miR-29a, hsa-miR-29b, hsa-miR-513a-5p, and hsamiR-628-3p obtained by microarray results were
confirmed by RT-qPCR (Fig. 4c). A significant downregulation of the miR-29 family members was observed in
MYC-translocation negative cases, whereas the remaining
two miRNAs were hyper-expressed in the absence of
translocation (p < 0.05).
The microRNA pattern impacts on the gene expression
profiling (GEP) of BL cases
After identification of miRNAs discriminating MYC
translocation-positive and MYC translocation-negative
De Falco et al. BMC Cancer (2015) 15:668
Page 7 of 13
Fig. 4 Differentially expressed miRNAs beetween MYC translocation-positive and negative Burkitt lymphomas a Volcano plot on T-test for
different miRNA expression between MYC translocation-positive and MYC translocation-negative. Volcano plot representing filtering threshold for one-tailed
T-test for differential expression analysis between MYC translocation-positive and MYC translocation-negative. The plot shows the difference between the
means of MYC translocation-positive and MYC translocation-negative for each miRNA plotted against the negative log10 p-value associated with the T-test.
Black horizontal shows the threshold for p-value = 0,05 and red vertical lines are used for filtering miRNAs on fold change value of 1 and −1. All of the 4
points of the plot highlighted in red represent differentially expressed miRNAs that pass the filtering thresholds on p-value and fold change. b Hierarchical
clustering on 4 differentially expressed miRNAs between MYC translocation-positive and MYC translocation-negative. Hierarchical cluster in samples and
miRNAs for 4 differentially expressed miRNAs that passed filtering thresholds. Each row represents a miRNA and each column represents a sample. Similar
samples and miRNAs of the experiment are connected by a series of branches. The length of each branch represents the distance in terms of Pearson
correlation of log2(Hy3/Hy5) between connected samples or miRNAs. The miRNA clustering tree is shown on the left. The color scale shown at the top
illustrates the relative expression level of a miRNA across all samples: red represents an expression level above the mean, green represents expression lower
than the mean. The samples are colour coded according to the groups; yellow are the MYC translocation-positive (BL1-10), blue are the
MYC translocation-negative. c Validation of miRNA profiling was assessed by RT-qPCR, which confirmed differential expression of these miRNAs in the
two groups, being hsa-miR-29a and hsa-miR-29b down-regulated and hsa-miR-513a-5p, and hsa-miR-628-3p up-regulated in MYC translocationnegative BL cases
samples, we investigated whether they could affect the
gene expression pattern of the tumors. 64 putative target
genes of such miRNAs were identified by bioinformatics
(Additional file 2: Table S2). Interestingly, the 64 predicted miRNA targets turned out to be significantly
enriched in molecules involved in gene expression
regulation, proliferation, and DNA modification (Additional file 3: Table S3) and included, among others
MYCN and DNMT family members (1, 3A, and 3B), all
known to be involved in malignant transformation.
Since a direct regulation of DNMT family members and
MYCN by hsa-miR-29b has been previously demonstrated
De Falco et al. BMC Cancer (2015) 15:668
Page 8 of 13
Table 2 miRNA profiling (p-value and fold change)
TargetID
p value
Fold change
(Absolute value)
hsa-miR-513a-5p 0,031124841 1,02109958
Regulation in
MYC-neg
Down
hsa-miR-628-3p
0,004815838 1,01011474
Down
hsa-miR-29a
0,0142882
Up
hsa-miR-29b
0,001516702 1,5403288
1,086645638
Up
[36, 37], DNMT1, DNMT3A, DNMT3B and MYCN
mRNA expression analysis was performed in a total of 10
MYC translocation-positive and 10 MYC translocationnegative cases by RT-qPCR. Interestingly, increased expression of DNMT1, DNMT3 family members and MYCN
was observed in MYC translocation-negative samples in
comparison to the MYC translocation-positive cases and
the control (Figs. 5a, 6a, 7a, 8a).
DNMT1, DNMT3A, DNMT3B and NMYC protein expression
in BL tumour samples
DNMTs and N-MYC protein expression was analyzed in
10 MYC translocation-positive and 10 MYC translocationnegative BL tumor samples by immunohistochemistry. In
MYC translocation-positive BLs the positivity for DNMT1
was low/intermediate and ranged from 10 % to 30 %
(Fig. 5b). In MYC translocation-negative cases, the expression of the protein was high; all the cases showed more
than 70 % positive cells (Fig. 5c). DNMT3A protein staining was high in both MYC translocation-positive and
-negative BLs. However, only 3 out of 10 samples had a
percentage of positive cells more than 40 % (Fig. 6b)
whereas all MYC translocation-negative BLs had more
than 60 % of neoplastic cells depicted by the antibody
(Fig. 6c). In MYC translocation-positive BLs the positivity
for DNMT3B was very low and ranged from 5 % to 10 %
(Fig. 7b). In MYC translocation-negative cases, the expression of the protein was high; all the cases showed more
than 70 % positive cells (Fig. 7c). N-MYC protein expression was low in all the MYC translocation-positive BLs examined in which the staining was positive in about 5 % of
neoplastic cells (Fig. 8b). MYC-translocation negative samples demonstrated higher N-MYC positivity that was
present in more than 90 % of neoplastic cells (Fig. 8c).
Discussion
BL is an aggressive B-cell lymphoma with a characteristic
clinical presentation, morphology and immunophenotype
[1]. Over the past years, the typical translocation, involving
the MYC oncogene and its variants, has been considered
the molecular hallmark of this tumor. However, transcriptional and genomic profiling aimed to distinguish BL versus
DLBCL revealed the existence of BLs without evident
MYC translocation clustering with molecular BL. A recent
paper reported that BLs lacking MYC translocation share a
peculiar pattern of chromosome 11q aberration [38]. The
significantly lower expression of MYC in such cases supported the view that MYC is not genomically activated,
and the clinical, morphologic, and molecular characterizations of these cases suggest that they represent a distinct
subset of MYC-negative high-grade B-cell lymphomas with
features resembling but not identical to BL. Yet, these findings do not explain the mechanisms through which some
classic BL cases lack the typical genetic translocation involving MYC but do express MYC at the mRNA and the
protein level [5, 6]. Dysregulation of MYC expression may
be due to additional mechanisms, other than common genomic abnormalities, such as a miRNA imbalance [39, 40].
So far, no data is available concerning the miRNA profile of
MYC translocation-negative cases, besides the evidences
previously reported by our group [5, 6]. In this study, we
further explored the miRNA profile of BLs carrying or not
the classical translocations involving the MYC gene.
Interestingly, when we compared the miRNA profiling of
MYC translocation-positive versus MYC translocationnegative BL cases, we identified four miRNAs differentially
expressed, of which hsa-miR-513a-5p and hsa-miR-628-3p
were up-regulated and two miR-29 family members (hsamiR-29a and hsa-miR-29b) were down-regulated in BL
cases lacking the MYC translocation.
Of note, microarray-based miRNA analysis turned out
to be quite specific and robust in this study. In fact, all
of the genes tested were successfully validated by RTqPCR.
Hsa-miR-628-3p and hsa-miR-513a-5p are less
referred in the literature, whereas, more is known about
the miR-29 family [41]. Interestingly, miR-29 family
members have been related to malignant transformation,
and it has been demonstrated that their down-regulation
contributes to MYC-induced lymphomagenesis in vivo
and in vitro models [42, 43]. Thus, hsa-miR-29 family
members down-regulation may represent an appealing
possible mechanisms able to determine MYC up-regulation
and sustain its expression at mRNA and protein level also
in the absence of a translocation. Interestingly, a link between the miR-29 family by MYC has been recently
reported [44], as repression of miR-29 by MYC through a
corepressor complex with HDAC3 and EZH2 is observed
in aggressive B-cell lymphomas [43]. This miRNA family
may represent a novel target for tailored therapies as
in vitro and mouse studies suggest increasing miR-29
expression by combined inhibition of HDAC3 and EZH2.
Such an approach could help treat MYC-overexpressing
cancers [44]. In addition, it has been recently demonstrated
that hsa-miR-29b directly binds to DNMT3A and
DNMT3B, and regulates indirectly DNMT1 by targeting
Sp1, a transactivator of the gene [36, 45]. In this scenario,
over-expression of DNMT family members, due to hypo-
De Falco et al. BMC Cancer (2015) 15:668
Page 9 of 13
Fig. 5 RT-qPCR validation and immunohistochemical evaluation of DNMT1 in MYC translocation-positive and MYC translocation-negative BL primary
tumors. a Quantitative-RT-PCR. The expression of DNMT1 was analysed at the mRNA level by RT-qPCR. The results show up-regulation of DNMT1 in
cases lacking the translocation; (b-c) Immunohistochemistry. In the exemplifying MYC translocation-positive case (b), the staining is present in about 30 % of
neoplastic cells, in contrast to the MYC translocation-negative one (c), in which the positivity is depicted in about 80 % of cells. b-c: DNMT1 stain. O.M: 20x
Fig. 6 RT-qPCR validation and immunohistochemical evaluation of DNMT3A in MYC translocation-positive and MYC translocation-negative BL primary
tumors. a Quantitative-RT-PCR The expression of DNMT3A was analysed at the mRNA level by RT-qPCR. As for DNMT1, DNMT3A resulted up-regulated
in cases lacking the translocation; (b-c) Immunohistochemistry. In the exemplifying MYC translocation-positive case (b), the staining is shown in 40 %
of neoplastic cells in contrast to the MYC translocation-negative one (c), in which about 60 % of cells are positive. b-c: DNMT3A stain. O.M: 20x
De Falco et al. BMC Cancer (2015) 15:668
Page 10 of 13
Fig. 7 RT-qPCR validation and immunohistochemical evaluation of DNMT3B in MYC translocation-positive and MYC translocation-negative BL primary
tumors. a Quantitative-RT-PCR The expression of DNMT3B was analysed at the mRNA level by RT-qPCR. As for DNMT3A, DNMT3B resulted up-regulated
in cases lacking the translocation; (b-c) Immunohistochemistry. In the exemplifying MYC translocation-positive case (b), the staining is shown in 5 % of
neoplastic cells in contrast to the MYC translocation-negative one (c), in which about 70 % of cells are positive. b-c: DNMT3B stain. O.M: 20x
expression of hsa-miR-29 family members, may elicit a role
in inducing carcinogenesis [46]. The finding that DNMTs
were up-regulated in MYC translocation-negative BLs suggests an alternative way for the activation of lymphomagenesis in these cases, based on global changes in methylation
landscape and loss of epigenetic control. Hsa-miR29a may
favor this process by a synergistic hypermethylating effect
[47]. In this regard, future studies exploring the global
methylation patterns of BL with or without MYC translocation are definitely warranted.
We were also intrigued by the observation that
another member of the MYC family, MYCN, was potentially dysregulated in BL cases lacking MYC translocation. Literature reports that MYC and N-MYC possess
similar ability to induce cell proliferation and transformation although MYC may be more effective in some
contexts. Over-expression of specific MYC family genes
is frequently associated with particular types of human
tumors [4]; MYCN deregulation is almost exclusively
associated with solid tumors and only rarely observed
in lymphomas. Nonetheless, both N-MYC and MYC are
expressed in pro-B cells, and it has been demonstrated
that N-MYC can support normal B-cell development in
the absence of MYC [48–50]. Over-expression of either
MYC or N-MYC under the control of the B cell-specific
Eμ enhancer results in development of pro-B cell lymphomas [51]. Finally, complex MYCN/IGH translocations
frequently arise in mice deficient for p53, showing that, in
this genetic background, the endogenous N-MYC can
compete with MYC as a pro-B cell oncogenic translocation/amplification target [52]. Based on our findings (i.e.
over-expression of N-MYC at the mRNA and protein
levels in MYC translocation-negative cases) one should
hypothesize that in BL cases lacking MYC translocation
N-MYC may represent an alternative cooperating mechanisms in contributing to malignant transformation. Interestingly, two of the differentially expressed miRNAs (miR513a-5p and miR-628-3p) have been recently reported
dysregulated in human neuroblastomas, in which aberrant
expression of MYCN is quite common [53, 54]. Of note,
miR-628-3p expression seems even to correlate with tumors prognosis in such cases [55]. Altogether this observation suggests that MYCN aberrant expression itself
may impact gene and microRNA expression pattern
in BL cases lacking the typical MYC translocation. A
large body of evidence has documented the existence
of an active cross-talk between MYC itself and miRNAs machinery, suggesting the existence of a feedback
loop between MYC and specific miRNAs [56]. This, in
turn, might be the cause of a differential gene expression
De Falco et al. BMC Cancer (2015) 15:668
Page 11 of 13
Fig. 8 RT-qPCR validation and immunohistochemical evaluation of N-MYC in MYC translocation-positive and MYC translocation-negative BL primary
tumors. a Quantitative-RT-PCR The expression of NMYC was analysed RT-qPCR. MYC-translocation negative cases show a dramatic hyper-expression of
the gene; altogether RT-qPCR results confirmed the bioinformatics predictions, which suggest a regulation of these by the miR29 family. Over-expression
of the selected genes is in accordance with down-regulation of the miR-29 family observed in MYC-translocation negative cases; (b-c) Immunohistochemistry.
In the exemplifying MYC translocation-positive case (b), the staining is present only in 5 % of neoplastic cells in contrast to the MYC translocation-negative one
(c), in which the positivity is detectable in about 90 % of cells. b: H&E, c: NMYC stain. b-c, O.M: 40x
and of functional alterations of neoplastic cells [40]. The
difference in has-miR29 family members expression we
detected between MYC translocation-positive and MYCtranslocation negative BL samples might be related to the
lower MYC protein level among cases lacking the MYCtranslocation.
Conclusions
Our results extend the current knowledge on aggressive
B-cell lymphomas presenting with MYC expression but
lacking a conventional translocation. The evidences of NMYC and DNMT family member dysregulation point at a
more complex scenario involving MYC and other players
in BL tumorigenesis, and underline the role of a miRNAsMYC feedback loop. Therefore, MYC translocationnegative BL cases can represent a model to understand
the intricate molecular pathways responsible for both
MYC over-expression and its interaction with complex
cellular processes.
Availability of supporting data
All the data used in this study have been deposited in
the Gene Expression Omnibus (GEO) database. The accession number is GSE71471, and the link to freely access to all the information is />geo/query/acc.cgi?acc=GSE71471.
Additional files
Additional file 1: Table S1. List of inter and intra chromosomal gene
fusion detected by fusion-detection pipeline. (XLS 89 kb)
Additional file 2: Table S2. Predicted target genes of miRNAs
differentially expressed in MYC translocation-positive and -negative
BLs. (DOC 50 kb)
Additional file 3: Table S3. Gene set enrichment analysis for gene
ontology categories of 64 genes predicted as targets of microRNAs
differentially expressed in MYC translocation-positive and -negative
BLs. (DOC 67 kb)
Abbreviations
BL: Burkitt lymphoma; DLBCL: Diffuse large B-cell lymphoma; DNMT: DNA
methyltransferase; FFPE: Formalin fixed and paraffin embedded;
FISH: Fluorescence in situ hybridization; GATK: Genome Analysis Toolkit;
GEP: Gene expression profiling; HC: Unsupervised hierarchical clustering;
IGH: Immunoglobulin heavy chain gene; IGL: Immunoglobulin light chain
gene; miRNAs: microRNAs; NGS: Next generation sequencing;
PCA: Principal component analysis; RT-qPCR: Quantitative Real-Time
polymerase chain reaction; SNVs: Single Nucleotide Variants; WHO: World
Health Organization.
Competing interests
The authors declare that they have no competing interests.
Authors’ contributions
DFG, AMR, LL and PPP conceived and designed the experiments; OA, FF, ML,
GS. performed the experiments; DFG, AMR, FF analyzed the data; BC, NM, EM,
RBJ, contributed reagents/materials/analysis tools; DFG, LL, AMR and PPP draft
the paper, LL and SAP were responsible for funding. All authors read and
approved the final manuscript.
De Falco et al. BMC Cancer (2015) 15:668
Acknowledgements
The Authors would like to thank the INCTR - Pathology Program and in particular
Professor Martin Raphael and Kikkeri Naresh for their expert reviewing of the
cases.
This work was supported by the Centro Interdipartimentale per la Ricerca sul
Cancro “G. Prodi”, Bologna AIL, AIRC 10007 5xMille – Prof. Pileri, AIRC IG
2013 N.14355 – Prof. Piccaluga, RFO (Prof. Pileri and Prof. Piccaluga), Progetto
Strategico di Ateneo 2006 (Prof. Pileri and Prof. Piccaluga), and FIRB Futura
2011 RBFR12D1CB (Prof. Piccaluga). – Prof. Leoncini, Regional Health
Research Program 2009. (Programma per la Ricerca Regionale in Materia
di Salute- Direzione Generale del Diritto alla Salute e delle Politiche di
Solidarietà) and PRIN 2010–2011.
Author details
1
Department of Medical Biotechnologies, University of Siena, Italy - Via delle
Scotte, 6 - 53100 Siena, Italy. 2School of Biological and Chemical Sciences,
Queen Mary University of London, London, UK. 3Department of
Experimental, Diagnostic, and Specialty Medicine, University of Bologna, Via
Zamboni, 33, 40126 Bologna, Italy. 4Unit of Pathology, Brescia University,
Piazza del Mercato, 15, Brescia, Italy.
Received: 26 January 2015 Accepted: 28 September 2015
References
1. Swerdlow SH, Campo E, Harris NL, Jaffe E, Pileri S, Stein H. WHO classification of
tumors of haematopoietic and lymphoid tissues. Lyon, France: IARC; 2008.
2. van Rijk A, Mason D, Jones M, Cabeçadas J, Crespo M, Cigudosa JC, et al.
Translocation detection in lymphoma diagnosis by split-signal FISH: a
standardised approach. J Hematop. 2008;1(2):119–26.
3. Evans PA, Pott C, Groenen PJ, Salles G, Davi F, Berger F, et al. Significantly
improved PCR-based clonality testing in B-cell malignancies by use of multiple
immunoglobulin gene targets. Report of the BIOMED-2 Concerted Action
BHM4-CT98-3936. Leukemia. 2007;21(2):207–14.
4. Elaine S. Jaffe NLH, James W. Vardiman, Campo E. and Daniel A. Arber.
Hematopathology. Edited by Elsevier. London, UK. 2011.
5. Leucci E, Cocco M, Onnis A, De Falco G, van Cleef P, Bellan C, et al. MYC
translocation-negative classical Burkitt lymphoma cases: an alternative
pathogenetic mechanism involving miRNA deregulation. J Pathol.
2008;216(4):440–50.
6. Onnis A, De Falco G, Antonicelli G, Onorati M, Bellan C, Sherman O, et al.
Alteration of microRNAs regulated by c-Myc in Burkitt lymphoma. PLoS
One. 2010;5(9):e12960.
7. Liao LM, Sun XY, Liu AW, Wu JB, Cheng XL, Lin JX, et al. Low expression of
long noncoding XLOC_010588 indicates a poor prognosis and promotes
proliferation through upregulation of c-Myc in cervical cancer. Gynecol
Oncol. 2014;133(3):616–23.
8. Dews M, Tan GS, Hultine S, Raman P, Choi J, Duperret EK, et al. Masking
epistasis between MYC and TGF-β pathways in antiangiogenesis-mediated
colon cancer suppression. J Natl Cancer Inst. 2014;106(4):dju043.
9. Terunuma A, Putluri N, Mishra P, Mathé EA, Dorsey TH, Yi M, et al. MYCdriven accumulation of 2-hydroxyglutarate is associated with breast cancer
prognosis. J Clin Invest. 2014;124(1):398–412.
10. Wu DW, Hsu NY, Wang YC, Lee MC, Cheng YW, Chen CY, et al. c-Myc
suppresses microRNA-29b to promote tumor aggressiveness and poor
outcomes in non-small cell lung cancer by targeting FHIT. Oncogene. 2014.
doi: 10.1038/onc.2014.152.
11. Zhang EB, Han L, Yin DD, Kong R, De W, Chen J. c-Myc-induced, long,
noncoding H19 affects cell proliferation and predicts a poor prognosis in
patients with gastric cancer. Med Oncol. 2014;31(5):914. doi:10.1007/s12032014-0914-7.
12. Schmitz R, Ceribelli M, Pittaluga S, Wright G, Staudt LM. Oncogenic mechanisms
in Burkitt lymphoma. Cold Spring Harb Perspect Med. 2014;4(2):a014282.
doi:10.1101/cshperspect.a014282.
13. Love C, Sun Z, Jima D, Li G, Zhang J, Miles R, et al. The genetic landscape of
mutations in Burkitt lymphoma. Nat Genet. 2012;44:1321–5.
14. Richter J, Schlesner M, Hoffmann S, Kreuz M, Leich E, Burkhardt B, et al.
Recurrent mutation of the ID3 gene in Burkitt lymphoma identified by
integrated genome, exome and transcriptome sequencing. Nat Genet.
2012;44(12):1316–20.
Page 12 of 13
15. Ott G, Rosenwald A, Campo E. Understanding MYC-driven aggressive B-cell
lymphomas: pathogenesis and classification. Blood. 2013;122(24):3884–91.
16. Lee YS, Dutta A. MicroRNAs in cancer. Annu Rev of Pathol. 2009;4:199–227.
17. Fabbri M, Croce CM, Calin GA. MicroRNAs in the ontogeny of leukemias and
lymphomas. Leuk Lymphoma. 2009;50(2):160–70.
18. Schuldiner O, Benvenisty N. A DNA microarray screen for genes involved in
c-MYC and N-MYC oncogenesis in human tumors. Oncogene.
2001;20:4984–94.
19. Singh MD, Raj K, Sarkar S. Drosophila Myc, a novel modifier suppresses the
poly(Q) toxicity by modulating the level of CREB binding protein and
histone acetylation. Neurobiol Dis. 2014;63:48–61. doi:10.1016/
j.nbd.2013.11.015. Epub 2013 Nov 27.
20. Naresh KN, Raphael M, Ayers L, Hurwitz N, Calbi V, Rogena E, et al. Lymphomas in
sub-Saharan Africa–what can we learn and how can we help in improving
diagnosis, managing patients and fostering translational research? Br J Haematol.
2011;154(6):696–703.
21. McPherson A, Hormozdiari F, Zayed A, Giuliany R, Ha G, Sun MG, et al.
deFuse: an algorithm for gene fusion discovery in tumor RNA-Seq data.
PLoS Computational Biology. 2011;7(5):e1001138.
22. Lyer MK, Chinnaiyan AM, Maher CA. ChimeraScan: a tool for identifying
chimeric transcription in sequencing data. Bioinformatics. 2011;27(20). A.
23. Kim D, Salzberg SL. TopHat-Fusion: an algorithm for discovery of novel
fusion transcripts. Genome Biol. 2011;12(8):R72.
24. Gupta R, Dewan I, Bharti R, Bhattacharya A. Differential expression analysis
for RNA-Seq data. ISRN Bioinformatics. 2012;2012(817508):8.
25. McKenna A, Hanna M, Banks E, Sivachenko A, Cibulskis K, Kernytsky A.
The Genome Analysis Toolkit: a MapReduce framework for analyzing
next-generation DNA sequencing data. Genome Res.
2010;20:1297–303.
26. The 1000 Genomes Project Consortium. A map of human genome variation
from population-scale sequencing. Nature. 2010;467:1061–73.
27. Wang K, Li M, Hakonarson H. ANNOVAR: Functional annotation of genetic
variants from next-generation sequencing data. Nucleic Acids Res. 2010;38:e164.
28. Robinson JT, Thorvaldsdóttir H, Winckler W, Guttman M, Lander ES, Getz G,
Mesirov JO. Integrative genomics viewer. Nat Biotechnol. 2011;29:24–6.
29. Quackenbush J. Microarray data normalization and transformation. Nat
Genetics. 2002;32:496–501.
30. Cleveland WS. Robust locally weighted regression and smoothing
scatterplots. J Amer Stat Ass. 1979;74:829–36.
31. Saeed AI, Sharov V, White J, Li J, Liang W, Bhagabati N, et al. TM4: a free,
open-source system for microarray data management and analysis.
Biotechniques. 2003;34(2):374–8.
32. Ye J, Coulouris G, Zaretskaya I, Cutcutache I, Rozen S, Madden T. Primer-BLAST:
A tool to design target-specific primers for polymerase chain reaction. BMC
Bioinformatics. 2012;13(1):134.
33. Livak KJ, Schmittgen TD. Analysis of relative gene expression data using
real-time quantitative PCR and the 2(−Delta Delta C(T)) Method. Methods.
2001;25:402–8.
34. Mahmoud AZ, George TI, Czuchlewski DR, Zhang QY, Wilson CS, Sever CE,
et al. Scoring of MYC protein expression in diffuse large B-cell lymphomas:
concordance rate among hematopathologists. Mod Pathol. 2014. doi:
10.1038/modpathol.2014.140.
35. Choi MS, Shim YH, Hwa JY, Lee SK, Ro JY, Kim JS, et al. Expression of DNA
methyltransferases in multistep hepatocarcinogenesis. Hum Pathol.
2003;34(1):11–7.
36. Lenze D, Leoncini L, Hummel M, Volinia S, Liu CG, Amato T, et al. The different
epidemiologic subtypes of Burkitt lymphoma share a homogeneous
microRNA profile distinct from diffuse large B-cell lymphoma. Leukemia.
2011;25(12):1869–76.
37. Garzon R, Liu S, Fabbri M, Liu Z, Heaphy CE, Callegari E, et al. MicroRNA-29b
induces global DNA hypomethylation and tumor suppressor gene
reexpression in acute myeloid leukemia by targeting directly DNMT3A and
3B and indirectly DNMT1. Blood. 2009;113(25):6411–8.
38. Buechner J, Tømte E, Haug BH, Henriksen JR, Løkke C, Flægstad T, et al.
Tumour-suppressor microRNAs let-7 and mir-101 target the protooncogene MYCN and inhibit cell proliferation in MYCN-amplified
neuroblastoma. Br J Cancer. 2011;105:296–303.
39. Salaverria I, Martin-Guerrero I, Wagener R, Kreuz M, Kohler CW, Richter J,
et al. A recurrent 11q aberration pattern characterizes a subset of MYCnegative high-grade B-cell lymphomas resembling Burkitt lymphoma.
Blood. 2014;123(8):1187–98.
De Falco et al. BMC Cancer (2015) 15:668
Page 13 of 13
40. Mott JL, Kurita S, Cazanave S, Bronk SF, Werneburg NW and FernandezZapico ME. Transcriptional suppression of miR29b-1/miR29a promoter by
c-Myc, Hedgehog, and NF-kappaB. J Cell Biochem. 2010;110(5):1155–64.
41. Fabbri M, Garzon R, Cimmino A, Liu Z, Zanesi N, Callagari E, et al. MicroRNA29 family reverts aberrant methylation in lung cancer by targeting DNA
methyltransferases 3A and 3B. Proc Natl Acad Sci U S A.
2007;104(40):15805–10.
42. Chang TC, Yu D, Lee YS, Wentzel EA, Arking DE, West KM, et al. Widespread
microRNA repression by Myc contributes to tumorigenesis. Nat Genet.
2008;40(1):43–50.
43. Martinez I, Cazalla D, Almstead LL, Steitz JA, DiMaio D. miR-29 and miR-30
regulate B-Myb expression during cellular senescence. Proc Natl Acad Sci U
S A. 2011;108(2):522–7.
44. Zhang X, Zhao X, Fiskus W, Lin J, Lwin T, Rao R, et al. Coordinated silencing
of MYC-mediated miR-29 by HDAC3 and EZH2 as a therapeutic target of
histone modification in aggressive B-Cell lymphomas. Cancer Cell.
2012;22(4):506–23.
45. Jiang H, Zhang G, Wu J, Jiang C. Diverse roles of miR-29 in cancer. Oncol
Rep. 2014;31(4):1509–16.
46. Peters SL, Hlady RA, Opavska J, Klinkebiel D, Novakova S, Smith LM, et al.
Essential role for Dnmt1 in the prevention and maintenance of MYC-induced
T-cell lymphomas. Mol Cell Biol. 2013;33(21):4321–33.
47. Robaina MC, Mazzocoli L, Arruda VO, de Souza Reis FR, Apa GA, de
Rezende LMM, et al. Deregulation of DNMT1, DNMT3B and miR-29 s in
Burkitt lymphoma suggests novel contribution for disease pathogenesis.
Exp Mol Pathol. 2015;98:200–7.
48. Strieder V, Lutz W. Regulation of N-myc expression in development and
disease. Cancer Lett. 2002;180:107–19.
49. Malynn BA, de Alboran IM, O’Hagan RC, Bronson R, Davidson L, DePinho RA,
et al. N-myc can functionally replace c-myc in murine development, cellular
growth, and differentiation. Genes Dev. 2000;14:1390–9.
50. Rosenbaum H, Webb E, Adams JM, Cory S, Harris A. N-myc transgene
promotes B lymphoid proliferation, elicits lymphomas and reveals crossregulation with c-myc. EMBO J. 1989;8:749–55.
51. Sheppard RD, Samant SA, Rosenberg M, Silver LM, Cole MD. Transgenic
N-myc mouse model for indolent B cell lymphoma: tumor
characterization and analysis of genetic alterations in spontaneous and
retrovirally accelerated tumors. Oncogene. 1998;17:2073–85.
52. Rooney S, Sekiguchi J, Whitlow S, Eckersdorff M, Manis JP, Lee C, et al.
Artemis and p53 cooperate to suppress oncogenic N-myc amplification in
progenitor B cells. Proc Natl Acad Sci U S A. 2004;101:2410–5.
53. Muthu M, Cheriyan VT, Munie S, Levi E, Frank J, Ashour AE, et al.
Mechanisms of Neuroblastoma Cell Growth Inhibition by CARP-1 Functional
Mimetics. PLoS One. 2014;9(7):e102567.
54. Schulte JH, Schowe B, Mestdagh P, Kaderali L, Kalaghatgi P, Schlierf S, et al.
Accurate prediction of neuroblastoma outcome based on miRNA
expression profiles. Int J Cancer. 2010;127(10):2374–85.
55. Schulte JH, Marschall T, Martin M, Rosenstiel P, Mestdagh P, Schlierf S, et al.
Deep sequencing reveals differential expression of microRNAs in favorable
versus unfavorable neuroblastoma. Nucleic Acids Res. 2010;38(17):5919–28.
56. Wu DW, Hsu NY, Wang YC, Lee MC, Cheng YW, Chen CY, et al. c-Myc
suppresses microRNA-29b to promote tumor aggressiveness and poor
outcomes in non-small cell lung cancer by targeting FHIT. Oncogene.
2015;34(16):2072–82.
Submit your next manuscript to BioMed Central
and take full advantage of:
• Convenient online submission
• Thorough peer review
• No space constraints or color figure charges
• Immediate publication on acceptance
• Inclusion in PubMed, CAS, Scopus and Google Scholar
• Research which is freely available for redistribution
Submit your manuscript at
www.biomedcentral.com/submit
![Tài liệu Báo cáo khoa học: The stereochemistry of benzo[a]pyrene-2¢-deoxyguanosine adducts affects DNA methylation by SssI and HhaI DNA methyltransferases pptx](https://media.store123doc.com/images/document/14/br/gc/medium_Y97X8XlBli.jpg)