Evaluation of an assay for methylated BCAT1 and IKZF1 in plasma for detection of colorectal neoplasia
Bạn đang xem bản rút gọn của tài liệu. Xem và tải ngay bản đầy đủ của tài liệu tại đây (1.11 MB, 11 trang )
Pedersen et al. BMC Cancer (2015) 15:654
DOI 10.1186/s12885-015-1674-2
RESEARCH ARTICLE
Open Access
Evaluation of an assay for methylated BCAT1
and IKZF1 in plasma for detection of colorectal
neoplasia
Susanne K. Pedersen1*†, Erin L. Symonds2,3†, Rohan T. Baker1, David H. Murray1, Aidan McEvoy1,
Sascha C. Van Doorn4, Marco W. Mundt5, Stephen R. Cole2,3, Geetha Gopalsamy2, Dileep Mangira2,
Lawrence C. LaPointe1, Evelien Dekker4 and Graeme P. Young2
Abstract
Background: Specific genes, such as BCAT1 and IKZF1, are methylated with high frequency in colorectal cancer
(CRC) tissue compared to normal colon tissue specimens. Such DNA may leak into blood and be present as
cell-free circulating DNA. We have evaluated the accuracy of a novel blood test for these two markers across
the spectrum of benign and neoplastic conditions encountered in the colon and rectum.
Methods: Circulating DNA was extracted from plasma obtained from volunteers scheduled for colonoscopy for
any reason, or for colonic surgery, at Australian and Dutch hospitals. The extracted DNA was bisulphite converted and
analysed by methylation specific real-time quantitative PCR (qPCR). A specimen was deemed positive if one or more
qPCR replicates were positive for either methylated BCAT1 or IKZF1 DNA. Sensitivity and specificity for CRC were
estimated as the primary outcome measures.
Results: Plasma samples were collected from 2105 enrolled volunteers (mean age 62 years, 54 % male), including 26
additional samples taken after surgical removal of cancers. The two-marker blood test was run successfully on 2127
samples. The test identified 85 of 129 CRC cases (sensitivity of 66 %, 95 % CI: 57–74). For CRC stages I-IV, respective
positivity rates were 38 % (95 % CI: 21–58), 69 % (95 % CI: 53–82), 73 % (95 % CI: 56–85) and 94 % (95 % CI: 70–100). A
positive trend was observed between positivity rate and degree of invasiveness. The colonic location of cancer did not
influence assay positivity rates. Gender, age, smoking and family history were not significant predictors of marker
positivity. Twelve methylation-positive cancer cases with paired pre- and post-surgery plasma showed reduction in
methylation signal after surgery, with complete disappearance of signal in 10 subjects. Sensitivity for advanced
adenoma (n = 338) was 6 % (95 % CI: 4–9). Specificity was 94 % (95 % CI: 92–95) in all 838 non-neoplastic pathology
cases and 95 % (95 % CI: 92–97) in those with no colonic pathology detected (n = 450).
Conclusions: The sensitivity for cancer of this two-marker blood test justifies prospective evaluation in a true screening
population relative to a proven screening test. Given the high rate of marker disappearance after cancer resection, this
blood test might also be useful to monitor tumour recurrence.
Trial registration: ACTRN12611000318987.
Keywords: DNA methylation, Screening, Colorectal cancer, BCAT1, IKZF1
* Correspondence:
†
Equal contributors
1
Clinical Genomics Pty Ltd, Sydney, Australia
Full list of author information is available at the end of the article
© 2015 Pedersen et al. Open Access This article is distributed under the terms of the Creative Commons Attribution 4.0
International License ( which permits unrestricted use, distribution, and
reproduction in any medium, provided you give appropriate credit to the original author(s) and the source, provide a link to
the Creative Commons license, and indicate if changes were made. The Creative Commons Public Domain Dedication waiver
( applies to the data made available in this article, unless otherwise stated.
Pedersen et al. BMC Cancer (2015) 15:654
Background
Colorectal cancer (CRC) is the second leading cause of
death from cancer in the developed world [1]. Randomised controlled trials (RCT) in the general population
have shown that early detection by screening, such as
with faecal occult blood test (FOBT) or flexible sigmoidoscopy, reduces mortality and may also reduce incidence
[2–6]. Reduction in mortality is dependent on treatment
of curable neoplasms destined to cause death while reduction in incidence is dependent on detection and removal of pre-invasive lesions (i.e. adenomas). Given that
early detection of a neoplasm is worthwhile for either a
bleeding phenotype or a phenotype that enables visualisation (as detected by FOBT and flexible sigmoidoscopy,
respectively), detection of a neoplasm based on other
factors such as molecular characteristics may have the
same benefit, but this is yet to be established.
In addition to the ability of a test to detect early curable
lesions, a screening test can only be effective if the targeted
individual undertakes the test. This behavioural consideration presents certain barriers for endoscopic methods and
in some countries also for FOBT. Participation rates for
both FOBT and endoscopic methods are highly variable
and clearly sub-optimal in many settings [7].
It has been suggested that a blood test would be more
acceptable and circumvent some of the barriers with
established screening methods [8, 9]. A blood test could
be deployed as an alternative frontline screening test or
else as a “rescue” strategy that aims to engage those who
reject the existing RCT-proven methods such as FOBT
and flexible sigmoidoscopy. The appropriate manner of
deployment will depend in part on the accuracy of such
a blood test.
Aberrant DNA methylation is a characteristic of colorectal tumours [10, 11]. SEPT9 is one such tumour
marker methylated in colorectal neoplasia that is detectable in blood [12, 13], but its clinical performance
as a screening test is suboptimal. We have previously
reported the identification and validation of a cohort of
genes with hypermethylated regions that show promise
for differentiating adenomas and early stage cancer from
normal state and benign pathology [14]. More recently, we
have shown that cell free circulating DNA extracted from
blood from CRC patients has a significantly higher fraction of methylation across two genes, namely BCAT1 and
IKZF1, compared to normal controls [15]. It is important
to determine the accuracy of detecting methylated BCAT1
and IKZF1 DNA in blood across the range of neoplastic
lesions encountered in the colon before proceeding to
compare outcomes from screening programs using the
two-marker blood test, to programs using proved screening tests. The latter step is crucial to the inclusion of tests
based on blood molecular markers in screening programs
since early detection alone does not guarantee program
Page 2 of 11
efficacy or effectiveness when the biological basis of lesion
detection is different [16, 17].
The goal of this study was to estimate true and false
positive rates of the two-marker blood test for screenrelevant stages of colorectal neoplasia, namely advanced
adenoma and CRC of specific stage, and across the full
spectrum of non-neoplastic pathologies encountered in
the colon/rectum when screening a large population.
Methods
Study overview
This was a multi-centre predominantly prospective study
funded in part by the National Health and Medical Research Council (NHMRC) and Clinical Genomics Technologies Pty Ltd (CGT) to estimate the sensitivity and
specificity of a test detecting methylated BCAT1 and/or
IKZF1 DNA in blood from people with neoplasia or
non-neoplastic pathologies likely to be encountered in the
colon and rectum. Findings at colonoscopy were used
as the diagnostic standard. The study was approved by
the Southern Adelaide Clinical Human Research Ethics
Committee (April 4, 2005) and Medical Ethical Board
of Academic Medical Centre Amsterdam (July 12, 2011).
Written informed consent was obtained from all recruits
prior to any procedures. Clinical and research staff at the
medical institutions audited clinical data and verified case
classification blinded to assay results determined by CGT.
The clinical data were only released subsequent to completion of testing of all collected samples. Test results were
not disclosed to subjects or their physicians. The trial is
registered at Australian and New Zealand Clinical Trials
Registry trial registration number 12611000318987.
Population
Subjects aged 33-85 years old and either scheduled for
colonoscopy for standard clinical indications (prospective
element), or shown at colonoscopy within the prior ten
days to have CRC that had not been treated (retrospective
element), were approached about volunteering for the
study. The participating centres were Repatriation General
Hospital (Daw Park, South Australia), Flinders Medical
Centre (Bedford Park, South Australia), Academic Medical
Centre (Amsterdam, The Netherlands) and Flevo Hospital
(Almere, The Netherlands). Following enrolment, cases
were excluded if the scheduled colonoscopy was cancelled
or if insufficient blood was available.
Clinical procedures
Venous blood was collected into two 9mL K3EDTA
Vacuette tubes (Greiner Bio-One, Frickenhausen, Germany)
from subjects either prior to them being sedated for
colonoscopy but after consumption of bowel preparation
solution, or prior to preparation for surgery but following
colonoscopic diagnosis. A second sample was obtained
Pedersen et al. BMC Cancer (2015) 15:654
from 26 CRC cases one month or more after surgery.
Blood tubes were kept at 4 °C until commencing plasma
processing. Plasma was prepared within 4 hours of blood
collection by centrifugation at 1,500 g for 10 minutes at
4 °C (no braking), followed by retrieval of the plasma
fraction and a repeat centrifugation. The resulting plasma
was stored at -80 °C. Frozen plasma samples were shipped
on dry ice to CGT and stored at -80 °C until testing.
No study-wide control of colonoscopy or pathology
procedures or quality was undertaken as the study aimed
to assess marker performance relative to outcomes determined in usual clinical practice. All procedures were
performed by hospital-accredited specialists and so met
site-specific standards for sedation, monitoring, imaging,
and equipment. Histopathology and staging of neoplasia
used routine procedures at each clinical site. Cases were
excluded if any data crucial to clinical diagnosis was not
obtainable, e.g. if colonoscopy was incomplete.
Pathological classification
An independent physician assigned diagnosis for all cases
used in this study on the basis of colonoscopy, surgical
and histopathological findings. CRC was staged according
to AJCC 7th Edition [18]. Advanced adenoma was defined
as adenoma with any of the following characteristics:
(a) ≥ 10 mm in size, (b) >20 % villous change, (c) high
grade dysplasia, or (d) serrated pathology. Cases with more
than two tubular adenomas or stage 0 cancer were also
classified as advanced adenoma. Non-advanced adenoma
refers to those not meeting the characteristics of an advanced adenoma. Hyperplastic polyps were classed as
non-neoplastic pathologies. Where multiple pathologies
were present, the most advanced neoplasm was used as
the principal diagnosis. Location of the principal neoplasm was defined as that of the most advanced lesion
in a patient with multiple neoplasms. Where multiple
non-neoplastic diagnoses were present, the principal
diagnosis was allocated in the following hierarchy (descending): inflammatory bowel disease (IBD), hyperplastic
polyp, angiodysplasia, haemorrhoids, diverticular disease.
Test method
All plasma samples of at least 3.9mL were assayed for
the presence of methylated BCAT1 and IKZF1 DNA at
CGT’s laboratories by trained and qualified staff blinded
to clinical results (see Additional file 1 for details). Samples were analysed in batches of 22 clinical samples and
two process controls. Batches were loaded on a QIASymphony SP instrument (Qiagen, Hilden, Germany) and
cell-free DNA was extracted using a QIASymphony
Circulating Nucleic Acid Kit (Qiagen, Hilden, Germany) according to manufacturer’s instructions (Additional file 1).
Page 3 of 11
The extracted DNA was bisulphite-converted using
the EpiTect Fast Bisulfite Conversion kit (Qiagen) and
QIACube instrument (Qiagen) as recommended by manufacturer but with minor modifications (see Additional file 1).
The resulting bisulphite-converted DNA was analysed as
three replicates in a triplex real-time qPCR assay (ACTB
control, methylated BCAT1 and IKZF1) performed on a
Roche LightCycler 480 Model II instrument (see Additional
file 1). A sample was deemed positive if at least one qPCR
replicate was positive for either BCAT1 or IKZF1 DNA
methylation; no cycle threshold (Ct) value cut-offs were applied. Each PCR plate included three no-template control
samples and a standard curve based on 0-2ng bisulphite
converted fully methylated human DNA (Merck-Millipore,
MA, United States) prepared in a background of nucleasefree water (Promega, WI, United States). The mass of
methylated BCAT1 and IKZF1 DNA in each plasma
specimen was determined from the batch specific standard
curve. The level of methylation was expressed as the total
mass of methylated (BCAT1 plus IKZF1) DNA as a
percentage of the total amount of recovered DNA per
processed specimen.
Statistical analyses
Subjects were recruited until at least 100 cancer cases
had been identified (keeping 95 % CI of sensitivity estimates to less than 20 %) with at least 25 cases at each of
stages I-III (to enable determination of the relationship
between positivity rate and stage). The main outcome
measure was positivity rate by diagnosis. GraphPad online
scientific software tool, was used to calculate 95 % confidence intervals
(binomial distribution assumed), Chi-square values (using
2x2 contingency tables without Yates’ correction) and
McNemar’s test. Linear weighted Kappa statistic and odds
ratios were calculated using www.vassarstats.net and
www.medcalc.org/calc/odds_ratio.php, respectively.
Analysis of potential confounding co-variables was
performed using a logistic generalised linear model fitted
to a binary positivity variable (R package version 3.1.2) or
by using a 2-sample z-test (two-tailed, 95 % significant level,
/>on sample proportions (positive results observed in a given
sample size). Continuous variables included age and DNA;
dichotomous variables included smoking status, gender,
and family CRC history.
An ANOVA Chi-square test (R version 3.1.2) was performed on assay positivity rates corrected for stage distribution in proximal and distal cancers using a generalised
linear model with a logistic regression model fitted to two
covariate models including stage and lesion, or lesion only.
The log values of the percentages of methylated BCAT1
and IKZF1 DNA measured in amount of DNA retrieved
Pedersen et al. BMC Cancer (2015) 15:654
per processed specimens were used to create empirical
density plots for three clinical classes: non cancer (all
pathologies minus CRC cases), early stage cancer (Stage
I + II) and late stage cancer (Stage III + IV). A minus infinity
value was assigned to all cases with no methylation signal,
whereas a Gaussian distribution was assumed for all nonzero values. By fitting Gaussian distribution curves to the
empirical density plots, relative risk was calculated as the
ratio of the conditional probability for early or late stage
cancer compared to non-cancer based on the equation
PðX¼1jY¼1Þ
P11
Pðx¼0jY¼1Þ ¼ P01 , where X = 1 means cancer, X = 0 means no
cancer and Y is the test result (positive (Y = 1) or negative
(Y = 0)) at a given threshold value.
Reported p-values are 2-tailed and values <0.05 were
considered statistically significant.
Page 4 of 11
Results
Study subjects and cases
Subjects were recruited from the Australian sites during
the period September 2011 to May 2014 and from Dutch
sites during July 2011 until September 2013 (see Additional
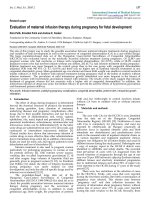
file 2 for details). Figure 1 summarises the disposition of
volunteers from initial approach through to diagnosis, including the reasons for exclusion or withdrawal. Sufficient
plasma was collected prospectively as per protocol, i.e. following ingestion of bowel preparation but prior to colonoscopy, for almost all recruits (2078 of 2105, 99 %). Table 1
shows age and gender relative to principal diagnosis. Diagnoses in the 27 retrospective cases were 21 with cancer, 2
with diverticular disease, 1 with advanced adenoma, 1 with
benign polyps and 2 with no evidence of pathologies.
Fig. 1 Disposition and outcomes of study volunteers approached for study inclusion. HGD: high-grade dysplasia, LGD: low-grade dysplasia,
TA: tubular adenoma
Pedersen et al. BMC Cancer (2015) 15:654
Page 5 of 11
Table 1 Demographic details for all eligible volunteers
Principal Diagnosis
Total cases
1
No Neoplasia
Normal colon
2
Age (years)
Females
Males
N (%)
~
x 4 ðmin‐max Þ
N (%), ~
x age
N (%), ~x age
2105
62 (33 - 90)
973 (46), 61
1132 (54), 63
1291 (61)
61 (33 - 86)
673 (52), 60
618 (48), 61
452 (21)
58 (40 - 85)
259 (57), 57
193 (43), 60
Non-neoplastic pathology
778 (37)
63 (40 - 86)
382 (49), 64
396 (51), 63
IBD
61 (3)
51 (33 - 86)
32 (53), 51
29 (48), 51
Adenoma
685 (33)
64 (40 - 85)
246 (36), 63
439 (64), 64
Non advanced
346 (17)
65 (40 - 85)
130 (38), 64
216 (62), 65
Advanced3
339 (16)
63 (41 - 85)
116 (34), 62
223 (66), 64
129 (6)
69 (37 - 90)
54 (42), 68
75 (58), 69
Stage I
29 (1)
64 (45 - 86)
13 (45), 62
16 (55), 66
Stage II
42 (2)
72 (46 - 90)
17 (41), 75
25 (60), 72
Stage III
40 (2)
69 (39 - 88)
16 (40), 69
24 (60), 69
Stage IV
16 (1)
66 (37 - 88)
7 (44), 67
9 (56), 65
Unstaged
2 (0.1)
71 (57 - 85)
1 (50), 57
1 (50), 85
Cancer
1
All non-neoplastic cases, i.e. excluding only cases with adenomas or cancer. 2Including polyps (hyperplastic, unspecified, other polyps), angiodysplasia, haemorrhoids
and diverticular disease. Excluding inflammatory bowel disease (IBD), which is shown separately. 3Includes two stage 0 (i.e. non-invasive) cancers. 4 x~; the median value
Cancer was the principal diagnosis in 6 % of all enrolled
study subjects (129 of 2105 recruits) while adenoma
(including stage 0 cancer) was diagnosed in 33 % of the
recruits. Non-neoplastic pathologies (including IBD) were
diagnosed in 40 % while 21 % recruits (452) showed no
evidence of pathology in the colon or rectum. These
phenotype frequencies reflect the recruitment strategy,
which was designed to capture cases with a broad range of
pathologies including all stages of neoplasia. More males
(53.7 %) than females were recruited and more cancer patients were male (58.1 %) as would be expected [19].
Assay performance estimates
The two-marker blood test was run successfully (i.e.
meeting minimum quality control criteria) on 2127
samples, with 26 of these blood samples obtained after
surgical resection of cancers. Table 2 shows the number of
cases positive by one or both methylation markers according to diagnosis. Of the 129 cancer cases, 57 % were
methylation positive for BCAT1 and 48 % for IKZF1, with
66 % methylation positive by either gene. The true positive
rate increased with stage for each marker and for the combined two-marker blood test (either methylation marker
positive). Sensitivity estimates for the two-marker blood
test for detection of earlier stage cancer (I or II) was 56 %
(95 % CI: 44–68) and for later stage cancer (III + IV) was
79 % (95 % CI: 66–88), p = 0.009.
By contrast, sensitivity estimates for adenomas of any
type were low, at 6 % (95 % CI: 4–9) for advanced adenoma and 7 % (95 % CI: 4–10) for non-advanced adenoma.
These estimates were not significantly different compared
to positivity rates in those with a normal colon or benign
pathology (Table 2, p > 0.05).
Specificity estimates for the combined two-marker blood
test were 94 % (95 % CI: 93–95, 1288 non-neoplastic cases)
to 95 % (95 % CI: 92–97, 450 cases with no evidence of
disease).
Concordance between methylation markers
Methylated IKZF1 DNA was typically detected at a lower
rate in blood compared to methylated BCAT1 DNA across
all diagnostic sub-classes. Concordance between the two
markers is shown for selected clinical phenotypes in Table 3.
For those with cancer, 51/129 (40 %) were concordant and
34/129 discordant (26 %), with BCAT1 detecting most of
the discordant cases (23/34, 68 %) (McNemar’s, p = 0.06).
The linear weighted Kappa statistic as a measure of agreement was 0.476 for cancer cases (95 % CI: 0.327–0.625).
In subjects with no evidence of pathologies in colon and
rectum, only one case of the 24 positive results showed
concordance between the methylation markers with
BCAT1 being responsible for most (21/23) of the discordant cases (McNemar’s, p = 0.0002). Linear weighted Kappa
measure of agreement was 0.07 (95 % CI: 0–0.213).
Other factors related to marker positivity
The influence of recruitment site, age, gender, smoking
status, family history of CRC and amount of cell free
DNA on assay positivity was assessed. Recruitment site
(see Additional file 2), gender, family history of CRC
(see Additional file 3) and age (see Additional file 4) were
not significant predictors of assay positivity (p > 0.05).
Pedersen et al. BMC Cancer (2015) 15:654
Page 6 of 11
Table 2 Methylation marker performance by clinical findings, including selected sub-categories
Most advanced findings
No. (%)
ALL CASES
Positivity Counts (%); 95 % CI
2101
Cancer
BCAT1
IKZF1
Either marker
181 (9); 8-10
89 (4); 3-5
204 (10); 8-11
OR (95 % CI)1
X2
129 (6)
74 (57); 48 - 66
62 (48); 39 - 57
85 (66); 57 - 74
34 (20 - 59)**
241**
Stage I
29 (22)
7 (24); 10 - 44
8 (28); 13 - 47
11 (38); 21 - 58
11 (5 - 26)**
43**
Stage II
42 (33)
26 (62); 46 - 76
17 (40); 26 - 57
29 (69); 53 - 82
40 (18 - 86)**
16**
Stage III
40 (31)
27 (68); 51 - 81
22 (55); 38 - 71
29 (73); 56 - 85
47 (21 - 105)**
172**
Stage IV
16 (12)
13 (81); 54 - 96
15 (94);70 - 100
15 (94);70 - 100
266 (34-2101)**
158**
Unstaged
2 (2)
1 (50); 1 - 99
0 (0); 0 - 80
1 (50); 1 - 99
18 (1 - 293)**
8*
Early Stage (I + II)
71 (55)
33 (46); 35 - 59
25 (35); 24 - 47
40 (56); 44 - 68
23 (12 - 43)**
148**
Late Stage (III + IV)
56 (43)
40 (71); 58 - 83
37 (66); 52 - 78
44 (79); 66 - 88
65 (30 - 139)**
230**
2
Adv. adenoma
338(16)
16 (5); 3 - 8
7 (2); 1 - 4
20 (6); 4 - 9
1.1 (0.6 - 2)
0.1
HGD
32 (9)
2 (6); 1 - 21
1 (3); 0.1 - 16
2 (6); 0.1 - 21
1.2 (0.3 - 5)
0.1
TVA3
144(43)
7 (5); 2 - 10
0 (0); 0 - 20
7 (5); 2 - 10
0.9 (0.4 - 2)
0.1
≥10mm4
107(32)
3 (3); 1 - 8
4 (4); 1 - 9
5 (5); 2 - 11
0.9 (0.3 - 2)
0.1
≥3 TAs (<10mm)
34 (10)
4 (12); 3 - 27
0 (0); 0 - 10
4 (12); 3 - 27
2.4 (1 - 7)
2.4
Serrated Adenoma
19 (6)
0 (0); 0 - 20
2 (11); 2 - 52
2 (11); 2 - 52
2 (0.5 - 10)
0.9
Non adv. adenoma
346(16)
23 (7); 4 - 10
2 (1); 0.1 - 2
23 (7); 4 - 10
1.3 (0.7 - 2)
0.6
No neoplasia
838(40)
46 (6); 4 - 7
15 (2); 1 - 3
52 (6); 5 - 8
1.2 (0.7 - 2)
0.4
IBD
61 (3)
3 (5); 1 - 14
0 (0); 0 - 6
3 (5); 1 - 14
0.9 (0.3- 3)
0.01
Non neoplastic polyps6
296(14)
16 (5); 3 - 9
4 (2); 0.4 - 4
18 (6); 4 - 9
1.1 (0.6 - 2)
0.2
5
Hemorrhoids
288(60)
14 (5); 3 - 8
6 (2); 1 - 4
16 (6); 3 - 9
1.0 (0.5 - 2)
0.02
Angiodysplasia
11 (0.5)
2 (18); 2 - 52
0 (0); 0 – 28
2 (18); 2 - 52
4 (1 -19)
3
Diverticular disease
182(38)
11 (6); 3 - 11
5 (3); 1 - 6
13 (7); 4 - 12
1.3 (0.7 - 3)
0.8
Normal colon/rectum
450(21)
22 (5); 3 - 7
3 (1); 0 - 2
24 (5); 3 - 8
1
1
1
2
2
Calculation of Odds Ratios (OR) or Chi-square (X ) values against normal colon/rectum; *P-values <0.05, **P-values <0.001; Advanced adenoma including Stage 0
cancers; 3Excluding HGD; 4no HGD or TVA; 5Inflammatory bowel disease 6Hyperplastic, unspecified and other polyps
HGD high-grade dysplasia, TVA tubulovillous adenoma, TA tubular adenoma, IBD inflammatory bowel disease
For 286 cases with known smoking habits, 62 % were
current smokers. Excluding the 16 CRC cases that smoked,
11/165 smokers were methylation positive compared to
11/105 non-smokers (Fisher’s p-value = 0.362).
The majority of processed specimens had cell free DNA
amounts of 1.6-2.5ng per mL plasma (95 % CI). There was
no significant difference in levels of cell-free DNA between
all subjects without CRC and cancer cases of stages I to III,
however some stage IV cancer cases had a significantly
higher amount of DNA (see Additional file 5, p > 0.0001).
Excluding cases with cancer, the average amount of cellfree DNA was 2.1ng/mL (95 % CI: 1.9-2.2). Higher DNA
amounts (>3ng/mL) were observed in 192 of 1972 nonCRC cases (9.7 %), of which 19 (10 %) were two-marker
blood test positive. Increased DNA amounts was associated
with an increased chance of a positive result, as the odds
ratio for positivity increased 2.7-fold for each increment of
one in log (DNA pg/mL), p value <0.0001.
Table 3 Methylation marker concordances for selected
phenotypes
Distal versus proximal disease
No. BCAT1/IKZF1 positive
P-value1
The estimated positivity rates for proximal (60 %) and distal
(67 %) cancers were not significantly different (Chi-square
test, p value = 0.603). Cancer location, corrected for stage
distribution, did not influence detection of markers in
blood (Additional file 3, p value = 0.555).
Most advanced findings
No.
+/+
+/-
-/+
-/-
Cancer
129
51
23
11
44
0.059
Advanced adenoma
338
3
13
4
318
0.052
Non-neoplastic pathologies
838
9
37
6
786
<0.0001
Tumour invasiveness and detectability
Normal colon/rectum
450
1
21
2
426
0.0002
The relationship between detection of methylated BCAT1
and IKZF1 DNA in blood and degree of invasiveness (by
1
McNemar t-test
Pedersen et al. BMC Cancer (2015) 15:654
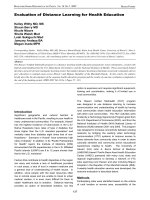
pT stage) for cancers is shown in Fig. 2. Although not statistically significant (ANOVA with Tukey post-hoc test), a
positive trend was observed between positivity rate and
pT stage (degree of invasion) for each marker, and the
two-marker blood test.
Quantitative testing and cancer stage prediction
As per study protocol, the two-marker blood test performance estimates have been qualitatively reported as any detectable signal for methylated BCAT1 and/or IKZF1 DNA.
However, positive qPCR methylation results can also be reported quantitatively as the fraction of methylated BCAT1
plus IKZF1 DNA measured in the total yield of DNA isolated per specimen. We modelled the relationship between
disease severity (non-cancer, early stage cancer and late
stage cancer) and the fraction of methylated BCAT1
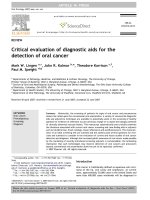
and IKZF1 DNA. Figure 3a shows that the fraction of
methylated BCAT1 and IKZF1 DNA in blood increased
as a function of degree of invasiveness. The generated
models were used to calculate the relative risk of disease
(early stage or late stage cancer) compared to non-cancer
for a given methylation fraction value. The models indicated a low relative risk of having cancer if no methylation
was detected. For a specimen containing approximately
5 % methylated BCAT1 and IKZF1 DNA the models estimate a relative risk of 5 for having early stage cancer
(Fig. 3b). On the other hand, the relative risk of being
late stage cancer given a specimen with approximately
40 % methylation is 125.
Marker methylation levels after resection
Of the 129 cancer cases, a post-resection sample was
available for 12 of the 85 cases with a positive two-marker
blood result at initial diagnosis, and for 14 of the 44 cases
with a negative result at diagnosis. As can be seen in
Page 7 of 11
Table 4, ten of twelve initially positive cases became negative after resection. We note that the BCAT1 and IKZF1
methylation levels <5 % are values obtained from extrapolation due to these methylation signals being below the
linear range of the qPCR assay. Of the 14 cases that were
negative at diagnosis, all but one remained negative after
resection (data not shown).
Discussion
By estimating the true- and false-positive rates of the
two-marker blood test for screen-relevant stages of colorectal neoplasia, we have been able to determine that a
blood test detecting methylated BCAT1 and IKZF1 DNA
facilitates identification of cases with CRC relative to other
clinical states encountered in the colon and rectum.
We estimated an overall sensitivity for CRC of 66 %
(n = 129, 95 % CI: 57–74), with better detection of later
versus earlier stage cancers (79 % compared to 56 %).
This overall sensitivity is within the upper half of the reported sensitivity range of 37–79 % for guaiac FOBT
(gFOBT) in populations such as we have studied here or
in true screening populations [20]. Despite low sensitivity
in the original gFOBTs, RCTs still showed effectiveness of
the technology in reducing mortality from CRC [3, 4]. In a
micro-simulation model to estimate gFOBT sensitivity for
CRC from the first three RCTs it was estimated that
gFOBT sensitivity was 51 % for the stages of clinical diagnosis and 19 % for early stage cancer [21]. This implies an
adequate sensitivity of the two-marker blood test for reducing CRC mortality if used as a screening test but this prediction requires validation in true screening populations.
The two-marker blood test has a low sensitivity for advanced adenomas and should not be expected to impact on
CRC incidence as seen with certain faecal immunochemical
Fig. 2 Marker positivity rates versus cancer invasiveness. The proportion (%) of cancer cases (pT staging) positive for BCAT1 (white bars), IKZF1
(grey bars) or either marker (black bars)
Pedersen et al. BMC Cancer (2015) 15:654
Page 8 of 11
A
Non-cancer
Early stage cancer
0.25
Density
0.20
Late stage cancer
0.15
0.10
0.05
0.00
-4
-2
0
2
4
6
Log(methylated fraction per specimen)
B
Fraction of methylated BCAT1 and IKZF1
DNA in circulation
Log(methylated fraction)
(% recovered DNA per specimen)
0
0.02%
5.70%
14.80%
38.40%
100%
-4
1.737
2.693
3.649
4.605
Relative risk compared to non-cancer
Early Stage
Late Stage
0.02
1.03
6.35
12.2
25.72
59.28
0.01
1.04
13.44
37.56
125.73
502.54
Fig. 3 Relative risk prediction based on quantitative assessment of methylation. a The amount of methylated BCAT1 and IKZF1 as a percentage of
total DNA per specimen was used to compute empirical density plots (thin lines) and fitted Gaussian curves (bold lines) from non-cancers (green),
early stage cancer (yellow, stage I + II) and late stage cancer (red, stage III + IV). b Relative risk calculations for a given value of methylated BCAT1
and IKZF1 DNA. The minus infinity (-∞) is the log of no methylation (zero values)
tests (FIT) which have sensitivity for advanced adenomas in
the range 29–45 % [22, 23].
Impact of a screening test on population mortality
from CRC is not dependent only on test accuracy but
also on participation rates. Given the stated preference
of a typical screening population for the idea of a blood
test over a faecal test [8], including a subset who had
already undertaken screening with FIT [9], one could
predict that even if a lesser sensitivity were to be confirmed for the two-marker blood test when validated in
true screening populations, a participatory advantage might
counterbalance this.
The earlier estimates of sensitivity for cancer and advanced adenoma for methylated Septin 9 (SEPT9) were
Table 4 Blood methylation levels in 12 CRC cases positive before and after tumour resection
Proportion of methylated BCAT1 and IKZF11 (% of total yield)
Case characteristics
Tumour location
Stage
Before resection
After resection
Δ Days
Sigmoid
l
<0.00001
0
140
Splenic flexure
l
<0.00001
0
48
Caecum
llA
1.8
0
115
Ascending
llA
0.7
<0.00001
70
Sigmoid
llA
5.6
0
162
Sigmoid
llA
2.6
0
64
Ascending
llA
1.7
0
83
Ascending
llA
1.4
0
39
Caecum
lllA
5.0
0
58
Rectum
lllA
0.8
0
47
Ascending
lllB
0.9
0
50
Sigmoid
lllC
0.6
0.6
157
1
The lower limit of the linear range for the qPCR assay was 100pg per reaction. The average DNA amount per reaction was 2 ng, thus methylation levels
estimated to be <5% but above zero are extrapolated and most likely inaccurate
Pedersen et al. BMC Cancer (2015) 15:654
comparable to those seen with our two-marker blood
test [12, 24–26], although a large-scale study in a screening population returned a cancer sensitivity of 51 % [13].
The reported observed sensitivity for stage I cancer of
36 % was almost identical to ours (38 %), while neither
study achieved a sensitivity of 10 % for advanced adenomas. Whether there is complementarity of our markers
with SEPT9 for cancer detection is unclear at present
and warrants study.
To determine whether this apparent lower sensitivity
for early stage cancer and adenomas was a function of the
assay or a biologically-determined issue, we examined the
relationship of positivity to tumour depth of invasion and
modelled the biomarker mass relative to risk for different
stages of neoplasia. A trend was observed between assay
positivity and degree of cancer invasiveness (pT stage),
which was not affected by the colonic location or other
potential variables examined. By modelling the stage of
neoplasia relative to marker mass, we show the potential
for using the measured percentage of methylated BCAT1
and IKZF1 DNA in blood to estimate the relative risk of
disease severity. Given that the assay is sensitive at the
limits of detection to 6 DNA copies per mL of plasma
(Additional file 1), some stage I cancers might escape detection due to very low amount of tumour-derived DNA
reaching the blood [27, 28]. As adenomas are noninvasive, this might account for a biological limitation in
the capacity of blood tests to detect adenomas.
If methylated DNA biomarkers are fundamentally disadvantaged compared to FIT in detection of advanced
adenomas, then what is their place in CRC screening?
Where programs seek to detect just a proportion of cancers with high efficiency and low colonoscopy rates [29], a
blood DNA test might be acceptable as a frontline screening test if a participatory advantage can be demonstrated
in practice. It seems more likely that at the present moment, blood DNA tests will be applicable to people where
an FOBT is inappropriate due to bleeding benign lesions
or as a second line rescue strategy for engaging those in
screening who otherwise reject the faecal test.
The false-positive rate for the two-marker blood test
provides insight into specificity and the factors that might
influence it, and hence cost. Our observed specificity was
94–95 %, which was slightly better than the reported 91 %
for SEPT9 [13]. Smoking, family history of CRC, gender
and age were not significant predictors of assay positivity.
There was no significant difference in DNA yields between
non-CRC and cases with stage I-III cancers, however
higher yields were observed for some stage IV cancers as
reported previously [12]. Further, we did observe an increase in assay positivity in non-neoplastic cases where recovered DNA exceeded 3ng/mL. Given the results of the
technical assessment (Additional file 1), it seems likely that
the false-positives (as determined by colonoscopy) reflect
Page 9 of 11
a true appearance of methylated BCAT1 and IKZF1 DNA.
Longitudinal follow-up studies are required to understand
whether the low false-positive rate in healthy cases reflects
chance events (i.e. methylation of BCAT1 DNA especially)
of no consequence, or an early indication of colorectal
neoplasia and/or other extra-colonic cancers.
The biological functions of BCAT1 and IKZF1 are not
well understood, but both genes are involved in tumour
growth and invasiveness [30, 31]. Both genes have been
demonstrated to be hypermethylated in several cancers
including CRC [10, 32]. Emerging data imply that IKZF1
is a crucial player in proper regulation of proliferation
and differentiation by controlling the activity of a small
set of genes including notch [33–36] which plays a crucial role in the self-renewing process of colon crypt stem
cells [37, 38].
The disappearance of circulating methylated BCAT1
and IKZF1 DNA after tumour resection in 10 of 12 cancer cases shows that detection of methylated BCAT1 and
IKZF1 DNA in the blood reflects the presence of CRC
rather than a risk of developing CRC. The half-life of
free DNA in the blood is reportedly short at ~2 hours
[39], but 2 CRC cases remained positive for methylation
even 5 months after resection. Longer follow-up is
needed in the two cases with persisting methylation signal to understand the reason, as it is possible they were
not cured of their cancer. Similar to observations made
for other CRC methylation markers, these data suggest
that the two-marker blood test may be useful to monitor
tumour recurrence and adequacy of resection and/or
initial therapy [40].
There are several additional limitations with this study.
The estimated sensitivities and specificities might not
apply to screen-detected lesions, and comparison to
other non-invasive screening tests has yet to be undertaken in this context. Actual test positivity rates in a
true screening population cannot be reliably estimated
from this study and so the consequences for colonoscopy
follow-up rates are uncertain. As with all other DNA tests
under consideration for CRC screening, how specific they
are for colorectal as opposed to other organ cancers remains uncertain and long-term follow-up of false-positive
cases is required.
Conclusion
Accuracy of the two-marker blood test approximates
that of the less-sensitive gFOBT [19]. Consequently it is
now justifiable to proceed to prospective evaluation in a
true screening population relative to FIT. At present, the
likely use of this two-marker blood test for screening
seems most appropriate in a rescue strategy for those refusing more sensitive RCT-proven methods such as FIT,
flexible sigmoidoscopy or colonoscopy.
Pedersen et al. BMC Cancer (2015) 15:654
Additional files
Page 10 of 11
Additional file 2: Recruitment details for participating clinical sites.
Table S3. Distribution of recruits from the four hospitals participating in
the study. (PDF 97 kb)
Acknowledgements
The authors would like to thank Jane Upton, Libby Bambacas, and Susie
Byrne at Flinders Centre for Innovation in Cancer (FCIC) for their assistance in
recruitment of study subjects and blood collections. We thank Jo Osborne
(FCIC) for managing data and maintaining the study database. The authors
thank Rob Dunne from Commonwealth Scientific and Industrial Research
Organisation (CSIRO) for his valuable input on statistical analyses. This study
received a grant contribution from National Health and Medical Research
Council of Australia (NHMRC grant APP1065439).
Additional file 3: Co-variable analysis. Table S4. Gender. Table S5.
Family CRC history. Table S6. Assay positivity rates relative to tumour
location. The proportion of positivity assay results was modelled (R package
version 3.1.2) using a generalised linear model (glm) with a logit link (logistic
regression model) fitted to two covariate models including stage and lesion
or stage only. An ANOVA with a Chi-square test demonstrated that the two
models were not statistically different (p value = 0.555). (PDF 88 kb)
Author details
1
Clinical Genomics Pty Ltd, Sydney, Australia. 2Flinders Centre for Innovation
in Cancer, Flinders University of South Australia, Adelaide, Australia. 3Bowel
Health Service, Repatriation General Hospital, Adelaide, Australia. 4Academic
Medical Centre, Amsterdam, The Netherlands. 5Flevo Hospital, Almere, The
Netherlands.
Additional file 1: Detailed assay protocol. Table S1. DNA sequences
for the oligonucleotides used in the 2-marker blood test qPCR assay.
Table S2. qPCR cycling conditions. (PDF 148 kb)
Additional file 4: Age versus assay positivity. Figure S1. The
proportion of positive blood results were calculated for <50, 50-54, 55-59,
60-64, 65-69, 70-74, 75-80 and >80 years of age. The
binomial standard
pffiffiffiffiffiffiffiffiffiffiffiffiffiffiffiffiffiffi
deviation was calculated using the formula SEp ¼ pð1‐pÞ=n, where p =
proportion of positive results, n = sample size (ycalculation.
com/statistics/standard-error-sample-proportion.php). A two-sample Z-test
two-tailed, 95 % significant level was performed on the terminal groups less
than 50yrs of age versus more than 80yrs of age (the age span in study
cohort) and 50-54yrs vs 75-80yrs (screen-eligible age) based on the assumption
that if there was an age trend then that would be most pronounced in
‘young’ versus ‘old’. (A) non-neoplastic controls (n = 1288); (B) cancer (n = 129).
(TIFF 2521 kb)
Additional file 5: Circulating cell-free DNA levels versus assay
positivity. Figure S2. Cumulative plots for DNA amount (log2, ng/mL), for
(A) non-cancer and Stage I-III and (B) Stages I to III as well as the individual
cancer stages (I to IV). There was no significant difference in DNA amounts
between non-cancer and cancer stages I to III (Kolmogorov-Smirnov test, max
deviation: 0.035, p = 0.1785), whereas a number of stage IV samples had high
DNA yields (max deviation = 0.513, p value = 0.0001). (TIFF 2412 kb)
Abbreviations
CRC: Colorectal cancer; BCAT1: Branched chain amino-acid transaminase 1;
IKZF1: IKAROS family zinc finger 1; qPCR: quantitative PCR; PCR: Polymerase
chain reaction; HGD: High-grade dysplasia; LGD: Low-grade dysplasia;
TVA: Tubulovillous adenoma; TA: Tubular adenoma; IBD: Inflammatory bowel
disease; RCT: Randomised controlled trial; FOBT: Faecal occult blood test;
FIT: Faecal immunochemical test; Ct: Cycle threshold.
Competing interests
Flinders Medical Centre and Academic Medical Centre received partial
funding from Clinical Genomics Technologies Pty. Ltd (CGT). CGT provided
salaries for LCL, SKP, RTB, AM and DHM and a consultancy fee for GPY. The
specific roles of these authors are articulated in the author contribution
section. LCL, RTB, AME and SKP are inventors on one or more patent
applications covering the methylation DNA biomarkers described in this
paper.
Authors’ contributions
SKP coordinated assay development, planned and documented the data
plan, coordinated molecular testing, contributed to data analysis and
manuscript preparation. ELS oversaw recruitment and collection of clinical
data at the Australian hospital and contributed to data analysis and
manuscript preparation. RTB, DHM and AME contributed to method
development, optimisation and automation and provided qPCR
experimental data. SCVD coordinated and managed recruitment at the
Dutch hospitals. MWM contributed to recruitment, sample choice and
provision. SRC contributed to conception of the study, sample choice and
provision. GG and DM audited clinical data and verified case classifications.
LCL provided ongoing input into data interpretation and project directions.
ED contributed to conception of the study, clinical interpretation, sample
choice and provision. GPY contributed to overall project design, clinical
interpretation, sample choice and provision and manuscript preparation.
All authors read and approved the final manuscript.
Received: 1 March 2015 Accepted: 1 October 2015
References
1. Siegel R, Ma J, Zou Z, Jemal A. Cancer statistics, 2014. CA Cancer J Clin.
2014;64:9–29.
2. Mandel JS, Bond JH, Church TR, Snover DC, Bradley GM, Schuman LM, et al.
Reducing mortality from colorectal cancer by screening for fecal occult blood.
Minnesota Colon Cancer Control Study. N Engl J Med. 1993;328:1365–71.
3. Kronborg O, Fenger C, Olsen J, Jørgensen OD, Søndergaard O. Randomised
study of screening for colorectal cancer with faecal-occult-blood test.
Lancet. 1996;348:1467–71.
4. Hardcastle JD, Chamberlain JO, Robinson MH, Moss SM, Amar SS, Balfour
TW, et al. Randomised controlled trial of faecal-occult-blood screening for
colorectal cancer. Lancet. 1996;348:1472–7.
5. Mandel JS, Church TR, Church BJH, Bond EF, et al. The Effect of Fecal
Occult-Blood Screening on the Incidence of Colorectal Cancer. N Engl J
Med. 2000;343:1603–7.
6. Holme Ø, Løberg M, Kalager M, Bretthauer M, Hernán MA, Aas E, et al. Effect
of Flexible Sigmoidoscopy Screening on Colorectal Cancer Incidence and
Mortality: A Randomized Clinical Trial. JAMA. 2014;312:606–15.
7. Australian Institute of Health, Welfare. National Bowel Cancer Screening
Program monitoring report 2012-2013. Cancer Series. 2014;81:1–142.
8. Adler A, Geiger S, Keil A, Bias H, Schatz P, deVos T, et al. Improving compliance
to colorectal cancer screening using blood and stool based tests in patients
refusing screening colonoscopy in Germany. BMC Gastroenterol. 2014;14:1–8.
9. Osborne JM, Wilson C, Moore V, Gregory T, Flight I, Young GP. Sample
preference for colorectal cancer screening tests: Blood or stool? OJPM.
2012;2:326–31.
10. Kibriya MG, Raza M, Jasmine F, Roy S, Paul-Brutus R, Rahaman R, et al. A
genome-wide DNA methylation study in colorectal carcinoma. BMC Med
Genomics. 2011;4:50.
11. Øster B, Thorsen K, Lamy P, Wojdacz TK, Hansen LL, Birkenkamp-Demtröder K,
et al. Identification and validation of highly frequent CpG island hypermethylation
in colorectal adenomas and carcinomas. Int J Cancer. 2011;129:2855–66.
12. deVos T, Tetzner R, Model F, Weiss G, Schuster M, Distler J, et al. Circulating
Methylated SEPT9 DNA in Plasma Is a Biomarker for Colorectal Cancer. Clin
Chem. 2009;55:1337–46.
13. Church TR, Wandell M, Lofton-Day C, Mongin SJ, Burger M, Payne SR, et al.
Prospective evaluation of methylated SEPT9 in plasma for detection of
asymptomatic colorectal cancer. Gut. 2014;63:317–25.
14. Mitchell SM, Ross JP, Drew HR, Ho T, Brown GS, Saunders NF, et al. A panel
of genes methylated with high frequency in colorectal cancer. BMC Cancer.
2014;14:54.
15. Pedersen SK, Baker RT, McEvoy A, Murray DH, Thomas M, Molloy PL, et al.
A two-gene blood test for methylated DNA sensitive for colorectal cancer.
PLoS One. 2015;10:e0125041.
16. Allison JE, Fraser CG, Halloran SP, Young GP. Population screening for
colorectal Cancer means getting FIT: The Past, Present, and Future of
colorectal cancer screening using the Fecal Immunochemical Test for
Hemoglobin (FIT). Gut and Liver. 2014;8:117–30.
17. Lord SJ, Irwig L, Simes RJ. When Is Measuring Sensitivity and Specificity
Sufficient To Evaluate a Diagnostic Test, and When Do We Need
Randomized Trials? Ann Intern Med. 2006;144:850–5.
Pedersen et al. BMC Cancer (2015) 15:654
18. Edge SB, Compton CC. The American Joint Committee on Cancer: the 7th
edition of the AJCC cancer staging manual and the future of TNM. Ann of
Surg Oncol. 2010;17:1471–4.
19. Ferlay J, Soerjomataram I, Dikshit R, Eser S, Mathers C, Rebelo M, et al.
Cancer incidence and mortality worldwide: sources, methods and major
patterns in GLOBOCAN 2012. Int J Cancer. 2015;136:E359–86.
20. Whitlock EP, Lin JS, Liles E, Beil TL, Fu R. Screening for colorectal cancer: a
targeted, updated systematic review for the U.S. Preventive Services Task
Force. Ann Intern Med. 2008;149:638–58.
21. Lansdorp-Vogelaar I, van Ballegooijen M, Boer R, Zauber A, Habbema JDF.
A novel hypothesis on the sensitivity of the fecal occult blood test: Results
of a joint analysis of 3 randomized controlled trials. Cancer. 2009;115:2410–9.
22. Imperiale TF, Ransohoff DF, Itzkowitz SH, Levin TR, Lavin P, Lidgard GP, et al.
Multitarget Stool DNA Testing for Colorectal-Cancer Screening. N Engl J
Med. 2014;370:1287–97.
23. Lane JM, Chow E, Young GP, Good N, Smith A, Bull J, et al. Interval fecal
immunochemical testing in a colonoscopic surveillance program speeds
detection of colorectal neoplasia. Gastroenterology. 2010;139:1918–26.
24. Lofton-Day C, Model F, deVos T, Tetzner R, Distler J, Schuster M, et al. DNA
methylation biomarkers for blood-based colorectal cancer screening. Clin
Chem. 2008;54:414–23.
25. Grützmann R, Molnar B, Pilarsky C, Habermann JK, Schlag PM, Saeger HD,
et al. Sensitive Detection of Colorectal Cancer in Peripheral Blood by Septin
9 DNA Methylation Assay. PLoS One. 2008;3:e3759–68.
26. Warren JD, Xiong W, Bunker AM, Vaughn CP, Furtado LV, Roberts WL, et al.
Septin 9 methylated DNA is a sensitive and specific blood test for colorectal
cancer. BMC Med. 2011;9:133.
27. Yong E. Cancer biomarkers: Written in blood. Nature. 2014;511:524–6.
28. Newman AM, Bratman SV, To J, Wynne JF, Eclov NCW, Modlin LA, et al. An
ultrasensitive method for quantitating circulating tumor DNA with broad
patient coverage. Nat Med. 2014;20:548–54.
29. Young GP, Symonds EL, Allison JE, Cole SR, Fraser CG, Halloran SP, et al.
Advances in Fecal Occult Blood Tests: The FIT Revolution. Dig Dis Sci.
2015;60:609–22.
30. Zhang Z, Xu Z, Wang X, Wang H, Yao Z, Mu Y, et al. Ectopic Ikaros
expression positively correlates with lung cancer progression. Anat Rec
(Hoboken). 2013;296:907–13.
31. Tonjes M, Barbus S, Park YJ, Wang W, Schlotter M, Lindroth AM, et al. BCAT1
promotes cell proliferation through amino acid catabolism in gliomas
carrying wild-type IDH1. Nat Med. 2013;19:901–8.
32. Vincent A, Omura N, Hong SM, Jaffe A, Eshleman J, Goggins M. Genome-Wide
Analysis of Promoter Methylation Associated with Gene Expression Profile in
Pancreatic Adenocarcinoma. Clin Cancer Res. 2011;17:4341–54.
33. Yoshikawa R, Yanagi H, Shen C-S, Fujiwara Y, Noda M, Yagyu T, et al. ECA39
is a novel distant metastasis-related biomarker in colorectal cancer. World J
Gastroenterol. 2006;12:5884–9.
34. Javierre BM, Rodriguez-Ubreva J, Al-Shahrour F, Corominas M, Grana O,
Ciudad L, et al. Long-Range Epigenetic Silencing Associates with
Deregulation of Ikaros Targets in Colorectal Cancer Cells. Mol Cancer Res.
2011;9:1139–51.
35. Iacobucci I, Storlazzi CT, Cilloni D, Lonetti A, Ottaviani E, Soverini S, et al.
Identification and molecular characterization of recurrent genomic deletions
on 7p12 in the IKZF1 gene in a large cohort of BCR-ABL1-positive acute
lymphoblastic leukemia patients: on behalf of Gruppo Italiano Malattie
Ematologiche dell'Adulto Acute Leukemia Working Party (GIMEMA AL WP).
Blood. 2009;114:2159–67.
36. Malinge S, Thiollier C, Chlon TM, Dore LC, Diebold L, Bluteau O, et al. Ikaros
inhibits megakaryopoiesis through functional interaction with GATA-1 and
NOTCH signaling. Blood. 2013;121:2440–51.
37. Riccio O, van Gijn ME, Bezdek AC, Pellegrinet L, van Es JH, Zimber-Strobl U,
et al. Loss of intestinal crypt progenitor cells owing to inactivation of both
Notch1 and Notch2 is accompanied by derepression of CDK inhibitors
p27Kip1 and p57Kip2. EMBO. 2008;9:377–83.
38. Noah TK, Shroyer NF. Notch in the Intestine: Regulation of Homeostasis and
Pathogenesis. Annu Rev of Physiol. 2013;75:263–88.
39. Diehl F, Schmidt K, Choti MA, Romans K, Goodman S, Li M, et al. Circulating
mutant DNA to assess tumor dynamics. Nat Med. 2008;14:985–90.
40. Tham C, Chew M, Soong R, Lim J, Ang M, Tang C, et al. Postoperative
serum methylation levels of TAC1 and SEPT9 are independent predictors of
recurrence and survival of patients with colorectal cancer. Cancer.
2014;120:3131–41.
Page 11 of 11
Submit your next manuscript to BioMed Central
and take full advantage of:
• Convenient online submission
• Thorough peer review
• No space constraints or color figure charges
• Immediate publication on acceptance
• Inclusion in PubMed, CAS, Scopus and Google Scholar
• Research which is freely available for redistribution
Submit your manuscript at
www.biomedcentral.com/submit