Patient and physician factors associated with Oncotype DX and adjuvant chemotherapy utilization for breast cancer patients in New Hampshire, 2010-2016
Bạn đang xem bản rút gọn của tài liệu. Xem và tải ngay bản đầy đủ của tài liệu tại đây (731.23 KB, 13 trang )
Schwedhelm et al. BMC Cancer
(2020) 20:847
/>
RESEARCH ARTICLE
Open Access
Patient and physician factors associated
with Oncotype DX and adjuvant
chemotherapy utilization for breast cancer
patients in New Hampshire, 2010–2016
Thomas M. Schwedhelm1, Judy R. Rees2,3, Tracy Onega1,3,4, Ronnie J. Zipkin1, Andrew Schaefer4,
Maria O. Celaya2,3 and Erika L. Moen1,4*
Abstract
Background: Oncotype DX® (ODX) is used to assess risk of disease recurrence in hormone receptor positive, HER2negative breast cancer and to guide decisions regarding adjuvant chemotherapy. Little is known about how
physician factors impact treatment decisions. The purpose of this study was to examine patient and physician
factors associated with ODX testing and adjuvant chemotherapy for breast cancer patients in New Hampshire.
Methods: We examined New Hampshire State Cancer Registry data on 5630 female breast cancer patients
diagnosed from 2010 to 2016. We performed unadjusted and adjusted hierarchical logistic regression to identify
factors associated with a patient’s receipt of ODX, being recommended and receiving chemotherapy, and refusing
chemotherapy. We calculated intraclass correlation coefficients (ICCs) to examine the proportion of variance in
clinical decisions explained by between-physician and between-hospital variation.
Results: Over the study period, 1512 breast cancer patients received ODX. After adjustment for patient and tumor
characteristics, we found that patients seen by a male medical oncologist were less likely to be recommended
chemotherapy following ODX (OR = 0.50 (95% CI = 0.34–0.74), p < 0.01). Medical oncologists with more clinical
experience (reference: less than 10 years) were more likely to recommend chemotherapy (20–29 years: OR = 4.05
(95% CI = 1.57–10.43), p < 0.01; > 29 years: OR = 4.48 (95% CI = 1.68–11.95), p < 0.01). A substantial amount of the
variation in receiving chemotherapy was due to variation between physicians, particularly among low risk patients
(ICC = 0.33).
Conclusions: In addition to patient clinicopathologic characteristics, physician gender and clinical experience were
associated with chemotherapy treatment following ODX testing. The significant variation between physicians
indicates the potential for interventions to reduce variation in care.
Keywords: Oncotype DX, Breast cancer, Adjuvant chemotherapy
* Correspondence:
1
Department of Biomedical Data Science, Dartmouth Geisel School of
Medicine, Lebanon, NH, USA
4
The Dartmouth Institute for Health Policy and Clinical Practice, Lebanon, NH,
USA
Full list of author information is available at the end of the article
© The Author(s). 2020 Open Access This article is licensed under a Creative Commons Attribution 4.0 International License,
which permits use, sharing, adaptation, distribution and reproduction in any medium or format, as long as you give
appropriate credit to the original author(s) and the source, provide a link to the Creative Commons licence, and indicate if
changes were made. The images or other third party material in this article are included in the article's Creative Commons
licence, unless indicated otherwise in a credit line to the material. If material is not included in the article's Creative Commons
licence and your intended use is not permitted by statutory regulation or exceeds the permitted use, you will need to obtain
permission directly from the copyright holder. To view a copy of this licence, visit />The Creative Commons Public Domain Dedication waiver ( applies to the
data made available in this article, unless otherwise stated in a credit line to the data.
Schwedhelm et al. BMC Cancer
(2020) 20:847
Background
Breast cancer (BC) is the leading cause of cancer in
women worldwide and is the second leading cause of
cancer death in women [1]. Hormone receptor (HR)
positive (defined as estrogen receptor and/or progesterone receptor positive), axillary lymph node (LN)
negative BC is the most common subtype in the
United States [2]. The treatment paradigm has shifted
in the past decade for BC, especially for this subtype
[3–5]. Adjuvant chemotherapy had previously been
recommended for all BC patients and resulted in improved mortality rates [6, 7]. However, risk stratification of women with HR positive, LN negative BC is a
priority, because about 85% of these women are at
low risk of disease recurrence with endocrinemodulating therapy alone and thus are unlikely to
benefit from adjuvant chemotherapy [8, 9].
Currently, there exist multiple methods to predict risk
of 10-year disease recurrence and the potential benefit
of chemotherapy [10–12]. Oncotype DX® (Genomic
Health Inc., Redwood City, CA) (ODX) is a widely-used
prognostic breast cancer test which analyzes gene expression of 16 tumor-specific genes and 5 reference
genes [11, 13]. It was commercially introduced in the
United States in 2004 and shortly thereafter was recommended in guidelines released by the American Society
for Clinical Oncology (ASCO) and the National Comprehensive Cancer Network (NCCN) [14, 15]. The assay
provides an integer Recurrence Score (RS), ranging from
0 to 100, indicating low risk (RS < 18), intermediate risk
(RS 18–30), or high risk (RS ≥ 31) of disease recurrence.
Low risk patients are recommended to receive
endocrine-modulating therapy (tamoxifen or aromatase
inhibitors) only, and high risk patients are recommended
to receive both endocrine-modulating therapy and adjuvant chemotherapy [11, 13, 16]. Intermediate risk patients, while previously recommended to receive
adjuvant chemotherapy, were recently shown by the
large prospective TAILORx trial to receive little benefit
from chemotherapy, with a notable exception for younger patients [17]. Additional studies have also validated
the usefulness of ODX in patients with LN positive disease [18–20].
Several studies have suggested that ODX test results
influence subsequent treatment decisions. Approximately one-third to one-half of patient-physician pairs
make a change in recommended treatment following
ODX, generally eschewing adjuvant chemotherapy in
favor of the less toxic endocrine-modulating-only regimen [21, 22]. Despite its clinical impact, some eligible
patients are not tested, with the most common reason
being that ODX was not offered by the physician [23].
Physicians’ lack of familiarity with genomic testing is a
known barrier to clinical implementation [24].
Page 2 of 13
Qualitative and quantitative studies have examined patient and physician characteristics associated with use of
ODX, yet studies examining subsequent chemotherapy
use following ODX testing have primarily focused on patient characteristics [21, 22, 25–32]. In this study, we examined New Hampshire State Cancer Registry data from
2010 to 2016 to identify clinicopathological factors, patient demographics, and physician and hospital characteristics that influenced receipt of the ODX test in BC
patients, the physician’s decision to recommend chemotherapy, and the receipt of adjuvant chemotherapy by
the patient.
Methods
Data sources
The New Hampshire State Cancer Registry (NHSCR)
is maintained by the State of New Hampshire Department of Health and Human Services. This is a
population-based database on incident reportable cancers for all New Hampshire residents and includes
patient demographics, date and mode of diagnosis,
and tumor characteristics including grade and stage
[33]. The NHSCR achieved the highest standard
(gold) certification of data quality from the North
American Association of Central Cancer Registries
throughout the study period [34].
We obtained physician characteristics from two
sources. The National Plan and Provider Enumeration
System (NPPES) Downloadable File from the Centers for
Medicare and Medicaid Services (CMS) enumerates the
National Provider Identifier (NPI) for all physicians in
the United States. All HIPAA-covered entities (clinicians
and organizations) have been required to hold an NPI
since 2007. The NPPES file is continuously updated and
contains nearly 5 million records [35]. The CMS Physician Compare National Downloadable File is another
resource providing general information regarding physicians caring for Medicare eligible patients in the United
States [36].
Study cohort and definitions
Our study cohort includes women residing in New
Hampshire and diagnosed with breast cancer from
2010 to 2016, between the ages of 18 and 99. We excluded patients with ductal carcinoma in situ (DCIS)
or unknown stage. We further excluded patients with
no recorded medical oncologist in the registry. We
included the characteristics of each patient’s primary
medical oncologist, identified as having an NPI
specialty designation in Gynecologic Oncology,
Hematology, Hematology and Oncology, Medical
Oncology, or Pediatric Hematology-Oncology.
Schwedhelm et al. BMC Cancer
(2020) 20:847
Study variables
Outcome variables
The NHSCR documents whether patients receive
ODX and their test results. It also includes variables
describing each patient’s treatment plan including
whether chemotherapy was recommended, whether it
was given, and whether the patient refused chemotherapy after physician recommendation. This allowed
us to examine multiple outcomes: use of ODX, being
recommended chemotherapy following ODX, receiving chemotherapy following ODX, and chemotherapy
refusal following ODX. We further examined factors
associated with receiving chemotherapy stratified by
ODX RS classification (low, intermediate, high).
Page 3 of 13
Results
The initial NHSCR dataset contained 10,768 unique
breast cancer patients diagnosed from 2010 through
2016 (Table 1). A small number of patients (n = 29) received MammaPrint, a similar genomic test, and these
patients were excluded from analysis. A total of 91 patients were excluded due to ineligible age or gender. Patients were then excluded if they had DCIS (n = 2141),
unknown stage (n = 341), or if they did not have a recorded medical oncologist (n = 2536), yielding a final cohort of 5630 women (Supplemental Figure S1). There
were 225 unique medical oncologists treating the patients in the cohort (Table 2).
Receiving ODX
Patient variables
Patient variables include sociodemographic characteristics (patient age at diagnosis, marital status, and payer)
and tumor characteristics (year of diagnosis, size, grade,
LN status, hormone receptor status, and clinical stage).
Physician variables
Physician variables include gender, clinical experience,
and patient volume. To determine years of clinical experience for each physician, the difference between
the physician’s graduation year and the patient’s year
of diagnosis was calculated. Patient volume was calculated as the average number of BC patients in the
NHSCR data treated per year for each physician.
Average patient age was calculated as the mean age
at diagnosis for all patients seen by the physician in
the NHSCR. A binary variable was defined to discriminate between a patient being seen by a surgical oncologist or a general surgeon.
Statistical analysis
We first performed unadjusted analyses for all covariates. We developed multivariable logistic regression
models to examine the likelihood of ODX receipt in relation to patient and provider factors. Variables found to
be significant at alpha = 0.05 during unadjusted or adjusted analysis were retained for further analysis. Variables found to be non-significant in both were dropped
from the final analyses. Finally, we performed hierarchical logistic regressions, specifying hospital or physician
as a random effect. We identified the intraclass correlation coefficient (ICC) which quantifies the amount of
clustering due to the random effect and not to the observed factors, in order to determine the contribution to
the variance from the random effect, as previously reported [37–39]. Data analysis was performed with R version 3.6.0 [40].
Of the total cohort, 1512 (26.9%) patients were tested
with ODX. Over the course of the study period, overall
use of ODX increased from 24.6% in 2010 to 29.1% in
2016 (p = 0.05) (Table 1). In unadjusted analyses, we
found patient age, marital status, payer, tumor grade, LN
status, tumor size, clinical stage, and being seen by an
oncologist with an older average patient age were significantly associated with receiving ODX (Table S1). In the
adjusted analysis, patient age, marital status, tumor
grade, LN status, tumor size, and clinical stage contributed significantly to the model (Table 3). We then examined patient and physician characteristics associated with
ODX testing specifically among patients eligible for
ODX. Of the 2604 patients eligible for ODX, defined as
stage 1 or 2, LN negative, and HR+/HER2-, 1132 (43.5%)
received the test. ODX use in eligible patients ranged
from 42.5% in 2010 to 45.4% in 2016 (p = 0.50). In the
unadjusted analysis, patient age, marital status, tumor
grade, tumor size, tumor stage, physician gender, physician patient volume, and being seen by an oncologist
with an older average patient age were significantly associated with ODX use (Table S1). Only patient age, marital status, tumor grade, and tumor size contributed
significantly to the adjusted model (Table S2).
Chemotherapy recommendation
Chemotherapy was recommended for 2701 (48.0%) patients in the breast cancer cohort and 459 (30.4%) of patients who received ODX. In the unadjusted analyses, we
found year of diagnosis, patient age, tumor grade, LN
status, tumor size, clinical stage, physician gender, clinical experience, physician patient volume, and ODX RS
stratification to be significantly associated with a recommendation for chemotherapy (Table S1). In the adjusted
model, year of diagnosis, patient age, tumor grade, LN
status, tumor size, physician clinical experience, physician gender, physician patient volume, and ODX RS
stratification were significantly associated with a recommendation for chemotherapy. Notably, we found that
Schwedhelm et al. BMC Cancer
(2020) 20:847
Page 4 of 13
Table 1 Statistics of BC patients in New Hampshire 2010–2016
Variable
ODX Not Given (n = 4118)
ODX Given (n = 1512)
Total (n = 5630)
< 50
7870 (18.9%)
317 (21.0%)
1097 (19.5%)
Patient Age at Diagnosis (Years)
< 0.01**
50–59
974 (23.7%)
447 (29.6%)
1421 (25.2%)
60–69
1166 (28.3%)
518 (34.3%)
1684 (29.9%)
> 69
1198 (29.1%)
230 (15.2%)
1428 (25.4%)
Marital Status
< 0.01**
Single
1620 (39.3%)
464 (30.7%)
2084 (37.0%)
Married
2391 (58.1%)
1010 (66.8%)
3401 (60.4%)
Unknown
107 (2.6%)
38 (2.5%)
145 (2.6%)
Payer
< 0.01**
Self-Pay
86 (2.1%)
18 (1.2%)
104 (1.8%)
Public
1901 (46.2%)
516 (34.1%)
2417 (42.9%)
Private
1659 (40.3%)
790 (52.2%)
2449 (43.5%)
Unknown
472 (11.5%)
188 (12.4%)
660 (11.7%)
2010
526 (12.8%)
172 (11.4%)
698 (12.4%)
2011
577 (14.0%)
198 (13.1%)
775 (13.8%)
2012
528 (12.8%)
185 (12.2%)
713 (12.7%)
2013
580 (14.1%)
189 (12.5%)
769 (13.7%)
2014
613 (14.9%)
242 (16.0%)
855 (15.2%)
2015
668 (16.2%)
269 (17.8%)
937 (16.6%)
2016
626 (15.2%)
257 (17.0%)
883 (15.7%)
2390 (58.0%)
1023 (67.7%)
3413 (60.6%)
Year of Diagnosis
0.14
Tumor Size (mm)
0.1–19
P-Value
< 0.01**
20–39
981 (23.8%)
417 (27.6%)
1398 (24.8%)
> 40
627 (15.2%)
64 (4.2%)
691 (12.3%)
Unknown
120 (2.9%)
8 (0.5%)
128 (2.3%)
Tumor Grade
< 0.01**
I
854 (20.7%)
398 (26.3%)
1252 (22.2%)
II
1719 (41.7%)
844 (55.8%)
2563 (45.5%)
III / IV
1403 (34.1%)
265 (17.5%)
1668 (29.6%)
Unknown
142 (3.4%)
5 (0.3%)
147 (2.6%)
Negative
2289 (55.6%)
1196 (79.1%)
3485 (61.9%)
Positive
1257 (30.5%)
284 (18.8%)
1541 (27.4%)
Unknown
572 (13.9%)
32 (2.1%)
604 (10.7%)
HR+/HER2-
2663 (64.7%)
1446 (95.6%)
4109 (73.0%)
Other
1270 (30.8%)
41 (2.7%)
1311 (23.3%)
Unknown
185 (4.5%)
25 (2.5%)
210 (3.7%)
1
2152 (52.3%)
1034 (68.4%)
3186 (56.6%)
2
1166 (28.3%)
453 (30.0%)
1619 (28.8%)
3/4
800 (19.4%)
25 (1.7%)
825 (14.7%)
LN Status
< 0.01**
ER/PR/HER2 Status
< 0.01**
Clinical Stage
< 0.01**
Schwedhelm et al. BMC Cancer
(2020) 20:847
Page 5 of 13
Table 1 Statistics of BC patients in New Hampshire 2010–2016 (Continued)
Variable
ODX Not Given (n = 4118)
ODX Given (n = 1512)
Total (n = 5630)
P-Value
ODX Eligiblea
1472 (35.7%)
1132 (74.9%)
2604 (46.3%)
< 0.01**
MD Gender
0.34
Female
2212 (53.7%)
790 (52.2%)
3002 (53.3%)
Male
1906 (46.3%)
722 (47.8%)
2628 (46.7%)
< 10
169 (4.1%)
58 (3.8%)
227 (4.0%)
10–19
1774 (43.1%)
604 (39.9%)
2378 (42.2%)
20–29
1254 (30.5%)
511 (33.8%)
1765 (31.3%)
> 29
921 (22.4%)
339 (22.4%)
1260 (22.4%)
MD Clinical Experience (Years)
0.08
Surgical Specialty
0.72
General Surgeon
3582 (87.0%)
1309 (86.6%)
4891 (86.9%)
Surgical Oncologist
536 (13.0%)
203 (13.4%)
739 (13.1%)
P-values were calculated using chi-square test for categorical variables
* significant at the 0.05 level
** significant at the 0.01 level
a
ODX eligible patients are defined as stage 1 or 2, LN negative, and HR+/HER2-
patients were less likely to be recommended chemotherapy if they were seen by a male (compared to female) medical oncologist (OR = 0.50 (95% CI = 0.34–
0.74), p < 0.01). Compared with patients treated by
medical oncologists with fewer than 10 years of clinical experience, patients treated by medical
Table 2 Physician summary statistics
Total (n = 225)
Gender
Female
121 (53.8%)
Male
104 (46.2%)
Clinical Experience (Years)
(at time of treating first BC patient in cohort)
< 10
42 (18.7%)
10–19
68 (30.2%)
20–29
72 (32.0%)
> 29
43 (19.1%)
Graduation Year
1960s
6 (2.7%)
1970s
23 (10.2%)
1980s
72 (32.0%)
1990s
64 (28.4%)
2000s
58 (25.7%)
2010s
2 (0.9%)
a
Patient Volume
Mean (Standard Deviation)
5.14 (8.94)
Average Patient Age
a
< 65 Years
165 (73.3%)
> 65 Years
60 (26.7%)
BC patients seen per year
oncologists with more clinical experience were more
likely to be recommended chemotherapy (20–29 years:
OR = 4.05 (95% CI = 1.57–10.43), p < 0.01; > 29 years:
OR = 4.48 (95% CI = 1.68–11.95), p < 0.01) (Table 4).
Receiving chemotherapy
Receipt of chemotherapy was documented in 2264
(40.2%) patients in the breast cancer cohort, and 336
(22.2%) of patients who received ODX. Receipt of
chemotherapy among patients who did not receive ODX
remained relatively unchanged during the study period
(− 3.53% relative change from 2010 to 2016 (p = 0.37)).
However, in patients who received ODX, chemotherapy
use decreased from 27.3% in 2010 to 18.3% in 2016, a
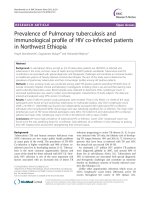
relative change of − 33.0% (p = 0.02) (Fig. 1a). In unadjusted analyses, the significant factors associated with
chemotherapy receipt following ODX testing were year
of diagnosis, patient age, payer, tumor grade, LN status,
tumor size, clinical stage, physician’s average patient age,
and ODX RS stratification (Table S1). In the multivariable model, year of diagnosis, patient age, tumor grade,
LN status, tumor size, clinical stage, physician clinical
experience, physician gender, and ODX RS stratification
were significantly associated with patient receipt of
chemotherapy (Table S3).
Receiving chemotherapy by ODX risk classification
We then stratified the ODX patients by their RS (low,
intermediate, high) and developed a multivariable model
for each stratum. Low RS patients comprised 60.6% of
the ODX population (n = 917) and 6.4% of these patients
received chemotherapy. Chemotherapy use decreased
from 11.7% in 2010 to 3.7% in 2016 for a relative change
of − 68.4% (p = 0.02) (Fig. 1b). Low risk patients were
Schwedhelm et al. BMC Cancer
(2020) 20:847
Page 6 of 13
Table 3 Multivariable regression odds ratios for receiving ODX
Odds Ratio (95% CI)
P-Value
2010
Ref
Ref
2011
1.00 (0.76–1.31)
0.99
2012
1.00 (0.76–1.31)
0.99
2013
1.00 (0.76–1.31)
0.98
2014
1.05 (0.80–1.36)
0.73
2015
1.05 (0.80–1.36)
0.73
2016
1.09 (0.83–1.43)
0.54
< 50
Ref
Ref
50–59
1.04 (0.86–1.27)
0.66
60–69
0.97 (0.79–1.18)
0.75
> 69
0.45 (0.35–0.58)
< 0.01**
Variable
Year of Diagnosis
Patient Age at Diagnosis (Years)
Marital Status
Single, Divorced, Widowed
Ref
Ref
Married
1.22 (1.05–1.41)
< 0.01**
Unknown
1.12 (0.73–1.73)
0.59
I
Ref
Ref
II
1.22 (1.03–1.43)
0.02*
III/IV
0.43 (0.35–0.53)
< 0.01**
Unknown
0.16 (0.06–0.42)
< 0.01**
Negative
Ref
Ref
Positive
0.70 (0.58–0.86)
< 0.01**
Unknown
0.21 (0.14–0.31)
< 0.01**
0.1–19
Ref
Ref
20–39
1.69 (1.35–2.12)
< 0.01**
> 40
0.88 (0.61–1.27)
0.48
Unknown
0.92 (0.39–2.13)
0.84
1
Ref
Ref
2
0.80 (0.63–1.03)
0.08
3/4
0.10 (0.06–0.17)
< 0.01**
< 10
Ref
Ref
10–19
0.89 (0.61–1.29)
0.53
20–29
1.05 (0.71–1.57)
0.79
> 29
1.07 (0.70–1.61)
0.76
Ref
Ref
Grade
LN Status
Tumor Size (mm)
Clinical Stage
MD Clinical Experience (Years)
MD Gender
Female
Male
Patient Volume
0.98 (0.79–1.22)
0.88
1.00 (0.99–1.01)
0.48
Schwedhelm et al. BMC Cancer
(2020) 20:847
Page 7 of 13
Table 3 Multivariable regression odds ratios for receiving ODX (Continued)
Odds Ratio (95% CI)
P-Value
< 65 Years
Ref
Ref
> 65 Years
0.71 (0.49–1.03)
0.06
General Surgeon
Ref
Ref
Surgical Oncologist
0.86 (0.70–1.06)
0.15
Variable
Average Patient Age
Surgical Specialty
* significant at the 0.05 level
** significant at the 0.01 level
less likely to receive chemotherapy if they were older
(60–69 years vs. < 50 years: OR = 0.17 (95% CI = 0.06–
0.49), p < 0.01; > 69 years vs. < 50 years: OR = 0.08 (95%
CI = 0.02–0.45), p < 0.01) and were more likely to receive
chemotherapy for higher grade (grade III/IV vs. grade I:
OR = 7.80 (95% CI = 2.62–23.27), p < 0.01), positive compared to negative LN status (OR = 5.84 (95% CI = 2.61–
13.05), p < 0.01), higher clinical stage (Stage 2 vs. Stage
1: OR = 2.96 (95% CI = 1.10–7.98) p = 0.03; Stage 3/4 vs.
Stage 1: OR = 6.22 (95% CI = 1.18–32.74), p = 0.03) and
larger tumors (> 40 mm vs. 0.1-19 mm: OR = 8.16 (95%
CI = 2.37–28.06), p < 0.01). In addition, chemotherapy
receipt was less likely among patients treated by male
(vs. female) medical oncologists (OR = 0.39 (95% = 0.17–
0.88), p = 0.02) (Table 5).
Intermediate RS patients comprised 31.0% of the ODX
population (n = 469), and 35.6% of the intermediate RS patients received chemotherapy. Chemotherapy use in this
group decreased from 41.8 to 30.4%, a relative change of
− 27.3% (p = 0.37) (Fig. 1b). In multivariable models,
chemotherapy was less likely in older patients compared
to those less than 50 years (60–69 years: OR = 0.29 (95%
CI = 0.14–0.59), p < 0.01; > 69 years: OR 0.10 (95% CI =
0.03–0.33), p < 0.01). Chemotherapy was more likely in
those with higher tumor grade compared to grade I
(Grade II: OR = 2.00 (95% CI = 1.06–3.80), p = 0.03; Grade
III/IV: OR = 2.37 (95% CI = 1.10–5.11), p = 0.02), and in
those with higher clinical stage (Stage 2 vs. Stage 1: OR =
2.59 (95% CI = 1.04–6.47), p = 0.04) and higher ODX RS
(OR = 1.33 (95% CI = 1.22–1.44), p < 0.01) (Table 5).
High RS patients comprised 8.3% of the ODX population
(n = 126) and 87.3% of these patients received chemotherapy.
Chemotherapy use in the high RS group decreased from
85.7 to 76.9% between 2010 and 2016 (p = 0.88) (Fig. 1b). Of
all the high RS patients, 61.9% had grade 3/4 tumors, 81.0%
were LN negative, and 63.5% had Stage 1 BC. The high RS
classification model failed to converge.
Chemotherapy refusal
A total of 375 patients were reported to have refused a
recommended course of adjuvant chemotherapy, 109 of
these having received ODX. Of those tested with ODX
who later refused recommended chemotherapy, the majority were in intermediate RS range (56.0%), were stage
1 (57.8%), LN negative (66.1%), and had tumors that
were grade II (60.6%). In the multivariable model, older
patients were more likely to refuse chemotherapy compared to patients less than 50 years (> 69 years: OR =
5.62 (95% CI = 1.72–18.39), p < 0.01). Patients were less
likely to refuse recommended adjuvant chemotherapy
following ODX testing if they had intermediate or high
ODX RS stratification, when compared with low RS
(Intermediate: OR 0.30 (95% CI = 0.15–0.60), p < 0.01;
High: OR 0.04 (95% CI = 0.01–0.13), p < 0.01). In
addition, patients being seen by higher volume oncologists were more likely to refuse chemotherapy (OR 1.02
(95% CI = 1.01–1.04), p = 0.04) (Table S4).
Between-physician and between-hospital variation
Hierarchical modeling for each outcome using hospital
and physician as the random effect allowed us to determine the proportion of total variance in clinical decisions that is due to variation between physicians and
hospitals. For each model, we calculated the ICC in
order to measure the correlation of clinical decisions
within physicians or hospitals (Table 6). Overall,
between-physician variation accounted for a greater proportion of variance than between-hospital variation.
Clustering within treating physicians and hospitals was
most pronounced for patients receiving a low ODX RS
score: clustering within physicians and within hospitals
accounted for 33 and 14% of the total variance in
chemotherapy use, respectively. For all patients tested
with ODX, clustering within physicians and within hospitals accounted for 18 and 4% of variation in receiving
chemotherapy, respectively.
Discussion
Increasing use of ODX is expected to spare low risk patients the short- and long-term adverse effects of adjuvant chemotherapy, while still treating the patients who
are most likely to benefit [41]. Previous studies using the
National Cancer Data Base report utilization of ODX of
45.7 to 54.0% among eligible patients, which is similar to
Schwedhelm et al. BMC Cancer
(2020) 20:847
Page 8 of 13
Table 4 Multivariable regression odds ratios for chemotherapy recommendation following ODX testing
Odds Ratio (95% CI)
P-Value
2010
Ref
Ref
2011
0.87 (0.48–1.60)
0.66
2012
0.65 (0.34–1.24)
0.18
2013
0.73 (0.39–1.36)
0.31
2014
0.66 (0.36–1.19)
0.16
2015
0.44 (0.24–0.82)
< 0.01**
2016
0.51 (0.27–0.96)
0.04*
< 50
Ref
Ref
50–59
0.73 (0.48–1.10)
0.13
60–69
0.39 (0.25–0.61)
< 0.01**
> 69
0.35 (0.18–0.66)
< 0.01**
I
Ref
Ref
II
1.73 (1.16–2.59)
< 0.01**
III/IV
3.55 (2.17–5.83)
< 0.01**
Unknown
2.61 (0.34–20.30)
0.35
Negative
Ref
Ref
Positive
3.54 (2.29–5.46)
< 0.01**
Unknown
1.26 (0.39–4.08)
0.69
Ref
Ref
20–39
1.51 (0.94–2.45)
0.08
> 40
4.36 (1.98–9.62)
< 0.01**
Unknown
1.03 (0.18–6.05)
0.98
1
Ref
Ref
2
1.50 (0.90–2.50)
0.11
3/4
2.72 (0.86–8.65)
0.08
< 10
Ref
Ref
10–19
1.89 (0.74–4.81)
0.17
20–29
4.05 (1.57–10.43)
< 0.01**
> 29
4.48 (1.68–11.95)
< 0.01**
Female
Ref
Ref
Male
0.50 (0.34–0.74)
< 0.01**
1.01 (1.01–1.03)
0.04*
< 65 Years
Ref
Ref
> 65 Years
0.72 (0.34–1.56)
0.40
Variable
Year of Diagnosis
Patient Age at Diagnosis (Years)
Grade
LN Status
Tumor Size (mm)
0.1–19
Clinical Stage
MD Clinical Experience (Years)
MD Gender
Patient Volume
Average Patient Age
ODX RS Classification
Schwedhelm et al. BMC Cancer
(2020) 20:847
Page 9 of 13
Table 4 Multivariable regression odds ratios for chemotherapy recommendation following ODX testing (Continued)
Odds Ratio (95% CI)
P-Value
Low
Ref
Ref
Intermediate
12.30 (8.70–17.38)
< 0.01**
High
233.08 (95.40–569.42)
< 0.01**
Variable
* significant at the 0.05 level
** significant at the 0.01 level
our finding of 43.5%; however, these rates suggest a national underutilization of ODX [27, 42]. Between 2010
and 2016, ODX use increased among patients with BC
in New Hampshire, and low and intermediate risk patients were more often spared chemotherapy while
higher risk patients continued to receive chemotherapy
at higher rates. These findings suggest that physicians
were following ODX recommendations as they became
available and sparing chemotherapy in patients who
were unlikely to receive any benefit.
Previously identified factors associated with
utilization of ODX fall under patient, physician, and
organizational level factors, among which our study
attempted to differentiate [43]. Our final models indicate that patients with earlier stage, LN negative BC
were more likely to be prescribed the test. Patientlevel factors for which we did not account but which
literature suggests play a role in shared decisionmaking include education, decision-making style, and
attitude towards genetic testing and chemotherapy
[23, 44]. Cost is unlikely to have been a major barrier
during our study period, as ODX testing has been
covered by CMS and most private payers for eligible
patients since 2006–2008 [27, 45]. In our study, we
did not find physician gender or clinical experience to
be associated with use of ODX. Previous work identified physician awareness and familiarity with genomic
testing as a barrier to uptake [24]. This is reflected by
oncologists reporting a desire to receive additional
education regarding genomic tests [46]. Physicians
also
cite
ODX
marketing,
medical/insurance
guidelines, and use among peers as factors contributing to utilization of ODX in their practice [43].
We found that patients who received ODX were more
likely to be recommended for chemotherapy if they were
younger and had later stage, LN positive BC, and higher
ODX RS, consistent with previous work [47]. We observed that the association between absolute RS and
odds of chemotherapy treatment to be strongest among
intermediate risk patients. Other interesting patterns
reflecting the influence of physician characteristics on
chemotherapy use following ODX stand out. Patients
tested with ODX were significantly more likely to be
recommended chemotherapy when treated by physicians
with 20 or more years of clinical experience. This may
represent aspects of the doctor-patient relationship as
well as acceptance of RS score guidelines and engrained
practice patterns, as these physicians would have been in
practice when guidelines recommending chemotherapy
for all patients were established [3, 4]. We observed that
female physicians were more likely to recommend and
prescribe chemotherapy for all ODX patients, including
low risk patients. Additional work to understand the differences in preferences of oncologists accounting for
gender and clinical experience may be warranted to reduce variation in treatment decisions following ODX
test results, especially given the potential concern of
overtreatment among low risk patients.
Our hierarchical models demonstrate the significant
heterogeneity in chemotherapy treatment decisions following ODX testing among hospitals and physicians. In
this respect, variation between hospitals seemed to be
Fig. 1 a Trends in chemotherapy receipt of patients receiving and not receiving ODX (b) Trends in chemotherapy receipt by RS stratification in
ODX patients. ACT = adjuvant chemotherapy
Schwedhelm et al. BMC Cancer
(2020) 20:847
Page 10 of 13
Table 5 Multivariable regression odds ratios for receiving chemotherapy stratified by low and intermediate ODX RS
Odds Ratio (95% CI)
Low RS
P-Value
Odds Ratio (95% CI) Intermediate RS
2010
Ref
Ref
Ref
Ref
2011
0.68 (0.21–2.17)
0.50
1.17 (0.45–3.04)
0.75
2012
0.48 (0.14–1.72)
0.25
2.23 (0.82–6.06)
0.11
2013
0.34 (0.10–1.17)
0.08
1.10 (0.41–2.95)
0.84
2014
0.40 (0.12–1.39)
0.14
0.67 (0.26–1.72)
0.40
2015
0.21 (0.05–0.86)
0.03*
1.07 (0.41–2.76)
0.89
2016
0.25 (0.06–0.94)
0.04*
1.10 (0.39–3.10)
0.85
Variable
P-Value
Year of Diagnosis
Patient Age at Diagnosis (Years)
< 50
Ref
Ref
Ref
Ref
50–59
0.67 (0.30–1.50)
0.32
0.59 (0.31–1.13)
0.11
60–69
0.17 (0.06–0.49)
< 0.01**
0.29 (0.14–0.59)
< 0.01**
> 69
0.08 (0.02–0.45)
< 0.01**
0.10 (0.03–0.33)
< 0.01**
I
Ref
Ref
Ref
Ref
II
1.48 (0.58–3.73)
0.40
2.00 (1.06–3.80)
0.03*
III/IV
7.80 (2.62–23.27)
< 0.01**
2.37 (1.10–5.11)
0.02*
Unknown
0.00 (0.00-Inf)
0.99
0.00 (0.00-Inf)
0.99
Grade
LN Status
Negative
Ref
Ref
Ref
Ref
Positive
5.84 (2.61–13.05)
< 0.01**
1.93 (0.92–4.05)
0.08
Unknown
2.91 (0.25–34.27)
0.38
0.50 (0.04–6.96)
0.60
0.1–19
Ref
Ref
Ref
Ref
20–39
0.96 (0.38–2.41)
0.93
1.26 (0.55–2.88)
0.58
> 40
8.16 (2.37–28.06)
< 0.01**
0.94 (0.19–4.62)
0.94
Unknown
0.00 (0.00-Inf)
0.99
0.79 (0.07–9.12)
0.85
1
Ref
Ref
Ref
Ref
2
2.96 (1.10–7.98)
0.03*
2.59 (1.04–6.47)
0.04*
3/4
6.22 (1.18–32.74)
0.03*
0.36 (0.01–9.58)
0.53
Tumor Size (mm)
Clinical Stage
MD Clinical Experience (Years)
< 10
Ref
Ref
Ref
Ref
10–19
2.56 (0.26–25.28)
0.41
0.75 (0.21–2.64)
0.65
20–29
4.31 (0.44–41.94)
0.20
1.61 (0.44–5.88)
0.46
> 29
7.71 (0.75–79.43)
0.08
2.02 (0.55–7.48)
0.28
Female
Ref
Ref
Ref
Ref
Male
0.39 (0.17–0.88)
0.02*
0.73 (0.42–1.27)
0.26
0.98 (0.95–1.00)
0.08
1.01 (0.99–1.02)
0.40
MD Gender
Patient Volume
Average Patient Age
< 65 Years
Ref
Ref
Ref
Ref
> 65 Years
0.59 (0.13–2.74)
0.50
0.76 (0.23–2.53)
0.65
Schwedhelm et al. BMC Cancer
(2020) 20:847
Page 11 of 13
Table 5 Multivariable regression odds ratios for receiving chemotherapy stratified by low and intermediate ODX RS (Continued)
Variable
Odds Ratio (95% CI)
Low RS
P-Value
Odds Ratio (95% CI) Intermediate RS
P-Value
ODX RS
0.98 (0.96–1.00)
0.15
1.33 (1.22–1.44)
< 0.01**
* significant at the 0.05 level
** significant at the 0.01 level
less pronounced than variation between physicians.
These results raise questions regarding the extent to
which unmeasured physician characteristics impact their
interpretation of ODX results and subsequent treatment
decisions. The variation identified by the physician ICCs
may represent differences in physician training, personal
experience and familiarity with genetic tests, and the
perceived value of the test, all of which have been reported previously [24, 48].
Our study has several limitations. New Hampshire has
a predominantly white and rural population, so our findings may not be generalizable to other states or regions
with different patient and provider sociodemographic
characteristics. We did not have access to detailed medical records and thus could not analyze outcomes, such
as disease-free survival following ODX testing or by
treatment modality. Patients missing data on medical
oncologists was a limitation, which could also be better
addressed in a study that links the registry data to electronic health records. Coder reliability and misclassification are a known issue when analyzing registry data as
evidenced by the recent reliability study conducted by
the Surveillance, Epidemiology, and End Results (SEER)
Program [49]. We lacked data on whether the physician
specializes in breast cancer care, which could influence
their use of ODX. Finally, due to the observational nature of our study, the associations we identified cannot
be interpreted as causal.
Conclusions
In conclusion, these findings indicate potential opportunities to implement interventions and target physicians
Table 6 ICC for receiving ODX and being recommended,
receiving, and refusing chemotherapy
Clinical Decision
Hospital-level
ICC
Physicianlevel ICC
Receiving ODX for all patients
0.02
0.07
Receiving ODX for eligible patientsa
0.04
0.11
Recommending chemotherapy after ODX
0.06
0.17
Receiving chemotherapy after ODX
0.04
0.18
Receiving chemotherapy after Low ODX
RS
0.14
0.33
Receiving chemotherapy after Int ODX RS 0.03
0.18
Refusing chemotherapy after ODX
0.27
a
0.09
ODX eligible patients are defined as stage 1 or 2, LN negative,
and HR+/HER2-
regarding ODX and adjuvant chemotherapy use in order
to reduce variation in patient care. This is especially important, and challenging, as ODX recommendations
continue to evolve in light of new findings, such as those
from the TAILORx trial [17]. Moreover, the utility of
ODX has now extended to a stage modifier according to
the American Joint Committee on Cancer staging manual [50]. Future work evaluating guideline-concordant
changes in ODX testing and adjuvant chemotherapy prescribing patterns following new guidelines will shed light
on physician awareness and adaptability regarding implementation of genomic tests in cancer care. Additional
physician training in the availability of genomic tests,
interpreting genetic tests, and methods to convey the
benefits and results of the tests may be beneficial to increase utilization [23, 48].
Supplementary information
Supplementary information accompanies this paper at />1186/s12885-020-07355-6.
Additional file 1.
Abbreviations
ODX: Oncotype DX; BC: Breast cancer; LN: Lymph node; HR: Hormone
receptor; RS: Recurrence score; OR: Odds ratio; CI: Confidence interval;
ICC: Intraclass clustering coefficient; NHSCR: New Hampshire State Cancer
Registry; CMS: Center for Medicare and Medicaid Services; NPI: National
Provider Identifier
Acknowledgements
Not applicable.
Authors’ contributions
TS, EM, and JR contributed to study design and conceptualization. Funding
acquisition and supervision was performed by EM. JR and MC assisted with
data acquisition and variable curation. Data analysis was performed by TS. TS,
JR, RZ, AS, TO, and EM contributed to interpretation of data and results. The
first draft of the manuscript was written by TS and all authors made
significant contributions to subsequent versions of the manuscript. All
authors read and approved the final manuscript and agree to be
accountable for their own contributions.
Funding
This research is supported through an American Cancer Society Research
Grant #IRG-16-191-33 awarded through the Norris Cotton Cancer Center, and
NIH NIGMS P20GM104416. The New Hampshire State Cancer Registry is
funded in part by the Centers for Disease Control and Prevention’s National
Program of Cancer Registries, cooperative agreement 5 NU58DP006298–0300 awarded to the New Hampshire Department of Health and Human
Services, Division of Public Health Services, Bureau of Public Health Statistics
and Informatics, Office of Health Statistics and Data Management. The
paper’s contents are solely the responsibility of the authors and do not
necessarily represent the official views of the Centers for Disease Control and
Prevention or New Hampshire Department of Health and Human Services.
Schwedhelm et al. BMC Cancer
(2020) 20:847
Availability of data and materials
The data that support the findings of this study are available from the New
Hampshire Department of Health and Human Resources, but restrictions
apply to the availability of the data, which were used with permission for the
current study, and so are not publicly available. Data are, however, available
from the authors upon reasonable request and with permission of the New
Hampshire Department of Health and Human Resources.
Ethics approval and consent to participate
This study was approved by the Institutional Review Board of Dartmouth
College (STUDY00031403) and the Institutional Review Board of
Massachusetts Department of Public Health. The use of the data was
approved by the State of New Hampshire and State of Massachusetts
Departments of Health and Human Services. Below-threshold values have
been censored. Analyses, conclusions, interpretations, and recommendations
drawn from this research are solely those of the authors and not necessarily
those of the New Hampshire Department of Health and Human Services.
Consent for publication
Not applicable.
Competing interests
The authors declare that they have no conflict of interest.
Author details
1
Department of Biomedical Data Science, Dartmouth Geisel School of
Medicine, Lebanon, NH, USA. 2New Hampshire State Cancer Registry,
Lebanon, NH, USA. 3Department of Epidemiology, Dartmouth Geisel School
of Medicine, Lebanon, NH, USA. 4The Dartmouth Institute for Health Policy
and Clinical Practice, Lebanon, NH, USA.
Received: 21 July 2020 Accepted: 27 August 2020
References
1. Siegel R, Miller K, Jemal A. Cancer statistics, 2017. CA Cancer J Clin. 2017;
67(1):7–30. />2. Howlader N, Altekruse SF, Li CI, Chen VW, Clarke CA, Ries LAG, Cronin KA.
US incidence of breast cancer subtypes defined by joint hormone receptor
and HER2 status. J Natl Cancer Inst. 2014;106(5). />dju055.
3. Mansour EG, Gray R, Shatila AH, Osborne C, Tormey DC, Gilchrist KW, et al.
Efficacy of adjuvant chemotherapy in high-risk node-negative breast cancer.
N Engl J Med. 1989;320(8):485–90.
4. Mansour EG, Gray R, Shatila AH, Tormey DC, Cooper MR, Osborne CK,
Falkson G. Survival advantage of adjuvant chemotherapy in high-risk nodenegative breast cancer: ten-year analysis - an intergroup study. J Clin Oncol.
1998;16(11):3486–92. />5. Fisher B, Dignam J, Wolmark N, Decillis A, Wickerham DL, Bryant J, et al.
Tamoxifen and chemotherapy for lymph node-negative, estrogen receptorpositive breast Cancer. J Natl Cancer Inst. 1997;89(22):1673–82 Retrieved
from />6. Abrams J. Adjuvant therapy for breast cancer--results from the USA
consensus conference. Breast Cancer. 2001;8(4):298–304.
7. Munoz D, Near AM, Van Ravesteyn NT, Lee SJ, Schechter CB, Alagoz O, et al.
Effects of screening and systemic adjuvant therapy on ER-specific US breast
cancer mortality. J Natl Cancer Inst. 2014;106(11). />jnci/dju289.
8. Early Breast Cancer Trialists’ Collaborative Group (EBCTCG), Abe O, Abe R,
Enomoto K, Kikuchi K, Koyama H, et al. Effects of chemotherapy and
hormonal therapy for early breast cancer on recurrence and 15-year
survival: an overview of the randomised trials. Lancet. 2005;365(9472):1687–
717. />9. Early Breast Cancer Trialists’ Collaborative Group (EBCTCG), Abe O, Abe R,
Enomoto K, Kikuchi K, Koyama H, et al. Relevance of breast cancer hormone
receptors and other factors to the effi cacy of adjuvant tamoxifen: patientlevel meta-analysis of randomised trials. Lancet. 2011;378:771–84. https://doi.
org/10.1016/S0140.
10. Fan C, Oh DS, Wessels L, Weigelt B, Nuyten DSA, Nobel AB, et al.
Concordance among gene-expression-based predictors for breast Cancer a
bs tr ac t. N Engl J Med. 2006;355(6):560–9 Retrieved from www.nejm.org.
Page 12 of 13
11. Sparano JA, Paik S. Development of the 21-gene assay and its application in
clinical practice and clinical trials. J Clin Oncol. 2008. />JCO.2007.15.1068.
12. Cardoso F, van’t Veer LJ, Bogaerts J, Slaets L, Viale G, Delaloge S, et al. 70gene signature as an aid to treatment decisions in early-stage breast
Cancer. N Engl J Med. 2016;375(8):717–29. />nejmoa1602253.
13. Paik S, Shak S, Kim C, Baker J, Cronin M, Baehner FL, et al. A multigene assay
to predict recurrence of Tamoxifen-treated, node-negative breast Cancer. N
Engl J Med. 2004;351(27):2817–43 Retrieved from www.nejm.org.
14. Harris L, Fritsche H, Mennel R, Norton L, Ravdin P, Taube S, et al. American
society of clinical oncology 2007 update of recommendations for the use of
tumor markers in breast cancer. J Clin Oncol. 2007;25(33):5287–312. https://
doi.org/10.1200/JCO.2007.14.2364.
15. National Comprehensive Cancer Network. NCCN clinical practice guidelines
in oncology: breast cancer, vol. 1; 2007. p. 2007. Retrieved June 12, 2019,
from />asp#breast.
16. Paik S, Tang G, Shak S, Kim C, Baker J, Kim W, et al. Gene expression and
benefit of chemotherapy in women with node-negative, estrogen receptorpositive breast cancer. J Clin Oncol. 2006;24(23):3726–34. />1200/JCO.2005.04.7985.
17. Sparano JA, Gray RJ, Makower DF, Pritchard KI, Albain KS, Hayes DF, et al.
Adjuvant chemotherapy guided by a 21-gene expression assay in breast
Cancer. N Engl J Med. 2018;379(2):111–21. />NEJMoa1804710.
18. Albain KS, Barlow WE, Shak S, Hortobagyi GN, Livingston RB, Yeh IT, et al.
Prognostic and predictive value of the 21-gene recurrence score assay in
postmenopausal women with node-positive, oestrogen-receptor-positive
breast cancer on chemotherapy: a retrospective analysis of a randomised
trial. Lancet Oncol. 2010;11(1):55–65. />19. Dowsett M, Cuzick J, Wale C, Forbes J, Mallon EA, Salter J, et al. Prediction of
risk of distant recurrence using the 21-gene recurrence score in nodenegative and node-positive postmenopausal patients with breast cancer
treated with anastrozole or tamoxifen: a TransATAC study. J Clin Oncol.
2010;28(11):1829–34. />20. Roberts MC, Miller DP, Shak S, Petkov VI. Breast cancer-specific survival in
patients with lymph node-positive hormone receptor-positive invasive
breast cancer and Oncotype DX recurrence score results in the SEER
database. Breast Cancer Res Treat. 2017;163(2):303–10. />1007/s10549-017-4162-3.
21. Rath MG, Uhlmann L, Fiedler M, Heil J, Golatta M, Dinkic C, et al. Oncotype
DX® in breast cancer patients: clinical experience, outcome and followup—a case–control study. Arch Gynecol Obstet. 2018;297(2):443–7. https://
doi.org/10.1007/s00404-017-4618-z.
22. Carlson JJ, Roth JA. The impact of the Oncotype dx breast cancer assay in
clinical practice: a systematic review and meta-analysis. Breast Cancer Res
Treat. 2013. />23. DeFrank JT, Salz T, Reeder-Hayes K, Brewer NT. Who gets genomic testing
for breast cancer recurrence risk? Public Health Genomics. 2013;16(5):215–
22. />24. Stanek EJ, Sanders CL, Taber KAJ, Khalid M, Patel A, Verbrugge RR, et al.
Adoption of pharmacogenomic testing by US physicians: results of a
nationwide survey. Clin Pharmacol Ther. 2012;91(3):450–8. />1038/clpt.2011.306.
25. Collin LJ, Yan M, Jiang R, Ward KC, Crawford B, Torres MA, et al. Oncotype
DX recurrence score implications for disparities in chemotherapy and breast
cancer mortality in Georgia. npj Breast Cancer. 2019;5(1). />1038/s41523-019-0129-3.
26. Dinan MA, Mi X, Reed SD, Lyman GH, Curtis LH. Association between use of
the 21-gene recurrence score assay and receipt of chemotherapy among
medicare beneficiaries with early-stage breast cancer, 2005-2009. JAMA
Oncol. 2015;1(8):1098–109. />27. Press DJ, Ibraheem A, Dolan ME, Goss KH, Conzen S, Huo D. Racial
disparities in omission of oncotype DX but no racial disparities in
chemotherapy receipt following completed oncotype DX test results. Breast
Cancer Res Treat. 2018;168(1):207–20. />28. Roberts MC, Weinberger M, Dusetzina SB, Dinan MA, Reeder-Hayes KE,
Troester MA, et al. Racial variation in adjuvant chemotherapy initiation
Schwedhelm et al. BMC Cancer
29.
30.
31.
32.
33.
34.
35.
36.
37.
38.
39.
40.
41.
42.
43.
44.
45.
46.
47.
48.
(2020) 20:847
among breast cancer patients receiving oncotype DX testing. Breast Cancer
Res Treat. 2015;153(1):191–200. />McVeigh TP, Kerin MJ. Clinical use of the oncotype DX genomic test to
guide treatment decisions for patients with invasive breast cancer. Breast
Cancer. Dove Medical Press Ltd. 2017. />Bombard Y, Rozmovits L, Trudeau M, Leighl NB, Deal K, Marshall DA. The
value of personalizing medicine: medical oncologists’ views on gene
expression profiling in breast Cancer treatment. Oncologist. 2015;20(4):351–
6. />Leggett LE, Lorenzetti DL, Noseworthy T, Tiwana S, MacKean G, Clement F.
Experiences and attitudes toward risk of recurrence testing in women with
breast cancer: a systematic review. Breast Cancer Res Treat. 2014;144(3):457–
65. />Weldon CB, Trosman JR, Gradishar WJ, Benson AB, Schink JC. Barriers to the
use of personalized medicine in breast Cancer. J Oncol Pract. 2012;8(4):e24–
31. />Rees JR, Zens MS, Gui J, Celaya MO, Riddle BL, Karagas MR. Non melanoma
skin cancer and subsequent cancer risk. PLoS One. 2014;9(6). />10.1371/journal.pone.0099674.
North American Association of Central Cancer Registries. (n.d.). Certified
Registries. Retrieved October 18, 2019, from />The National Bureau of Economic Research. (2019). NPI Data -- CMS’
National Plan and Provider Enumeration System (NPPES) Files in SAS, Stata,
and CSV format. Retrieved January 1, 2019, from />npi.html.
Centers for Medicare and Medicaid Services. (2019). Physician Compare
datasets. Retrieved May 10, 2019, from />physician-compare.
Shahinian VB, Kuo YF, Freeman JL, Goodwin JS. Determinants of androgen
deprivation therapy use for prostate cancer: role of the urologist. J Natl
Cancer Inst. 2006;98(12):839–45. />Snijders TAB, Bosker RJ. Multilevel analysis: an introduction to basic and
advanced multilevel modeling. 2nd ed. London: SAGE Publications; 2003.
/>Lin HY, Bedrosian I, Babiera GV, Shaitelman SF, Kuerer HM, Woodward WA,
et al. Using the National Cancer Data Base for quality evaluation to assess
adherence to treatment guidelines for nonmetastatic inflammatory breast
cancer. Cancer. 2017;123(14):2618–25. />R development core team. R: a language and environment for statistical
computing. Vienna: R Foundation for Statistical Computing; 2019. Retrieved
from />Tao JJ, Visvanathan K, Wolff AC. Long term side effects of adjuvant
chemotherapy in patients with early breast cancer. Breast. 2015;24(2):S149–
53. />Jasem J, Amini A, Rabinovitch R, Borges VF, Elias A, Fisher CM. 21-Gene
recurrence score assay as a predictor of adjuvant chemotherapy
administration for early-stage breast Cancer : an analysis of use, therapeutic
implications, and disparity profile. J Clin Oncol. 2016;34(17):1995–2004.
/>Roberts MC, Bryson A, Weinberger M, Dusetzina SB, Dinan MA, ReederHayes K, Wheeler SB. Oncologists’ barriers and facilitators for Oncotype DX
use: qualitative study. Int J Technol Assess Health Care. 2016;32(5):355–61.
/>Roberts MC, Bryson A, Weinberger M, Dusetzina SB, Dinan MA, ReederHayes KE, Wheeler SB. Patient-centered communication for discussing
Oncotype DX testing. Cancer Investig. 2016;34(5):205–12. />3109/07357907.2016.1172637.
Trosman JR, Van Bebber SL, Phillips KA. Coverage policy development for
personalized medicine: private payer perspectives on developing policy for
the 21-gene assay. J Oncol Pract. 2010;6(5):238–42. />jop.000075.
Dressler LG, Deal AM, Patel J, Markey J, Van Riper M, McLeod HL. Cancer
pharmacogenomics, adoption by oncologists and patient benefit.
Personalized Med. 2014;11(2):143–53. />Su KW, Hall J, Soulos PR, Abu-Khalaf MM, Evans SB, Mougalian SS, et al.
Association of 21-gene recurrence score assay and adjuvant chemotherapy
use in the medicare population, 2008–2011. Journal of Geriatric Oncology.
2016;7(1):15–23. />Spellman E, Sulayman N, Eggly S, Peshkin BN, Schwartz MD, Neill SCO,
Comprehensive L. Conveying genomic recurrence risk estimates to patients
Page 13 of 13
with early stage breast cancer : oncologist perspectives. Psychooncology.
2013;22(9):2110–6. />49. Ruhl, J., Groves, C., Schussler, N., & Handley, B. (2020). 202019 EOD, Summary
Stage, and SSDI Reliability Study 2019 EOD, Summary Stage, and SSDI
Reliability Study Surveillance, Epidemiology, and End Results ( SEER )
Program National Cancer Institute January 2020. Retrieved February 7, 2020,
from />9ReliabilityStudy.pdf.
50. American College of Surgeons. (2014). AJCC 8th 2017. AJCC Cancer Staging
Manual. Retrieved February 10, 2019, from />references-tools/deskreferences/Documents/AJCCBreast
CancerStagingSystem.pdf.
Publisher’s Note
Springer Nature remains neutral with regard to jurisdictional claims in
published maps and institutional affiliations.