Primary care characteristics and stage of cancer at diagnosis using data from the national cancer registration service, quality outcomes framework and general practice information
Bạn đang xem bản rút gọn của tài liệu. Xem và tải ngay bản đầy đủ của tài liệu tại đây (1.21 MB, 15 trang )
Maclean et al. BMC Cancer (2015) 15:500
DOI 10.1186/s12885-015-1497-1
RESEARCH ARTICLE
Open Access
Primary care characteristics and stage of
cancer at diagnosis using data from the
national cancer registration service, quality
outcomes framework and general practice
information
Rebecca Maclean1*, Mona Jeffreys2, Alex Ives3, Tim Jones4, Julia Verne5 and Yoav Ben-Shlomo6
Abstract
Background: Survival from cancer is worse in England than in some European countries. To improve survival,
strategies in England have focused on early presentation (reducing delay to improve stage at diagnosis), improving
quality of care and ensuring equity throughout the patient pathway. We assessed whether primary care
characteristics were associated with later stage cancer at diagnosis (stages 3/4 versus 1/2) for female breast, lung,
colorectal and prostate cancer.
Methods: Data obtained from the National Cancer Registration Service, Quality Outcomes Framework, GP
survey and GP workforce census, linked by practice code. Risk differences (RD) were calculated by primary care
characteristics using a generalised linear model, accounting for patient clustering within practices. Models were
adjusted for age, sex and an area-based deprivation measure.
Results: For female breast cancer, being with a practice with a higher two week wait (TWW) referral rate (RD −1.8 %
(95 % CI −0.5 % to −3.2 %) p = 0.003) and a higher TWW detection rate (RD −1.7 % (95 % CI −0.3 % to −3.0 %)
p = 0.003) was associated with a lower proportion diagnosed later. Being at a practice where people thought it less
easy to book at appointment was associated with a higher percentage diagnosed later (RD 1.8 % (95 % CI 0.2 %
to 3.4 %) p = 0.03). For lung cancer, being at practices with higher TWW referral rates was associated with lower
proportion advanced (RD-3.6 % (95 % CI −1.8 %, −5.5 %) p < 0.001) whereas being at practices with more patients
per GP was associated with higher proportion advanced (RD1.8 % (95 % CI 0.2, 3.4) p = 0.01). A higher rate of
gastrointestinal investigations was associated with a lower proportion of later stage colorectal cancers (RD −2.0 %
(95 % CI −0.6 % to −3.6 %) p = 0.01). No organisational characteristics were associated with prostate cancer stage.
Conclusion: Easier access to primary care, faster referral and more investigation for gastrointestinal symptoms could
reduce the proportion of people diagnosed later for female breast, lung and colorectal, but not prostate cancer.
Differences between the four main cancers suggest different policies may be required for individual cancers to
improve outcomes.
Keywords: Delayed diagnosis, Neoplasms, General practice, Primary care, Quality indictors, health care
* Correspondence:
1
Speciality Registrar in Public Health, NHS England, South Plaza, Marlborough
Street, Bristol BS1 3NX, UK
Full list of author information is available at the end of the article
© 2015 Maclean et al. This is an Open Access article distributed under the terms of the Creative Commons Attribution License
( which permits unrestricted use, distribution, and reproduction in any medium,
provided the original work is properly credited. The Creative Commons Public Domain Dedication waiver (http://
creativecommons.org/publicdomain/zero/1.0/) applies to the data made available in this article, unless otherwise stated.
Maclean et al. BMC Cancer (2015) 15:500
Background
Survival from cancer varies across European countries
[1, 2]. Stage at diagnosis is strongly related to cancer
mortality and more advanced stage at diagnosis may be
associated with delay in diagnosis [3]. In England, The
National Awareness and Early Diagnosis Initiative
(NAEDI) was announced as part of the 2007 Cancer
Strategy to understand and tackle reasons for more advanced stage at diagnosis in England compared to other
EU countries [4]. To improve survival, strategies have
focused on early presentation (reducing delay to improve stage at diagnosis), improving quality of care and
ensuring equity throughout the patient pathway. Delays
in diagnosis can be caused by delays in presentation,
primary care delay (first presentation to referral), system
delays (time to investigation) and secondary care delays
(first seen in secondary care to diagnosis) [5, 6].
There has been little research investigating whether
there is an association between characteristics and systems
of primary care and stage of cancer at diagnosis. Research
from Denmark showed associations between some primary care characteristics and patient or system delay [7].
The authors showed that patients attending a female doctor more often experienced short patient delay but longer
system delay compared to patients attending a male doctor. Patients attending a practice with many services or
seeing a doctor with little former knowledge of the patient
more often experience short system delay. One recent
study [8] found that higher total quality outcome framework (QOF) score protected against unplanned first-time
admissions for cancer, but having no doctors with a UK
primary medical qualification and being less able to offer
appointments within 48 hrs were associated with increased odds of an unplanned first-time admission. EllissBrookes et al. [9] showed patients presenting via the
emergency route have substantially lower 1-year relative
survival than those presenting via other routes. Together,
these studies indicate that primary care characteristics and
systems could have an impact on cancer outcomes.
We investigated whether organisational characteristics
of primary care practices in England were associated
with stage at diagnosis of the four most common cancers (female breast, prostate, colorectal and lung cancer).
Methods
Data sources
Stage of cancer at diagnosis, patient-level demographic factors and primary care characteristics were obtained from a
number of data sources.
Data linkage
We were able to link across a numner of different datasets by using the unique GP code [10], where available
and valid thereby providing us information on cancer
Page 2 of 15
characteristics, general practice level features and patient
perceptions about their practice. This process and losses
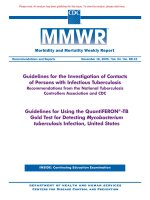
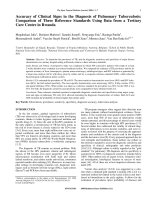
of data for a variety of different reasons including exclusions is shown in a flow diagram (Fig. 1)
National Cancer Registration Service (NCRS) [11].
There are eight offices of the NCRS in England which
submit a standard dataset of information. Stage data was
more than 70 % complete across England for female
breast (ICD-10 C50), colorectal (ICD-10 C18 to C20),
lung (ICD-10 C33 to C39, and C45) and prostate cancer
(ICD-10 C61) [12]. We included stage data from all relevant fields within NCRS. (For a description of how stage
data are collected within the NCRS see appendix 1 online). Data on patient age, sex, ethnicity and area-based
deprivation (income-based domain of the index of multiple deprivation (IMD)) quintile were from NCRS dataset. NCRS information was provided by Public Health
England’s National Cancer Registration Service; data
from the cancer registry is publicly available but only
once it has been aggregated to a level that is not patientidentifiable.
National Cancer Intelligence Network (NCIN) Practice
Profiles [13]. These bring together data relevant to cancer
in primary care from a range of sources. They were developed to provide information on general practice (GP) variation and understand cancer burden. Exposure variables
from this data source were; two week wait (TWW) referral rate (number of TWW referrals for any cancer per
100,000 population), TWW conversion rate (percentage of
all TWW referrals with cancer), TWW detection rate
(percentage of new cancers treated which were referred
through TWW system), average colonoscopy, sigmoidoscopy and endoscopy rate (average colonoscopy, sigmoidoscopy and upper gastrointestinal endoscopy in-patient or
day case procedures, rate per 100,000), emergency admissions (number of persons admitted to hospital as an inpatient or day-case via an emergency admission, with a
diagnostic code that includes cancer, per 100,000 population) and GP deprivation (income-based domain of IMD).
Most data is freely available, however some small numbers
within the profiles are only accessible through specific
routes. A version of the GP Practice Profiles with potentially identifiable data suppressed is publicly available via
the Public Health England National Cancer Intelligence
Network’s Cancer Commissioning Toolkit.
The Quality and Outcomes Framework (QOF) is a financial incentive scheme that rewards GPs depending on
their achievement against quality indicators [14]. The total
QOF score was used with higher scores indicating better
performance. The four domains within QOF (clinical,
organisational, additional services and patient experience)
were not used as separate variables as they were strongly
correlated with each other and the total QOF score.
The individual cancer indicator score was also strongly
Maclean et al. BMC Cancer (2015) 15:500
Fig. 1 Data flow due to data linkage, missing data and exclusions from dataset
Page 3 of 15
Maclean et al. BMC Cancer (2015) 15:500
correlated with the total QOF score. Information on list
size (number of patients per practice) was used with information on the number of general practitioners per practice (from the GP workforce census, see below) to
calculate the average number of patients per general practitioner at each practice. QOF data is freely available, reused with the permission of the Health and Social Care
Information Centre.
The General Practice Patient Survey is a questionnaire
sent to a random sample of adults registered at GPs
across England [15]. It gives patients an opportunity to
comment on their experience of their GP. Exposure
variables from this data were; percentage of patients
responding ‘yes’ to the question ‘Were you able to get an
appointment see or speak to someone?’ 2011/12 and
percentage of patients responding ‘always’, ‘almost always’
or ‘a lot of the time’ to the question ‘Were you able to
see your preferred doctor?’ 2010/11. These aspects were
chosen because studies have shown easier access (ability
to get an appointment) and greater continuity (ability to
see a preferred doctor) can be associated with reduced
hospital admissions [16, 17]. In 2011/12, 2.74 million
questionnaires were sent with a response rate of 38 %
(5.56 million sent in 2010/11 with 36 % response rate).
Data is freely available, re-used with the permission of
the Health and Social Care Information Centre.
General Practice workforce census is collected annually
and includes information on the numbers of general
practitioners working in primary care [18]. Exposure
variables from this data source were: age, gender and
country of primary medical qualification of general practitioners, and the number of general practitioners per
practice (full time equivalent). Single handed practice
was not included as a separate exposure variable because
there were only a small number (890, 11 %) of single
handed practices. Data is freely available, re-used with
the permission of the Health and Social Care Information Centre.
Health & Social Care Information Centre (HSCIC) Indicator Portal brings together health and social care indicators [19]. The rurality of GPs (based on population
density of the GP postcode) was obtained from this
source. Data is freely available, re-used with the permission of the Health and Social Care Information Centre.
(For more details and how we operationalised the exposure variables see the Additiona file 1: Table S’a’).
Inclusion/exclusion criteria
We included all practices that were in the NCIN Practice
Profiles [13]. These were practices in the 2011/12 QOF
data with the following exclusions; practices with a patient
list size less than 1000, a greater than 10 % difference in
list size between 2011/12 QOF and Attribution Dataset
April 2010, practice was missing in Attribution Dataset
Page 4 of 15
April 2010 or the practice could not be allocated to a
CCG. This resulted in 7,965 practices (158 of 8,123 practices within QOF 2011/12 were excluded).
Statistical methods
Our primary outcome was the proportion of patients who
were diagnosed with advanced cancer compared to those
with an earlier stage. Our null hypothesis was that characteristics and systems of primary care would not influence
the proportion with advanced versus earlier stage for each
of our four specific cancer sites after accounting for
patient-level demographic factors. We defined advanced
stage as stages 3 or 4 (regional or metastatic) compared to
stages 1 or 2 (locally confined) using data from the TNM
classification (see appendix 1 for further description of
staging).
We derived two sets of exposure variables (a) patient
level (age, sex, ethnicity and area deprivation) and (b)
primary care level. The latter were divided into four domains (i) GP demographics (ii) GP general performance
(iii) GP specific cancer activities (iv) GP other activities.
We decided that we would use a risk difference rather
than a risk ratio as the most appropriate effect estimate
as this enables one to easily calculate the impact of a GP
characteristic in absolute terms. We therefore used a
generalised linear model for the binomial family with an
identity link function. Our outcome variable, stage of
cancer at diagnosis, was coded as zero for early stage
(stages 1 or 2) and one for late stage (stages 3 or 4). We
allowed errors in the model to be correlated within each
GP practice to account for clustering of patients within
GPs, thereby producing more conservative confidence
inetrvals and p-values. Negative risk differences show
that patients are less likely to be diagnosed at an advanced stage (3 or 4) compared to patients in the baseline group. The opposite is true for positive differences.
Risk differences are presented as percentage risk difference. Analyses were conducted using STATA 13.
Female breast cancer and prostate cancer models were
adjusted for age at diagnosis and patient level incomebased deprivation. Colorectal and lung cancer models
were adjusted for age at diagnosis, sex and patient level
area-based deprivation. We developed a conceptual
model (Additional file 1: Figure S’a’) on the potential
inter-relationships between the primary care level factors. We had no a priori knowledge of this causal pathway and using the conceptual model decided not to
mutually adjust for characteristics or systems of primary
care as they may have been on the causal pathway and
hence the coefficients from such a model would be misleading due to over-adjustment.
We undertook a series of sensitivity analyses to assess
the impact of missing ethnicity data and of using stage
data from different fields within NCRS. Missing data for
Maclean et al. BMC Cancer (2015) 15:500
stage of cancer at diagnosis was analysed to investigate
whether there were systematic reasons for data being
missing (missing not at random). Multiple imputation
was used to generate missing values for stage for each of
the four main cancers separately. The ice program was
used to perform imputation in Stata 13. Imputation was
performed on stage with sex, deprivation quintile and
age included in the imputation model. A further model
using the significant exposure variables for each cancer
(female breast cancer included rurality, two week wait
(TWW) referral rate, TWW detection rate, emergency
admission rate, gender of general practitioners and ease
of booking an appointment; prostate cancer included GP
practice deprivation and practices rate of colonoscopy,
sigmoidoscopy and endoscopy; colorectal cancer included practices rate of colonoscopy, sigmoidoscopy and
endoscopy; lung cancer included TWW referral rate,
TWW conversion rate, age and gender of general practitioners, number of patients per GP and emergency admission rates ). Twenty imputed data sets were created
for each model.
Results
There were 363,991 tumours diagnosed in 2012 (all cancers excluding non-melanoma skin cancers, ICD-10 C00
to C97 excluding C44). Of these there were 42,572 female breast cancers, 36,822 prostate cancers, 34,458
colorectal cancer and 38,652 lung cancers, accounting
for 42 % of all cancers diagnosed in 2012. From these
34,119 female breast cancers (5,666 stage 3 or 4, 16.6 %),
27,880 prostate cancers (10,756 stage 3 or 4, 38.6 %),
27,079 colorectal cancers (14,793 stage 3 or 4, 54.6 %)
and 28,479 lung cancers (21,520 stage 3 or 4, 75.6 %)
were included in the analyses (see Fig. 1 for details of inclusion/exclusion of tumours). These were from patients
at 7,786 GP practices across England.
(For details of the number of tumours of each cancer
type by patient and GP variable see the Additional file 1:
Table Sb).
At an individual level we found that various exposures
could be important confounders for presenting with advanced female breast cancer (see Table 1). Non-white vs.
white women and women living in more deprived areas
were more likely to be diagnosed at a more advanced stage
(RD 6.0 % (95 % CI 3.3 % to 8.6 %) p < 0.001; Q5 vs. Q1 RD
3.9 % (95 % CI 2.5 % to 5.3 %), p-value for trend <0.001).
Women aged 15–44 years were more likely to be diagnosed at a more advanced stage than women aged 65 years
and over whereas women aged 45–64 years were less likely
to be diagnosed at a more advanced stage (15-44years vs. 65
+ RD 2.1 % (95 % CI 0.6 % to 3.6 %) p = 0.01; 45–64 years
vs. 65+ RD −3.2 % (95 % CI −4.1 % to −2.4 %) p < 0.001).
A variety of GP exposures were associated with stage at
presentation but after adjustment for age and deprivation
Page 5 of 15
the following predicted lower proportion with advanced
stage female breast cancer: having a GP in a town/fringe
area compared to urban area (RD −1.5 % (95 % CI −2.5 %
to −0.4 %) p = 0.01), ), practices with higher two week wait
(TWW) referral rate and a higher TWW detection rate
(Q5 vs. Q1 RD −1.5 % (95 % CI −2.8 % to −0.2 %) p value
for trend = 0.01; Q5 vs. Q1 RD −1.3 % (95 % CI −2.6 % to
0.0 %) p value for trend = 0.01) and practices that had a
higher emergency admission rate (Q5 vs. Q1 RD −2.0 %
(95 % CI −3.3 % to −0.8 %) p value for trend = 0.03). In
contrast having only female general practitioners at the
practice and being at a practice where people thought it
was less easy to book an appointment was associated with
a higher percentage diagnosed at a more advanced stage
(all female GPs: RD 4.0 % (95 % CI 0.6 % to 7.4 %) p =
0.02; <80 % thought easy to book appointment compared
to >90 % RD 1.7 % (95 % CI 0.1 % to 3.3 %) p = 0.04.
At the individual level we found that various exposures
could be important confounders for presenting with advanced prostate cancer (see table 1). Men living in more
deprived areas were more likely to be diagnosed at a
more advanced stage than those living in less deprived
areas (Q5 vs. Q1 RD 4.7 % (95 % CI 2.7 % to 6.8 %), pvalue for trend <0.001). Non-white vs. white men and
younger men were less likely to be diagnosed at a more
advanced stage (RD −6.0 % (95 % CI −10.3 % to −1.7 %)
p = 0.01; 45-64 years vs. 65+ RD −8.1 % (95 % CI −9.4 %
to −6.8 %) p < 0.001, 15-44 years vs. 65+ RD −19.0 %
(95 % CI −29.5 % to −8.5 %) p < 0.001).
After adjustment for age and deprivation GP practice
deprivation and practices with higher rates of colonoscopy, sigmoidoscopy and endoscopy were associated
with a higher percentage diagnosed at a more advanced
stage (Q5 vs. Q1 RD 1.8 % (95 % CI −0.6 % to 4.2 %) pvalue for trend 0.04; tertile 3 vs. tertile 1 RD 2.4 % (95 %
CI 0.9 % to 3.9 %) p value for trend = 0.002).
For colorectal cancer, at the individual level, we found
that various exposures could be important confounders
for presenting later (see Table 2). Non-white vs. white
people and younger people were more likely to be diagnosed at a more advanced stage (RD 6.7 % (95 % CI
2.7 % to 10.7 %) p = 0.001; 15-44 years vs. 65+ RD
10.3 % (95 % CI 7.1 % to 13.4 %) p < 0.001, 45-64 years
vs. 65+ RD 6.0 % (95 % CI 4.6 % to 7.3 %) p < 0.001).
After adjustment for age, sex and deprivation the only
GP exposure which was associated with stage at presentation was the average colonoscopy, sigmoidoscopy and
endoscopy rate. We found that a higher average colonoscopy, sigmoidoscopy and endoscopy rate was associated with a lower percentage of people diagnosed at a
more advanced stage (tertile 3 vs. tertile 1 RD −2.0 %
(95%CI −3.5 % to −0.5 %) p value for trend = 0.01).
Age and gender were important confounders for presenting with advanced lung cancer (see Table 2). Women
Female breast cancer
Prostate cancer
Univariate
Risk difference
(95 % CI)
Patient level
p-value
Adjusted; age & deprivation
Univariate
Risk difference
(95 % CI)
Risk difference (95 % CI)
p-value
Adjusted; age & deprivation
p-value
Risk difference
(95 % CI)
p-value
Age
65 + yrs
Baseline
45-64 years
−3.2
(−4.1 to −2.4)
<0.001
Baseline
−3.2
(−4.1 to −2.4)
<0.001
Baseline
−8.1
(−9.4 to −6.8)
<0.001
Baseline
−8.2
(−9.4 to −6.9)
<0.001
15-44 years
2.1
(0.6 to 3.6)
0.01
1.9
(0.4 to 3.4)
0.01
−19.0
(−29.5 to −8.5)
<0.001
−19.7
(−30.2 to −9.3)
<0.001
(−10.3 to −1.7)
0.01
Ethnicity
White
Baseline
Non-white
6.0
(3.3 to 8.6)
Baseline
−6.0
<0.001
Maclean et al. BMC Cancer (2015) 15:500
Table 1 Univariate and adjusted risk differences for female breast cancer and prostate cancer
Deprivation
GP demographics
Q1 (least deprived)
Baseline
Baseline
Baseline
Q2
−0.6
(−1.8 to 0.6)
−0.8
(−1.9 to 0.4)
2.1
(0.5 to 3.8)
2.0
(0.4 to 3.7)
Q3
0.0
(−1.2 to 1.2)
−0.1
(−1.3 to 1.0)
2.7
(1.0 to 4.5)
2.6
(0.9 to 4.3)
Q4
2.5
(1.2 to 3.8)
2.2
(1.0 to 3.5)
4.1
(2.2 to 6.0)
Q5 (most deprived)
3.9
(2.5 to 5.3)
3.6
(2.2 to 5.0)
4.7
(2.7 to 6.8)
<0.001
<0.001
Baseline
<0.001
4.2
(2.3 to 6.0)
4.9
(2.9 to 7.0)
<0.001
Number of patients per GP
Q1 (lowest)
Baseline
Baseline
Baseline
Q2
−0.1
(−1.5 to 1.3)
−0.1
(−1.4 to 1.3)
−1.2
(−3.1 to 0.8)
−1.1
(−3.0 to 0.9)
Q3
−0.8
(−2.1 to 0.6)
−0.8
(−2.1 to 0.6)
−0.9
(−2.9 to 1.1)
−0.7
(−2.7 to 1.3)
Q4
0.3
(−1.1 to 1.7)
0.1
(−1.3 to 1.5)
−0.8
(−2.7 to 1.2)
−0.8
(−2.8 to 1.1)
Q5 (highest)
−0.1
(−1.5 to 1.2)
−0.6
(−1.9 to 0.7)
−2.3
(−4.2 to −0.4)
−2.3
(−4.2 to −0.4)
0.04
(−2.1 to 0.4)
0.18
0.94
0.48
Baseline
0.05
Training practice
No
Baseline
Yes
0.9
(0.1 to 1.8)
Baseline
0.03
0.6
(−0.2 to 1.5)
Baseline
0.16
−0.8
Baseline
(−2.0 to 0.5)
0.23
−0.9
GPs aged 50 and over
Some
Baseline
None
0.6
(−1.0 to 2.1)
0.46
0.3
Baseline
(−1.2 to 1.8)
0.66
−0.5
Baseline
(−2.7 to 1.8)
0.70
−0.5
Baseline
(−2.8 to 1.7)
0.64
All
1.5
(−0.4 to 3.3)
0.13
0.8
(−1.0 to 2.6)
0.41
−2.1
(−4.5 to 0.4)
0.10
−2.5
(−5.0 to −0.1)
0.04
GPs female
Baseline
None
−0.1
(−1.7 to 1.6)
0.95
−0.7
Baseline
(−2.3 to 0.9)
0.40
Baseline
−0.5
(−2.7 to 1.7)
0.68
Baseline
−1.0
(−3.1 to 1.2)
0.38
All
5.0
(1.4 to 8.6)
0.01
4.0
(0.6 to 7.4)
0.02
−1.8
(−6.3 to 2.6)
0.42
−2.1
(−6.5 to 2.3)
0.34
Page 6 of 15
Some
GPs qualified in UK
Some
Baseline
None
1.5
(−0.4 to 3.4)
0.13
0.4
Baseline
(−1.4 to 2.2)
0.68
−2.2
Baseline
(−4.8 to 0.3)
0.08
−2.5
Baseline
(−5.0 to 0.0)
0.05
All
−0.4
(−1.3 to 0.5)
0.40
−0.3
(−1.1 to 0.6)
0.55
0.9
(−0.5 to 2.2)
0.20
1.1
(−0.2 to 2.4)
0.09
GP level deprivation
Q1 (least deprived)
Baseline
Baseline
Baseline
Q2
0.4
(−0.9 to 1.7)
0.3
(−1.0 to 1.5)
1.9
(0.1 to 3.7)
1.0
(−0.9 to 2.8)
Q3
0.1
(−1.2 to 1.4)
−0.6
(−1.9 to 0.7)
3.2
(1.3 to 5.0)
2.1
(0.2 to 4.0)
Q4
1.2
(−0.2 to 2.5)
−0.2
(−1.6 to 1.2)
3.5
(1.6 to 5.3)
2.1
(0.1 to 4.2)
Q5 (most deprived)
4.4
(2.9 to 5.9)
<0.001
2.5
(0.8 to 4.2)
3.5
(1.5 to 5.6)
<0.001
1.8
(−0.6 to 4.2)
0.04
0.14
Baseline
Maclean et al. BMC Cancer (2015) 15:500
Table 1 Univariate and adjusted risk differences for female breast cancer and prostate cancer (Continued)
GP rurality
GP general
performance
Urban > 10 K
Baseline
Town and fringe
−2.4
(−3.5 to −1.4)
<0.001
−1.5
Baseline
(−2.5 to −0.4)
0.01
Baseline
−2.0
(−3.7 to −0.4)
0.01
Baseline
−1.6
(−3.3 to 0.0)
0.05
Village, hamlet & isolated dwellings
−2.5
(−4.7 to −0.4)
0.02
−1.6
(−3.7 to 0.4)
0.12
−2.0
(−5.1 to 1.0)
0.19
−1.2
(−4.3 to 1.9)
0.44
Able to book appointment
90 % and over
Baseline
Baseline
Baseline
80-90 %
1.0
(0.1 to 1.9)
0.6
(−0.3 to 1.4)
0.9
(−0.4 to 2.2)
<80 %
3.1
(1.5 to 4.7)
1.7
(0.1 to 3.3)
−1.3
(−3.6 to 1.1)
<0.001
0.04
Baseline
0.92
0.8
(−0.5 to 2.1)
−2.0
(−4.3 to 0.4)
0.70
Able to see preferred GP
80 % and over
Baseline
Baseline
Baseline
60-80 %
0.7
(−0.3 to 1.7)
0.4
(−0.6 to 1.4)
0.2
(−1.2 to 1.7)
<60 %
1.7
(0.5 to 2.9)
1.0
(−0.2 to 2.2)
−0.7
(−2.5 to 1.0)
0.01
0.10
Baseline
0.47
0.2
(−1.2 to 1.6)
−0.9
(−2.7 to 0.9)
0.35
Total QOF points
GP specific
cancer activities
990 to 1000 (max) points
Baseline
Baseline
Baseline
980 to 989 points
−0.2
−0.4
1.4
(−0.3 to 3.1)
1.2
(−0.5 to 2.8)
0.7
(−1.3 to 2.6)
(−1.3 to 0.9)
960 to 979 points
1.2
(0.0 to 2.4)
<960 points
1.4
(0.0 to 2.7)
0.02
(−1.4 to 0.7)
0.9
(−0.3 to 2.1)
0.9
(−0.4 to 2.2)
0.11
Baseline
1.3
0.23
(−0.4 to 2.9)
1.1
(−0.5 to 2.8)
0.4
(−1.5 to 2.3)
0.75
Two week wait referral rate
Baseline
Baseline
Baseline
Q2
−1.8
(−3.2 to −0.5)
−1.3
(−2.6 to 0.1)
0.1
(−1.8 to 1.9)
0.1
(−1.8 to 2.0)
Q3
−0.7
(−2.1 to 0.7)
−0.1
(−1.4 to 1.2)
1.6
(−0.3 to 3.6)
1.8
(−0.1 to 3.8)
1.4
(−0.5 to 3.4)
1.2
(−0.7 to 3.2)
0.7
(−1.2 to 2.7)
0.7
(−1.3 to 2.6)
Q4
−2.9
(−4.2 to −1.6)
Q5 (highest)
−2.3
(−3.6 to −0.9)
<0.001
−2.0
(−3.3 to −0.7)
−1.5
(−2.8 to −0.2)
0.01
Baseline
0.20
0.26
Page 7 of 15
Q1 (lowest)
Two week wait conversion
Q1 (lowest)
Baseline
Baseline
Baseline
Q2
−1.0
(−2.4 to 0.3)
−0.7
(−2.0 to 0.7)
2.1
(0.1 to 4.1)
2.0
(0.0 to 4.0)
Q3
−1.7
(−3.1 to −0.4)
−1.3
(−2.6 to 0.0)
1.1
(−0.9 to 3.1)
0.9
(−1.1 to 2.9)
Q4
−1.3
(−2.6 to 0.0)
−1.0
(−2.3 to 0.3)
0.9
(−1.1 to 2.9)
0.7
(−1.3 to 2.7)
Q5 (highest)
−1.0
(−2.4 to 0.3)
−0.7
(−2.0 to 0.6)
1.6
(−0.3 to 3.5)
1.4
(−0.5 to 3.3)
0.12
0.23
Baseline
0.34
0.46
Two week wait detection
GP other activities
Q1 (lowest)
Baseline
Baseline
Baseline
Q2
−0.5
(−1.9 to 0.8)
−0.2
(−1.6 to 1.1)
0.5
(−1.4 to 2.4)
0.5
(−1.5 to 2.4)
Q3
−1.6
(−2.9 to −0.2)
−1.1
(−2.4 to 0.2)
1.9
(0.0 to 3.8)
1.9
(0.0 to 3.8)
Q4
−2.6
(−4.1 to −1.2)
−1.9
(−3.3 to −0.6)
2.8
(0.7 to 4.8)
2.7
(0.7 to 4.8)
Q5 (highest)
−2.0
(−3.4 to −0.6)
−1.3
(−2.6 to 0.0)
0.3
(−1.7 to 2.2)
0.6
(−1.3 to 2.5)
<0.001
0.01
Baseline
0.26
Maclean et al. BMC Cancer (2015) 15:500
Table 1 Univariate and adjusted risk differences for female breast cancer and prostate cancer (Continued)
0.15
Average colonoscopy, sigmoidoscopy
and upper GI endoscopy
T1 (lowest)
Baseline
T2
−0.8
(−1.9 to 0.2)
T3 (highest)
0.5
(−0.5 to 1.6)
Baseline
0.33
−0.6
(−1.6 to 0.4)
0.6
(−0.4 to 1.6)
Baseline
0.28
Baseline
2.3
(0.8 to 3.8)
2.5
(1.0 to 4.0)
0.001
2.4
(0.9 to 3.9)
2.4
(0.9 to 3.9)
0.002
Emergency admissions
Q1 (lowest)
Baseline
Baseline
Baseline
Q2
−1.9
(−3.2 to −0.5)
−1.6
(−2.8 to −0.3)
1.2
(−0.7 to 3.2)
1.5
(−0.4 to 3.4)
Q3
−0.3
(−1.7 to 1.0)
−0.1
(−1.5 to 1.2)
1.7
(−0.2 to 3.6)
1.7
(−0.2 to 3.6)
Q4
−1.0
(−2.3 to 0.3)
−0.8
(−2.1 to 0.5)
1.7
(−0.3 to 3.6)
1.4
(−0.6 to 3.3)
Q5 (highest)
−2.0
(−3.4 to −0.7)
−2.0
(−3.3 to −0.8)
2.1
(0.1 to 4.0)
1.6
(−0.4 to 3.5)
0.04
0.03
Baseline
0.04
0.17
Page 8 of 15
Colorectal cancer
Lung cancer
Univariate
Risk difference
(95 % CI)
Patient level
Adjusted; age & deprivation
p-value Risk difference
(95 % CI)
Univariate
p-value Risk difference
(95 % CI)
Adjusted; age & deprivation
p-value Risk difference
(95 % CI)
p-value
Age
65 + yrs
Baseline
45-64 years
6.0
15-44 years
10.3 (7.1 to 13.4)
(4.6 to 7.3)
Baseline
<0.001
5.9
(4.6 to 7.3)
<0.001
10.1 (6.9 to 13.3)
Baseline
Baseline
<0.001
3.1
(1.7 to 4.5)
<0.001
3.3
(1.9 to 4.6)
<0.001
<0.001
4.2
(−1.5 to 9.9)
0.15
4.5
(−1.2 to 10.2)
0.12
1.00
−3.1 (−4.1 to −2.1)
<0.001
−3.3 (−4.3 to −2.3)
Sex
Male
Baseline
Female
0.1
(−1.1 to 1.4)
Baseline
0.82
0.0
(−1.2 to 1.2)
Baseline
Baseline
Maclean et al. BMC Cancer (2015) 15:500
Table 2 Univariate and adjusted risk differences for colorectal cancer and lung cancer
<0.001
Ethnicity
White
Baseline
Non-white
6.7
(2.7 to 10.7)
Baseline
−0.7 (−4.6 to 3.1)
0.001
0.71
Deprivation
GP demographics
Q1 (least deprived)
Baseline
Baseline
Baseline
Baseline
Q2
−0.4 (−2.2 to 1.4)
−0.3 (−2.1 to 1.5)
−0.5 (−2.2 to 1.3)
−0.4 (−2.2 to 1.4)
Q3
−0.3 (−2.2 to 1.5)
−0.3 (−2.1 to 1.6)
0.3
0.4
Q4
1.0
(−0.9 to 2.9)
0.9
(−1.0 to 2.8)
−0.3 (−2.0 to 1.4)
Q5 (most deprived)
1.5
(−0.6 to 3.5)
1.1
(−0.9 to 3.1)
0.07
0.14
(−1.4 to 2.1)
−1.0 (−2.7 to 0.7)
(−1.3 to 2.1)
−0.4 (−2.1 to 1.3)
0.29
−1.3 (−3.0 to 0.4)
0.13
Number of patients per GP
Q1 (lowest)
Baseline
Baseline
Baseline
Baseline
Q2
1.0
(−0.9 to 2.9)
1.1
(−0.8 to 3.0)
0.5
(−1.1 to 2.2)
0.6
(−1.0 to 2.2)
Q3
1.1
(−0.9 to 3.1)
1.1
(−0.9 to 3.1)
0.6
(−1.0 to 2.3)
0.7
(−0.9 to 2.3)
Q4
1.6
(−0.3 to 3.6)
1.5
(−0.4 to 3.4)
1.7
(0.1 to 3.3)
1.7
(0.2 to 3.3)
Q5 (highest)
0.4
(−1.6 to 2.4)
0.2
(−1.8 to 2.1)
0.74
2.0
(0.4 to 3.5)
0.01
1.8
(0.2 to 3.4)
0.95
0.6
0.27
0.6
0.54
0.01
Training practice
No
Baseline
Yes
0.2
(−1.0 to 1.5)
Baseline
0.71
0.0
(−1.2 to 1.3)
Baseline
(−0.5 to 1.6)
Baseline
(−0.5 to 1.6)
0.28
GPs aged 50 and over
Baseline
None
−1.2 (−3.5 to 1.1)
0.30
−1.4 (−3.6 to 0.9)
0.24
−2.6 (−4.3 to −0.8)
0.01
−2.5 (−4.3 to −0.7)
0.01
All
0.9
0.52
0.5
0.69
2.0
0.07
2.0
0.06
GPs female
(−1.7 to 3.4)
Baseline
(−2.1 to 3.1)
Baseline
(−0.1 to 4.1)
Baseline
(−0.1 to 4.1)
Page 9 of 15
Some
Some
Baseline
Baseline
Baseline
None
−0.4 (−2.7 to 1.9)
0.73
−0.8 (−3.1 to 1.6)
0.53
1.3
All
−3.0 (−8.2 to 2.2)
0.27
−3.5 (−8.7 to 1.7)
0.19
−4.5 (−8.4 to −0.6)
(−0.5 to 3.1)
Baseline
0.17
1.3
0.03
−4.6 (−8.4 to −0.7)
(−0.5 to 3.1)
0.14
0.02
GPs qualified in UK
Some
Baseline
Baseline
Baseline
Baseline
None
−0.1 (−2.7 to 2.6)
0.95
−0.5 (−3.2 to 2.2)
0.71
−0.6 (−2.6 to 1.5)
0.59
−0.5 (−2.6 to 1.5)
0.61
All
−0.6 (−2.0 to 0.7)
0.35
−0.4 (−1.8 to 0.9)
0.51
−0.2 (−1.3 to 0.9)
0.68
−0.3 (−1.4 to 0.8)
0.61
GP level deprivation
Q1 (least deprived)
Baseline
Baseline
Baseline
Q2
−1.2 (−3.1 to 0.7)
−1.4 (−3.3 to 0.6)
−1.8 (−3.5 to −0.1)
−1.8 (−3.5 to −0.1)
Q3
−1.0 (−2.9 to 0.8)
−1.3 (−3.3 to 0.7)
−0.3 (−2.0 to 1.4)
−0.6 (−2.3 to 1.2)
Q4
0.5
(−1.4 to 2.5)
Q5 (most deprived)
0.9
(−1.2 to 3.0)
−0.2 (−2.4 to 1.9)
0.17
−0.4 (−2.9 to 2.1)
Baseline
−0.9 (−2.5 to 0.8)
1.00
−2.6 (−4.3 to −0.9)
Maclean et al. BMC Cancer (2015) 15:500
Table 2 Univariate and adjusted risk differences for colorectal cancer and lung cancer (Continued)
−1.2 (−3.0 to 0.7)
0.03
−2.8 (−4.8 to −0.8)
0.04
GP rurality
GP general
performance
Urban > 10 K
Baseline
Baseline
Town and fringe
−0.7 (−2.5 to 1.0)
0.40
−0.1 (−1.9 to 1.6)
0.87
0.0
(−1.5 to 1.5)
0.96
−0.2 (−1.7 to 1.4)
0.83
Village, hamlet & isolated dwellings
−0.3 (−3.5 to 2.8)
0.84
0.2
0.90
0.7
(−2.5 to 3.9)
0.67
0.4
0.82
(−2.9 to 3.3)
Baseline
Baseline
(−2.9 to 3.6)
Able to book appointment
90 % and over
Baseline
80-90 %
0.1
(−1.2 to 1.4)
<80 %
1.1
(−1.3 to 3.5)
Baseline
Baseline
−0.1 (−1.4 to 1.2)
0.46
0.3
(−2.1 to 2.7)
Baseline
−0.7 (−1.7 to 0.4)
0.95
−0.5 (−2.4 to 1.4)
−0.5 (−1.6 to 0.6)
0.32
−0.3 (−2.2 to 1.7)
0.52
Able to see preferred GP
80 % and over
Baseline
60-80 %
−0.6 (−2.0 to 0.9)
<60 %
0.5
(−1.3 to 2.3)
Baseline
Baseline
−0.6 (−2.1 to 0.8)
0.65
0.1
(−1.7 to 1.9)
Baseline
−1.4 (−2.6 to −0.2)
0.96
−1.4 (−2.8 to 0.0)
−1.3 (−2.5 to 0.0)
0.05
−1.2 (−2.6 to 0.2)
0.09
Total QOF points
Baseline
Baseline
Baseline
Baseline
980 to 989 points
0.1
(−1.4 to 1.7)
0.0
(−1.6 to 1.5)
−0.8 (−2.1 to 0.5)
−0.7 (−2.0 to 0.6)
960 to 979 points
0.6
(−1.2 to 2.4)
0.4
(−1.4 to 2.2)
−0.4 (−1.8 to 1.0)
−0.5 (−1.9 to 0.9)
<960 points
−0.5 (−2.5 to 1.4)
0.93
−0.9 (−2.8 to 1.1)
0.53
−0.8 (−2.4 to 0.8)
0.29
−0.7 (−2.3 to 0.9)
Two week wait referral rate
Q1 (lowest)
Baseline
Baseline
Baseline
Baseline
Q2
0.3
0.6
−1.6 (−3.2 to −0.1)
−1.6 (−3.2 to −0.1)
(−1.6 to 2.3)
(−1.3 to 2.5)
0.65
Page 10 of 15
GP specific cancer
activities
990 to 1000 (max) points
Q3
−0.6 (−2.5 to 1.3)
Q4
−0.7 (−2.6 to 1.3)
Q5 (highest)
−1.2 (−3.1 to 0.8)
−0.3 (−2.2 to 1.7)
−2.3 (−3.8 to −0.7)
−0.2 (−2.1 to 1.8)
0.13
−0.6 (−2.6 to 1.4)
−2.3 (−3.9 to −0.8)
−2.1 (−3.7 to −0.5)
0.39
−3.4 (−5.0 to −1.8)
−2.0 (−3.6 to −0.5)
<0.001
−3.3 (−4.9 to −1.7)
<0.001
Two week wait conversion
Q1 (lowest)
Baseline
Q2
0.8
Q3
−2.5 (−4.5 to −0.5)
Q4
−1.8 (−3.7 to 0.2)
Q5 (highest)
0.6
(−1.2 to 2.7)
(−1.3 to 2.6)
Baseline
Baseline
Baseline
1.0
1.3
(−0.3 to 3.0)
1.5
(−0.1 to 3.1)
1.2
(−0.4 to 2.9)
1.3
(−0.4 to 2.9)
(−1.0 to 3.0)
−2.0 (−4.0 to −0.1)
−1.3 (−3.2 to 0.7)
0.56
1.2
(−0.7 to 3.1)
0.96
3.6
(2.0 to 5.2)
4.1
(2.5 to 5.7)
<0.001
3.6
(2.0 to 5.2)
4.0
(2.4 to 5.6)
<0.001
Maclean et al. BMC Cancer (2015) 15:500
Table 2 Univariate and adjusted risk differences for colorectal cancer and lung cancer (Continued)
Two week wait detection
GP other activities
Q1 (lowest)
Baseline
Baseline
Baseline
Baseline
Q2
1.5
(−0.5 to 3.4)
1.7
(−0.2 to 3.7)
−1.1 (−2.7 to 0.5)
−1.1 (−2.6 to 0.5)
Q3
0.7
(−1.2 to 2.6)
0.9
(−0.9 to 2.8)
−1.0 (−2.5 to 0.6)
−0.8 (−2.4 to 0.7)
Q4
−1.2 (−3.3 to 0.9)
Q5 (highest)
1.3
(−0.6 to 3.3)
−0.8 (−2.9 to 1.2)
0.92
1.6
(−0.4 to 3.5)
−0.7 (−2.3 to 0.9)
0.72
−1.3 (−2.9 to 0.3)
−0.6 (−2.2 to 1.1)
0.22
−1.3 (−2.9 to 0.3)
0.23
Average colonoscopy, sigmoidoscopy and
upper GI endoscopy
T1 (lowest)
Baseline
Baseline
Baseline
Baseline
T2
−0.3 (−1.8 to 1.2)
0.0
−1.1 (−2.4 to 0.1)
−1.1 (−2.3 to 0.2)
T3 (highest)
−2.4 (−3.9 to −0.9)
0.002
(−1.5 to 1.5)
−2.0 (−3.5 to −0.5)
0.01
−0.7 (−2.0 to 0.5)
0.27
−0.5 (−1.7 to 0.8)
0.48
Emergency admissions
Q1 (lowest)
Baseline
Baseline
Baseline
Baseline
Q2
−0.2 (−2.1 to 1.8)
0.2
(−1.8 to 2.1)
0.4
(−1.3 to 2.0)
0.4
(−1.2 to 2.1)
Q3
−0.7 (−2.6 to 1.3)
−0.3 (−2.2 to 1.7)
1.0
(−0.6 to 2.7)
1.0
(−0.6 to 2.7)
Q4
−0.7 (−2.7 to 1.3)
−0.2 (−2.2 to 1.7)
0.8
(−0.8 to 2.3)
0.9
(−0.7 to 2.5)
Q5 (highest)
−0.9 (−2.8 to 1.1)
1.3
(−0.3 to 2.9)
1.6
(0.0 to 3.2)
0.32
−0.3 (−2.2 to 1.7)
0.66
0.10
0.04
Page 11 of 15
Maclean et al. BMC Cancer (2015) 15:500
were less likely to be diagnosed at a more advanced
stage than men (RD −3.3 % (95 % CI-4.3 % to −2.3 %) p
< 0.001). People aged 45–64 years were more likely to be
diagnosed at a more advanced stage than people aged 65
and over (RD 3.3 % (95 % CI 1.9 % to 4.6 %) p < 0.001)
but there was no difference between people aged 15–44
years and people 65 and over (RD 4.5 % (95 % CI −1.2 %
to 10.2 %) p = 0.12).
After adjustment for age, sex and deprivation, being at
a practice with a higher TWW referral rate, having no
GPs aged 50 and over and having all female GPs was associated with a lower percentage diagnosed with more
advanced stage lung cancer (Q5 vs. Q1 RD-3.3 % (95 %
CI −4.9 % to −1.7 %) p-value for trend <0.001; none vs.
some RD-2.5 % (95%CI −4.3 % to −0.7 %) p = 0.01; all vs
some. RD-4.6 % (95%CI −8.4 % to −0.7 %) p = 0.02). In
contrast being at a practice which had more patients per
GP, being at a practice with a higher TWW conversion
rate and being at a practice that had a higher emergency
admission rate was associated with a higher percentage
diagnosed at a more advanced stage (Q5 vs. Q1 RD
1.8 % (95 % CI0.2 % to 3.4 %), p-value for trend 0.01; Q5
vs. Q1 RD 4.0 % (2.4 % to 5.5 %) p-value for trend
<0.001; Q5 vs. Q1 RD 1.6 % (95%CI 0.0 % to 3.2 %)
p-value fpr trend 0.04). There is a weak negative correlation between TWW referral and TWW conversion and
this may explain some of the association between higher
TWW conversion and more advanced stage at diagnosis.
Missing stage data and multiple imputation
There was no systematic pattern of missing stage data between patient age and sex across the four common cancers.
For female breast, prostate and lung cancer people who
were more deprived were less likely to have missing stage
data. Comparison of risk difference with and without the
use of stage imputation shows very small alterations to risk
differences which did not alter trends or interpretation for
exposure variables.
Sensitivity analysis
For cancers with stage data ethnicity was missing for
36.1 % of patients with female breast cancer, 47.9 % of
prostate cancer, 33.1 % of colorectal cancer and 30.7 % of
lung cancer. To assess the impact of adjusting for ethnicity, results for patients with complete ethnicity data
adjusted for age, sex, deprivation and ethnicity were compared to an analysis excluding ethnicity. There were only
very small changes in risk differences between these analyses with no change to the trends or conclusions drawn
from the results. This is probably due to the distribution
of ethnicity with 96 % of those with staged female breast,
colorectal, lung and prostate cancer being white.
The main analysis used all relevant stage data from
NCRS (see Additional file 1: appendix 1 for description
Page 12 of 15
of collection of stage data). If only the data from the
NCRS ‘Stage best’ field was used 32,590 (81.0 %) of female breast cancers had staging data, 26,847 (78.4 %) of
prostate cancers, 25,362 (80.7 %) of colorectal cancer
and 27,134 (82.2 %) of lung cancers. Analysis to assess
the impact of using all relevant stage data compared to
using the ‘Stage Best’ field alone showed very small
changes to the risk differences for female breast, colorectal
and lung cancer. There was no change to the trends or
conclusions of the results. For prostate cancer there were
some slightly greater changes to the risk differences.
Due to the large proportion of lung cancers diagnosed
at stage 3 or 4 we conducted an analysis to compare
stage 4 with stage 1, 2 or 3. The trends for number of
patients per GP, TWW referral rate and TWW conversion rate did not alter. However the relationship between
GP demographics (age and gender) and emergency admissions were attenduated.
Discussion
We have observed that some characteristics and systems
of primary care practices are associated with the stage of
cancer at diagnosis, but these vary by cancer type. If
these associations are causal, then these results have important policy implications and could reduce cancer
mortality rates for these four cancers.
For female breast cancer being at a practice where
people thought it was easier to get an appointment and
being at a practice more likely to use the TWW referral
system may reduce more advanced stage at diagnosis.
Having only female general practitioners may hinder
diagnosis at an earlier stage. This reflects findings by
Hansen et al. [7] that even though patients of female
doctors had shorter patient delays they more often experienced longer system delays. These may suggest that access to primary care and speed of referral to secondary
care are important in the earlier diagnosis of female
breast cancer.
For prostate cancer the picture is more mixed with individual characteristics having a large influence on stage at
diagnosis which may suggest differences are due to underlying tumour biology and factors affecting patient delay.
Counter-intuitively, higher rates of colonoscopy, sigmoidoscopy and endoscopy were associated with more advanced stage at diagnosis. It is possible this reflects a
higher prevalence of gastrointestinal symptoms in areas
where less prostate specific antigen (PSA) testing is being
done, some practices focus more on colorectal cancer
than prostate cancer, or this was a type I error.
Being at a practice using more investigations for
gastrointestinal symptoms appeared to reduce more advanced stage diagnosis of colorectal cancer. This echoes
research which showed that screening sigmoidoscopy and
colonoscopy reduced colorectal cancer mortality [20].
Maclean et al. BMC Cancer (2015) 15:500
Younger patients were more likely to present with more
advanced cancers as has been noted previously in the literature [21].
For lung cancer having fewer patients per general practitioner, being at a practice more likely to use the TWW referral system and at a practice where a larger proportion
of cancers are diagnosed through TWW may reduce more
advanced stage diagnosis. This could suggest that access
to primary care and speed of referral to secondary care
could be important in the early diagnosis of lung cancer.
Interestingly men were more likely to present with advanced cancers, which could reflect health care seeking
behaviours but this pattern was not seen for colorectal
cancer. Alternatively it may reflect different smoking behaviour as male smokers consume more cigarettes per day
than women [22]. For both breast and prostate cancers,
practices in urban areas did less well than those in towns
and this may reflect the greater burden of primary care
work in such areas despite our attempts to adjust for patient level deprivation.
Hansen et al. [7] found that in Denmark, GP characteristics such as perceived GP accessibility and opportunities
for referring were associated with patient and system
delay. This is similar to our findings that access to GP
(number of patients per GP and perceived ease of getting
an appointment) and use of TWW were associated with
reduced proportion of patients diagnosed at a more
advanced stage for breast and lung cancer. We found no
evidence of an association between being able to see a preferred GP and stage of cancer at diagnosis which differ
from findings by Rogers et al. [23] who showed a negative
association between seeing a preferred GP and cancer detection rate. We found no evidence of an association between stage and total QOF points which reflects similar
findings by Levene et al. [24] with regards to specific QOF
indicators and cancer mortality. However this is different
to the findings of Bottle et al. [8] who found that higher
QOF protected against unplanned first-time admissions
for cancer. This may suggest that QOF score is important
in certain aspects of the patient journey. We found no evidence that people registered at rural GP practices were
more likely to be diagnosed at a more advanced stage than
those living in urban areas. In relation to patient level differences our findings are similar to other studies [25].
However our finding in relation to age and stage of breast
cancer are slightly unusual but this may be the result of
including cases diagnosed clinically with those diagnosed
by screening.
We have analysed data from a large proportion of four
of the most common cancers diagnosed in 2012. Linking
this to routinely collected data allowed us to analyse a
wide range of characteristics of primary care. Due to the
large number of exposure variables we conducted multiple
testing however where the p-value is very small chance
Page 13 of 15
findings remain unlikely. It is worth noting where risk differences are very small that even though statistically significant this may be due to the large sample size. We have
focused on primary care as an important aspect in diagnostic delay but there were some aspects we could not include,
for example general practitioner related factors such as
communication skills and trust, differences between general
practitioners within GP and number of consultations at
GPs [6, 23, 26, 27]. We also could not account for many
patient factors (psychosocial factors, emotional response,
support, co-morbidities or individual hospital use) or secondary care factors (different oncology services and radiological investigations) [9, 28–30]. TWW referral rate may
be influenced by primary and secondary care aseven though
primary care makes the referrals if these are not seen within
2 weeks they do not count as TWW. Further limitations include the high percentage of missing ethnicity data which
meant we were unable to include this in the multivariable
models. We could not distinguish women with breast cancer diagnosed by screening rather than symptomatic presentation as these data were incomplete within the NCRS.
This could alter the implications of the findings if there was
a correlation between exposure variables and screening detection rates at practices. In addition there is little variation
in the number of days primary care delay for breast cancer
[31] once patients have presented. However characteristics
of primary care could still influence whether patients delay
in seeking care in the first place. We could also not distinguish people with colorectal cancer diagnosed by screening
rather than symptomatic presentation. This could be important if organizational or patient level factors influencing
the effectiveness of the screening programme are themselves correlated with GP level factors, which may or may
not be true.
More advanced stage was used as a proxy marker for a
poor outcome since more advanced stage is related to lower
survival. By diagnosing someone earlier (stage 3 to stage 2
or stage 4 to stage 3 for lung cancer) one year relative survival improves; female breast cancer 91 % to 98 %, prostate
cancer 99 % to 100 %, colorectal cancer 87 % to 91 % and
lung cancer 15 % to 36 % [32]. Given the large number of
people diagnosed with breast, colorectal, lung and prostate
cancer even small risk differences have the potential to make
large differences to survival. Improving access to primary
care and use of TWW may reduce more advanced stage at
diagnosis for breast and lung cancer, and therefore improve
survival. Use of investigations for gastrointestinal symptoms
could be important to reduce more advanced stage at diagnosis, though one must also consider the impact of inappropriate investigations and the cost of these procedures.
Conclusion
We have shown that higher use of TWW may reduce more
advanced stage at diagnosis. The varied use and impact of
Maclean et al. BMC Cancer (2015) 15:500
TWW referral rate, conversion rate and detection rate
along with controversy relating to the TWW criteria highlight this as a potential area for further research [33, 34]. In
addition further research is required to understand how
and in what circumstances TWW is most effective and
cost-effective, integrating risk assessment tools into this
policy [35]. Our results suggest that improving access to
primary care, efficient use of the referral systems and faster
investigations may reduce more advanced stage diagnosis
for female breast cancer, colorectal cancer and lung cancer.
However which apects of these areas and the exact way that
they may reduce advanced stage at diagnosis requires further understanding. There were differences between the
four main cancers which suggest different policies may be
required for individual cancers to improve outcomes.
Ethics
Ethics review was not required for this study.
Additional file
Additional file 1: Appendix 1 – national cancer registration service
(ncrs) data. Supplementary table ‘a’ – exposure variables explained.
Supplementary figure ‘a’ – conceptual model. Supplementary table
‘b’ – number and percentage of tumours of each cancer type and stage.
Competing interests
All authors have completed the ICMJE uniform disclosure form at
www.icmje.org/coi_disclosure.pdf and declare: no support from any
organisation for the submitted work; no financial relationships with any
organisations that might have an interest in the submitted work in the
previous three years; no other relationships or activities that could appear to
have influenced the submitted work.
Author contributions
RM, MJ and YB conceived the study. RM, AI, TJ and JV performed the
analysis. RM drafted the manuscript and all authors critically reviewed it.
Acknowledgements
We would like to thank Sarah Purdy, William Hamilton and Sean McPhail for
their advice on the design of the study and Luke Hounsome for his
assistance in analyses of the data. We would also like to thank the PHE
Knowledge and Information Team (South West).
The study received no external funding.
Data from Health and Social Care Information Centre: Copyright © 2013, re-used
with the permission of the Health and Social Care Information Centre. All rights
reserved.
Author details
1
Speciality Registrar in Public Health, NHS England, South Plaza, Marlborough
Street, Bristol BS1 3NX, UK. 2Senior Lecturer in Epidemiology, School for
Social and Community Medicine, Canynge Hall, 39 Whatley Road, Bristol BS8
2PS, UK. 3Senior Analyst, Public Health England Knowledge and Intelligence
team (South West), 1st floor, Grosvenor House, 149 Whiteladies Road, Bristol
BS8 2RA, UK. 4Research Assistant, NIHR CLAHRC West, 9th Floor, Whitefriars,
Lewins Mead, Bristol BS1 2NT, UK. 5Public Health England Knowledge and
Intelligence team (South West), 1st floor, Grosvenor House, 149 Whiteladies
Road, Bristol BS8 2RA, UK. 6School for Social and Community Medicine,
Canynge Hall, 39 Whatley Road, Bristol BS8 2PS, UK.
Received: 6 February 2015 Accepted: 17 June 2015
Page 14 of 15
References
1. De Angelis R, Sant M, Coleman M, Francisci S, Baili P, Pierannunzio D, et al.
Cancer survival in Europe 1999–2007 by country and age: results of
EUROCARE-5—a population-based study. Lancet Oncol. 2013; 15:23–34.
doi:10.1016/S1470-2045(13)70546-1
2. Coleman M, Forman D, Bryant H, Butler J, Rachet B, Maringe C, et al. Cancer
survival in Australia, Canada, Denmark, Norway, Sweden, and the UK,
1995—2007 (the International Cancer Benchmarking Partnership): an
analysis of population-based cancer registry data. Lancet. 2011;377:127–138.
doi:10.1016/S0140-6736(10)62231-3.
3. Rutherford M, Hinchliffe S, Abel G, Lyratzopoulos G, Lambert P. Greenberg D
How much of the deprivation gap in cancer survival can be explained by
variation in stage at diagnosis: an example from breast cancer in the East of
England. Int J Cancer. 2013;133:192–200. doi:10.1002/ijc.28221.
4. Department of Health. Cancer Reform Strategy. 2007. />NHSEngland/NSF/Documents/Cancer%20Reform%20Strategy.pdf. Accessed
June 2014.
5. Neal R. Do diagnostic delays matter? Br J Cancer. 2009;101(S2):S9–12.
doi:10.1038/sj.bjc.6605384.
6. Neal R, Allgar V. Sociodemographic factors and delays in the diagnosis of
six cancers: analysis of data from the “National Survey of NHS Patients:
Cancer”. Br J Cancer. 2005;92:1971–5.
7. Hansen R, Vedsted P, Sokolowski I, Søndergaard J, Olesen F. General
practitioner characteristics and delay in cancer diagnosis. a population-based
cohort study. BMC Fam Pract. 2011;12:100. doi:10.1186/1471-2296-12-100.
8. Bottle A, Tsang C, Parsons S, Majeed A, Soljak M, Aylin P. Association
between patient and general practice characteristics and unplanned
first-time admissions for cancer: observational study. Br J Cancer.
2012;107:1213–9. doi:10.1038/bjc.2012.320.
9. Elliss-Brookes L, McPhail S, Ives A, Greenslade M, Shelton J, Hiom S, et al.
Routes to diagnosis for cancer – determining the patient journey using
multiple data sets. Br J Cancer. 2012;107:1220–6. doi:10.1038/bjc.2012.408.
10. Health and Social Care Information Centre. GPs, GP Practices Nurses and
Pharmacies. 2014. />gppractice Accessed June 2014.
11. United Kingdom Association of Cancer Registries. UK Cancer Registration.
2013. Accessed June 2014.
12. International Statistical Classification of Diseases and Related Health
Problems 10th Revision (ICD-10) Version for 2010. />classifications/icd10/browse/2010/en#/II . Accessed June 2014.
13. National Cancer Intelligence Network. General Practice Profiles for Cancer.
2012. />Accessed June 2014.
14. Health and Social Care Information Centre. Quality Outcome Framework
2011–12 - Practice level. />Accessed June 2014.
15. The GP Patient Survey. GP Patient Survey Results – National Reports and
Data. 2010–12. Accessed June 2014.
16. Gunther S, Taub N, Rogers S, Baker R. What aspects of primary care predict
emergency admission rates? A cross sectional study. BMC Health Serv Res.
2013;13:11. doi:10.1186/1472-6963-13-11.
17. Purdy S. King’s Fund; Avoiding hospital admissions. What does the research
evidence say? 2010. Accessed June 2014.
18. Health and Social Care Information Centre. General and Personal Medical
Services, England - 2002–12. />searchcatalogue?productid=10382&topics=2%2fPrimary+care+services%2fGeneral+practice%2fGeneral+Practice+workforce&sort=Relevance&size=10&page=1#top Accessed June 2014.
19. Health and Social Care Information Centre Indicator Portal. GP practice
location. (2011) Available from: />(accessed June 2014).
20. Brenner H, Stock C, Hoffmeister M. Effect of screening sigmoidoscopy and
screening colonoscopy on colorectal cancer incidence and mortality:
systematic review and meta-analysis of randomised controlled trials and
observational studies. BMJ. 2014;348:g2467 doi:10.1136/bmj.g2467.
21. Mandelblatt J, Andrews H, Kao R, Wallace R, Kemer J. The Late-Stage
Diagnosis of Colorectal Cancer: Demographic and Socioeconomic Factors. J
Public Health. 1996;86:1794-7.
22. Health and Social Care Information Centre. Health Survey for England −2013.
Chapter 8 Adult Cigarette Smoking. (2013) Available from: http://
Maclean et al. BMC Cancer (2015) 15:500
23.
24.
25.
26.
27.
28.
29.
30.
31.
32.
33.
34.
35.
Page 15 of 15
www.hscic.gov.uk/catalogue/PUB16076/HSE2013-Ch8-adult-cig-smo.pdf
(accessed May 2015).
Rogers S, Gildea C, Meechan D, Baker R. Access, continuity of care and
consultation quality: which best predicts urgent cancer referrals from general
practice? J Public Health. 2014;36:658–66. doi:10.1093/pubmed/fdt127.
Levene L, Bankart J, Mhunti K, Baker R. Association of primary care
characteristics with variations in mortality rates in England: an observational
study. PLoS One. 2012;7, e47800. doi:10.1371/journal.pone.0047800.
Lyratzopoulos G, Abel G, Brown C, Rous B, Vernon S, Roland M, et al. Sociodemographic inequalities in stage of cancer diagnosis: evidence from patients with
female breast, lung, colon, rectal, prostate, renal, bladder, melanoma, ovarian and
endometrial cancer. Ann Oncol. 2013;24:843–50. doi:10.1093/annonc/mds526.
Lyratzopoulos G, Neal R, Barbiere J, Rubin G, Abel G. Variation in number of
general practitioner consultations before hospital referral for cancer: findings
from the 2010 National Cancer Patient Experience Survey in England. Lancet
Oncol. 2012;13:353–365. doi:10.1016/S1470-2045(12)70041-4.
Jiwa M, Reid J, Handley C, Grimwood J, Ward S, Turner K, et al. Less haste
more speed: factors that prolong the interval from presentation to
diagnosis in some cancers. Fam Pract. 2004;21:299–303.
Almuammar A, Dryden C, Burr J. Factors associated with late presentation of
cancer: a limited literature review. J Radiother Pract. 2010;9:117–123.
doi:10.1017/S146039690999029X.
Hamilton W, Vedsted P. Cancer and primary care: the clinical and research
agenda. Br J Gen Pract. 2011;61:653–4. doi:10.3399/bjgp11X601523.
Macleod U, Mitchell E, Burgess C, Macdonald S, Ramirez A. Risk factors for delayed
presentation and referral of symptomatic cancer: evidence for common cancers.
B J Cancer. 2009;101 Suppl 2:S92–101. doi:10.1038/sj.bjc. 6605398.
Lyratzopoulos G, Abel GA, McPhail S, Neal RD, Rubin GP. Measures of
promptness of cancer diagnosis in primary care: secondary analysis of
national audit data on patients with 18 common and rarer cancers. Br J
Cancer. 2013;108:686–90. doi:10.1038/bjc.2013.1.
The National Cancer Registration Service - Eastern Office. Cancer Survival Statistics.
Accessed June 2014.
Baughan P, O’Neill B, Fletcher E. Auditing the diagnosis of cancer in primary
care: the experience in Scotland. Br J Cancer. 2009;101 Suppl 2:S87–91.
doi:10.1038/sj.bjc.6605397.
Meechan D, Gildea C, Hollingworth L, Richards D, MR, Rubin G. Variation in
use of the 2-week referral pathway for suspected cancer: a cross sectional
analysis. Br J Gen Pract. 2012;62:e590–7. doi:10.3399/bjgp12X654551.
Hamilton W, Green T, Martins T, Elliott K, Rubin G, Macleod U. Evaluation of
risk assessment tools for suspected cancer in general practice: a cohort
study. Br J Gen Pract. 2013;63:e30–6. doi:10.3399/bjgp13X660751.
Submit your next manuscript to BioMed Central
and take full advantage of:
• Convenient online submission
• Thorough peer review
• No space constraints or color figure charges
• Immediate publication on acceptance
• Inclusion in PubMed, CAS, Scopus and Google Scholar
• Research which is freely available for redistribution
Submit your manuscript at
www.biomedcentral.com/submit