MiR-190b, the highest up-regulated miRNA in ERα-positive compared to ERα-negative breast tumors, a new biomarker in breast cancers?
Bạn đang xem bản rút gọn của tài liệu. Xem và tải ngay bản đầy đủ của tài liệu tại đây (696.58 KB, 14 trang )
Cizeron-Clairac et al. BMC Cancer (2015) 15:499
DOI 10.1186/s12885-015-1505-5
RESEARCH ARTICLE
Open Access
MiR-190b, the highest up-regulated miRNA in
ERα-positive compared to ERα-negative breast
tumors, a new biomarker in breast cancers?
Geraldine Cizeron-Clairac, François Lallemand, Sophie Vacher, Rosette Lidereau, Ivan Bieche† and Celine Callens*†
Abstract
Background: MicroRNAs (miRNAs) show differential expression across breast cancer subtypes and have both
oncogenic and tumor-suppressive roles. Numerous microarray studies reported different expression patterns of
miRNAs in breast cancers and found clinical interest for several miRNAs but often with contradictory results. Aim
of this study is to identify miRNAs that are differentially expressed in estrogen receptor positive (ER+) and negative
(ER−) breast primary tumors to better understand the molecular basis for the phenotypic differences between these
two sub-types of carcinomas and to find potential clinically relevant miRNAs.
Methods: We used the robust and reproductive tool of quantitative RT-PCR in a large cohort of well-annotated 153
breast cancers with long-term follow-up to identify miRNAs specifically differentially expressed between ER+ and ER−
breast cancers. Cytotoxicity tests and transfection experiments were then used to examine the role and the regulation
mechanisms of selected miRNAs.
Results: We identified a robust collection of 20 miRNAs significantly deregulated in ER+ compared to ER− breast
cancers : 12 up-regulated and eight down-regulated miRNAs. MiR-190b retained our attention as it was the miRNA the
most strongly over-expressed in ER+ compared to ER− with a fold change upper to 23. It was also significantly upregulated in ER+/Normal breast tissue and down-regulated in ER−/Normal breast tissue. Functional experiments showed
that miR-190b expression is not directly regulated by estradiol and that miR-190b does not affect breast cancer cell lines
proliferation. Expression level of miR-190b impacts metastasis-free and event-free survival independently of ER status.
Conclusions: This study reveals miR-190b as the highest up-regulated miRNA in hormone-dependent breast cancers.
Due to its specificity and high expression level, miR-190b could therefore represent a new biomarker in hormonedependent breast cancers but its exact role carcinogenesis remains to elucidate.
Keywords: Breast cancer, MicroRNA, Estrogen receptor, miR-190b
Background
Breast cancer is the leading cause of cancer death in
women worldwide. Despite advances in the understanding of cancer pathogenesis and improvement in diagnosis and treatment over the past few decades, biomarkers
of clinical interest are not so numerous. Now it is well
documented that endogenous estrogens known as an
important regulator of development, growth and differentiation of the normal mammary gland play also a
* Correspondence:
†
Equal contributors
Service de Génétique, Unité de Pharmacogénomique, Institut Curie, 26 rue
d’ulm, 75005 Paris, France
major role in the development and progression of breast
cancer [1]. The mammary cell proliferation signals are
mediated in part by the estrogen receptor alpha (ER).
The expression of ER in breast tumors is frequently used
to separate breast cancer patients in a clinical setting
both as an important prognostic marker for prognosis
and in predicting the likelihood of response to endocrine
therapy. Although the majority of primary breast cancers
are ER-positive (ER+) and respond well to antiestrogen
therapy, up to one-third of patients with breast cancer
lack ER (ER−) at the time of diagnosis, and a fraction of
breast cancers that are initially ER+ lose ER expression
during tumor progression [2]. These patients fail to
© 2015 Cizeron-Clairac et al. This is an Open Access article distributed under the terms of the Creative Commons Attribution
License ( which permits unrestricted use, distribution, and reproduction in
any medium, provided the original work is properly credited. The Creative Commons Public Domain Dedication waiver
( applies to the data made available in this article, unless otherwise stated.
Cizeron-Clairac et al. BMC Cancer (2015) 15:499
respond to antiestrogen therapy and have higher tumor
aggressiveness and poor prognosis. Previous studies have
shown that ER absence is a result of hypermethylation
of CpG islands in the 5’ region of ER coding gene
(ESR1) in a fraction of breast cancer [2]. However, the
molecular mechanism of the rest of the ER− breast cases
and the molecule(s) involving ER hypermethylation remain largely unknown. Other mechanisms involved in
altering ER expression have been identified, including mutations within the open reading frame of ESR1 [3] as well
as ESR1 amplification increasing the ER protein expression [4]. Recently, ESR1 ligand-binding domain mutations
were described in hormone-resistant breast cancers [5].
Since their first description in C. Elegans in 1993, increasing numbers of studies showing frequent deregulation of microRNAs (miRNAs) in human breast cancers
and association of some of them with cancer metastasis
and poor prognosis suggesting an important role of miRNAs in cancer development and progression [6, 7]. miRNAs are small non-coding RNA gene products able to
regulate gene expression at the post-transcriptional level.
Thus, today, miRNAs are increasingly seen as important
regulators of gene expression in breast cancers, acting
either as oncogenes (such as miR-21) or tumor suppressors (such as let-7), and affecting through different
mechanisms many cellular processes that are routinely
altered in cancer, such as differentiation, proliferation,
apoptosis, metastasis and telomere maintenance [8–11].
MiRNAs are also thought of as biomarkers in cancer
diagnosis and prognosis [12]. The diagnostic potential of
circulating miRNAs is based mainly on their noninvasive detection in serum and plasma and on their
high resistance under difficult environmental conditions,
offering them therefore an emerging role in developing
new follow-up markers and strategies for cancer treatment [13–15]. Moreover, studies suggested that expression profiles of miRNAs are informative for the
classification of human breast cancers [16–18]. Numerous datas are available regarding the miRNA expression
in ER+ and ER− breast cancer tissues and come mainly
from studies using miRNA microarray techniques [16,
19, 20]. Results and conclusions from these old studies
are generally not consistent and sometimes even conflicting. More recently, miRNA landscape in breast cancer was deciphering in a large cohort with matching
detailed clinical annotation and long-term follow-up but
not particularly taking into account ER+ and ER− contexts [17]. Taken together, these finding have prompted
us to use the robust quantitative RT-PCR technology to
identify miRNAs that are differentially expressed in ER+
and ER− in breast primary tumors with the aim to better
understand the molecular basis for the phenotypic differences between these two sub-types of carcinomas and
to find potential clinically relevant miRNAs.
Page 2 of 14
Methods
Patients and samples
Breast tumor samples were obtained from 184 postmenopausal women with primary unilateral non metastatic breast adenocarcinoma who underwent biopsies
or initial surgery at the Curie Institute/René Huguenin
Hospital (Saint-Cloud, France) between 1984 and 2009.
Each patient signed a written informed consent form
and this study was approved by the Curie Institute/
René Huguenin Hospital ethics committee. Immediately
after biopsy or surgery, the tumor samples were stored
in liquid nitrogen in −80 °C until RNA extraction. All
samples analyzed contained more than 70 % of tumor
cells. Tumor samples included 106 ER+ and 78 ER− tumors. ER status was determined at the protein level by
using biochemical methods (Dextran-coated charcoal
method until 1988 and enzyme immunoassay thereafter) and was confirmed at mRNA level by RT-PCR.
Control samples consisted of twelve specimens of normal breast tissue obtained from women undergoing
cosmetic breast surgery or adjacent normal breast tissue from breast cancer patients [21]. Thirty-one of
breast tumor samples, comprising 21 ER+ and 10 ER−,
as well as 8 normal breast samples, were used as a RTPCR pan-miRNA screening set to identify and select
miRNAs differentially expressed in ER+ compared to
ER−. These selected miRNAs were then validated in the
remaining 153 breast tumor samples comprising 85 ER+
and 68 ER− compared to eight normal breast samples.
Clinicopathological characteristics of patients in relation
to metastatic free survival in the screening and validation
series are provided in Table 1. In the screening set, we voluntary included more SBR grade III tumors with the aim
to facilitate identification of robust genes differentially
expressed whereas the validation set is totally representative of breast cancers treated in the Curie institute/René
huguenin hospital between 1984 and 2009.
RNA extraction
Total RNA was extracted from breast tissue by using the
acid-phenol guanidium method. Total RNA concentration was quantified using a NanoDrop™ spectrophotometer. RNA quality was determined by agarose gel
electrophoresis and ethidium bromide staining. The 18S
and 28S RNA bands were visualized under ultraviolet
light.
miRNA expression profiling
MiRNA expression levels in samples were quantified by
quantitative RT-PCR (RT-qPCR) using the SYBR Green
Master Mix kit on the ABI Prism 7900 Sequence Detection System (Perkin-Elmer Applied Biosystems, Foster
City, CA, USA). The Human miScript Primer Assays
version 9.0 and 11.0 from Qiagen, designed to detect
Cizeron-Clairac et al. BMC Cancer (2015) 15:499
Page 3 of 14
Table 1 Pathological and clinical characteristics of patients in relation to metastasis free survival (MFS) in the screening and validation sets
Screening set (n = 31)
Characteristic
Validation set (n = 153)
Number of patients
Number of
events (%)
≤65 years
17
3 (18)
>65 years
14
3 (21)
Age
MFS p-valuea
Number of patients
Number of
events (%)
67
33 (49)
86
27 (31)
0.6228
SBR histological gradeb,c
0.0184
0.0453
0.0008
I + II
11
0 (0)
96
31 (32)
III
19
6 (32)
54
27 (50)
Negative
9
2 (22)
33
11 (33)
Positive
21
3 (14)
112
47 (42)
c
Lymph node status
0.6825
Lymph node status
0.6493
0.3521
0.0005
0
9
2 (22)
33
11 (33)
[1–3]
18
2 (11)
83
27 (33)
>3
3
1 (33)
29
20 (69)
Macroscopic tumor sizec
0.4955
0.0267
≤25 mm
20
3 (15)
61
18 (30)
>25 mm
11
3 (27)
83
40 (48)
≤30 mm
26
5 (19)
92
34 (37)
>30 mm
5
1 (20)
52
24 (46)
Macroscopic tumor sizec
0.9925
Estrogen receptor statusc
0.1375
0.2867
0.0005
Negative
10
1 (10)
68
34 (50)
Positive
21
5 (24)
85
26 (31)
Negative
11
1 (9)
68
34 (50)
Positive
20
5 (25)
85
26 (31)
c
Progesterone receptor status
0.2136
HER2 statusc
0.0005
0.8493
0.0595
Negative
22
5 (23)
111
41 (37)
Positive
5
1 (20)
42
19 (45)
No treatment
4
0 (0)
13
8 (62)
Chemotherapy
1
0 (0)
32
14 (44)
Hormone therapy
21
5 (24)
93
31 (33)
Chemotherapy and hormone therapy
1
0 (0)
9
6 (67)
c
Treatment
MFS p-valuea
0.6248
0.0393
a
Log-rank test
b
Scarff Bloom Richardson classification
c
Histological or treatment information were not available for all tumors
804 human miRNA probes, were used according to the
manufacturer’s guidelines. Small nucleolar RNA RNU44
(Qiagen) was used as endogenous control to normalize
miRNA expression levels. The relative expression level
of each miRNA, expressed as N-fold difference in target
miRNA expression relative toRNU44, and termed "Ntarget",
was calculated as follows: Ntarget = 2ΔCtsample. The value of
the cycle threshold (ΔCt) of a given sample was determined
by subtracting the Ct value of the target miRNA from
the average Ct value of RNU44. The Ntarget values of
samples were subsequently normalized such that the
median Ntarget value of normal breast samples was
one. To overcome limits of detection of RT-qPCR, and
be sure in expression values of miRNAs, we have considered a miRNA as relevant when the Ct values were
lower than 30 in at least 50 % of all samples analyzed.
Cizeron-Clairac et al. BMC Cancer (2015) 15:499
The relative expression of each miRNA was characterized by the median and the range, and a nonparametric Mann–Whitney test was used for statistical
analysis of differences in miRNA expression between
groups.
Gene expression profiling
In the validation series, mRNA expression levels of Dicer
(NM_177438), Drosha (NM_013235), AGO2 (NM_012154),
DGCR8 (NM_022720), four protein-coding genes required to the miRNA biogenesis, and six host genes
CTDSPL (NM_005808.2), EVL (NM_016337.2), NFYC
(NM_014223.4) OGFRL1 (NM_024576.3), CTDSP1
(NM_021198.1), PTMA (NM_002823.4) containing the
identified miRNAs were measured by RT-qPCR.
Primers and PCR conditions are available on request,
and the RT-qPCR protocol is described above. The
mRNA expression level of each protein-coding gene is
relative to the TBP gene (NM_003194).
Breast cancer cell lines
Expression levels of selected miRNAs were measured by
RT-qPCR in a collection of RNAs from 30 human breast
cancer cell lines commonly used including 19 ER− (BT-20,
BT-549, HCC-38, HCC-70, HCC-202, HCC-1143, HCC1187, HCC-1569, HCC-1599, HCC-1937, HCC-1954, Hs578 T, MDA-MB-157, MDA-MB-231, MDA-MB-435 s,
MDA-MB-436, MDA-MB-453, MDA-MB-468 and SKBR-3) and 11 ER+ (BT-474, BT-483, CAMA1, HCC-1428,
HCC-1500, MCF-7, MDA-MB-134VI, MDA-MB-361,
MDA-MB-415, T-47D and ZR-75-1). These RNAs were
provided by the transfer department of Curie Institute.
For each miRNA and each cell line, mRNA levels were
normalized such that the median value of the ER− breast
cancer cell lines was one.
The effects of 17β-estradiol (E2) on the miRNA expression were studied on two ERα-positive breast cancer
cell lines whose growth is known to be stimulated by E2 :
MCF-7 cell line for all selected miRNAs and T-47D cell
line for miR-190b. They were cultured in either minimum
essential medium (MEM) or Dulbecco’s modified Eagle
medium (DMEM) supplemented with 10 % fetal calf/
bovine serum and antibiotics (penicillin 50 g/ml,
streptomycin 50 g/ml and neomycin 100 g/ml) at 37 °C
with 5 % CO2. For experiments using E2, MCF-7 and
T-47D were grown in phenol red-free minimum essential medium (MEM) supplemented with 5 % charcoaldextran-stripped fetal calf serum for at least 3 days
before treatment. The cells were then treated with E2
(Sigma) diluted in ethanol (EtOH) at 1 nM for MCF-7
and 10 nM for T-47D, or with vehicle EtOH (control
cells). RNAs were extracted from these cells after 6 h,
18 h and 4 days of the presence of E2 and the mRNA
levels measured by RT-PCR were normalized such that
Page 4 of 14
the median value of control cells was of one. Three independent experiments were realized for each time and
each condition. To verify the effects of E2 on growth of
cells, mRNA expression of pS2/TFF1 (NM_003225), a
well-known ERα-induced gene, was also measured by
RT-qPCR on the treated cells.
The effects of miR-190b expression on cellular proliferation were studied on breast cancer cell lines ER+
MCF-7 and T-47D that were transfected with antagomir
against miR-190b (sequence complementary to miR190b which blocks its effect) and on breast cancer cell
line ER− MD-MBA-231 that was transfected with a miR190b mimic (double-stranded RNA which mimics
mature endogenous miR-190b) using a 3-(4,5-dimethyl-2thiazolyl)-2,5-diphenyl-2H-tetrazolium bromide (MTT)
proliferation assay. In brief, after transient transfection of
cells for 24 h with 40 nM of antagomir against miR-190b
or mimic of miR-190b (synthetized by Qiagen), the cells
were growth in normal medium for 48, 72 or 120 h to be
then treated with 0.5 mg/ml of the MTT labeling reagent
at 37 °C for 1 to 3 h and lysed in 150 μl of dimethyl sulfoxide at room temperature for 30 min. The cell viability was
thus determined by reading the absorbance at 450 to
570 nm of signal generated by MTT reduction which is
directly proportional to the cell number. For each cell line,
the data were collected from three independent experiments and compared to the control group obtained by
transfection of non-targeting siRNA as negative control in
miRNA inhibition experiments or miRNA inhibitor as
negative control in miRNA mimic experiment.
Survival analysis
Metastasis-free survival (MFS) was determined as the
interval between initial diagnosis and detection of the
first metastasis. Survival distributions were estimated by
the Kaplan-Meier method, and the significance of differences between survival rates was ascertained with the
log-rank test. The Cox proportional hazards regression
model was used to assess prognostic significance, and
the results are presented as hazard ratios and 95 % confidence intervals (CIs). Statistical analyses were performed using GraphPad Prism 5 software.
Results
Differential miRNA expression between ER+ and ER− breast
tumors
To identify miRNA expression profiles in breast cancer
according to ER status, expression levels of 804 miRNAs
were measured by RT-qPCR technology in a welldefined series of 21 ER+ and 10 ER− breast tumors and
in 8 normal breast tissues (Additional file 1: Table S1).
MiRNAs with high Ct values in this screening set and
miRNAs with very low expression levels (indicated by an
asterisk after their name) were not more studied,
Cizeron-Clairac et al. BMC Cancer (2015) 15:499
Page 5 of 14
resulting in a list of 333 informative miRNAs (Additional
file 2: Table S2).
Among these 333 miRNAs a Mann–Whitney test
identified 155 miRNAs that were significantly differently expressed in ER+ compared to ER− tumors with a
p-value < 0.05 : 15 miRNAs were up-regulated and 140
miRNAs were down-regulated. We then selected miRNAs that were the most strongly deregulated and for
which the specificity of RT-qPCR amplification was
verified on the dissociation curve for RT-qPCR validation in a larger independent series of breast tumors.
Thus, we focused our study on 11 miRNAs for which
the expression level was increased by 2-fold in ER+
compared to ER− tumors and 7 miRNAs for which the
expression level was decreased by 4-fold in ER+ compared to ER−tumors (Table 2).
miRNAs associated with ER status in an independent
validation series
The expression levels of these 18 miRNAs selected in
the screening series were then verified in a validation
series including 153 breast tumors (85 ER+ and 68 ER−)
and eight normal breast tissues (Table 3).
In these validation series, we also measured the expression levels of 12 miRNAs reported by the literature
to be particularly deregulated in ER+ breast tumors : let7a and let-7b [22, 23], miR-18a and miR-18b [24], miR21 [25], miR-22 [26], miR-155 [27, 28], miR-206 [29] and
mir-221 and 222 [30] as well as miR-19a and miR-92a1,
which, with miR-18a, belonged to the miR-17-92 cluster
[31] (Table 3).
Among the 11 up-regulated miRNAs selected from the
screening series, except miR-451, we validated the upregulation of miR-190b, miR-101-1, miR-193b, miR-3425p, miR-376c, miR-143, miR-30c2, miR-30e, miR-26a1
and miR-26b in ER+ compared to ER− (Table 3). Among
the 12 miRNAs selected from the literature, we found 2
other miRNAs up-regulated in ER+ compared to ER−:
let-7a1 and let-7b. However among these 12 upregulated miRNAs, we identified 5 different expression
profiles according to their expression in ER+/Normal and
ER−/Normal. Eight miRNAs (miR-26a1, miR-101-1, let-7b,
miR-30c2, miR-143, miR-26b, miR-376c and let-7a1)
showed a significant decrease of their expression in both
ER+ and in ER− compared to normal breast tissue (see
miR-26a1 for example in Additional file 3: Figure S1A)
Table 2 18 miRNAs significantly differentially expressed between ER+ and ER− breast tumors in the screening series
Official
name
ER+ breast
tumors (n = 21)
Normal breast
tissue (n = 8)
ER− breast
tumors (n = 10)
ER+/ER−
FC
p-value
−
+
11 miRNAs up-regulated in ER compared to ER with a FC > 2
miR-190b
1.0 (0.06-3.33)
14.5 (2.41-51.7)
0.46 (0.07-6.33)
31.26
<0.0001
miR-101-1
1.0 (0.00-2.21)
0.40 (0.05-1.23)
0.08 (0.01-0.48)
4.94
0.0033
miR-193b
1.0 (0.12-2.65)
1.87 (0.20-8.68)
0.48 (0.24-2.37)
3.89
0.0106
miR-342-5p
1.0 (0.63-1.74)
2.61 (0.30-7.37)
0.94 (0.32-2.87)
2.77
0.0296
miR-376c
1.0 (0.00-3.40)
0.53 (0.19-1.40)
0.20 (0.01-0.59)
2.60
0.0083
miR-451
1.0 (0.01-3.47)
0.15 (0.04-1.78)
0.06 (0.00-0.19)
2.55
0.0019
miR-143
1.0 (0.01-2.24)
0.26 (0.10-1.11)
0.10 (0.01-0.35)
2.52
0.0094
miR-30c2
1.0 (0.04-8.70)
1.99 (0.15-11.3)
0.87 (0.07-3.41)
2.29
0.0329
miR-30e
1.0 (0.11-9.13)
3.02 (0.29-13.6)
1.41 (0.08-5.73)
2.15
0.0405
miR-26a1
1.0 (0.09-2.57)
0.59 (0.28-3.86)
0.28 (0.08-0.86)
2.10
0.0014
miR-26b
1.0 (0.08-2.57)
0.52 (0.21-2.79)
0.25 (0.04-0.66)
2.10
0.0050
4.25 (0.68-41.6)
−7.29
0.0008
+
−
7 miRNAs down-regulated in ER compared to ER with a FC > 4
miR-654-3p
1.0 (0.15-4.36)
0.58 (0.10-4.89)
miR-203
1.0 (0.16-3.97)
1.54 (0.12-48.9)
8.86 (1.30-36.4)
−5.76
0.0073
miR-146a
1.0 (0.07-2.95)
0.70 (0.07-4.48)
3.71 (0.27-15.3)
−5.30
0.0106
miR-494
1.0 (0.24-3.18)
0.20 (0.03-1.68)
0.99 (0.11-1.86)
−4.97
0.0191
miR-338-5p
1.0 (0.51-5.60)
0.40 (0.19-1.07)
1.92 (0.67-3.41)
−4.82
<0.0001
miR-891a
1.0 (0.24-2.43)
0.34 (0.17-1.28)
1.63 (0.28-2.81)
−4.77
0.0025
miR-1244
1.0 (0.22-3.30)
1.12 (0.09-2.79)
4.86 (0.76-17.5)
−4.33
0.0050
Results in ER+ and ER− tumors are expressed as the median (range) of miRNA level relative to normal breast tissues and the difference in miRNA expression
between ER+ and ER− were analysed for significance with the Mann–Whitney test. The miRNAs are ranked according to the fold change (FC) calculated between
ER+ and ER−
Cizeron-Clairac et al. BMC Cancer (2015) 15:499
Page 6 of 14
Table 3 Relative miRNA expression levels of the 30 selected miRNAs between ER+ and ER− breast tumors in the validation series
Official
name
Normal
breast tissue (n = 8)
ER+ breast
tumors (n = 85)
ER−breast
tumors (n = 68)
ER+/ER−
FC
p-value
11 up-regulated miRNAs selected in the screening series
miR-190b
1.0 (0.32-1.57)
6.34 (0.71-32.3)
0.27 (0.02-6.23)
23.30
<0.0001
miR-101-1
1.0 (0.69-8.05)
0.30 (0.05-2.10)
0.15 (0.01-0.92)
2.01
<0.0001
miR-193b
1.0 (0.43-1.79)
1.44 (0.10-9.17)
1.00 (0.11-4.45)
1.43
0.0191
miR-342-5p
1.0 (0.78-2.16)
2.03 (0.29-19.4)
0.93 (0.10-3.65)
2.18
<0.0001
miR-376c
1.0 (0.52-3.04)
0.14 (0.02-1.55)
0.10 (0.02-0.83)
1.43
0.0064
miR-451
1.0 (0.32-11.1)
0.17 (0.02-14.0)
0.14 (0.01-9.77)
1.23
ns
miR-143
1.0 (0.45-2.72)
0.21 (0.03-1.40)
0.14 (0.02-0.74)
1.52
0.0140
miR-30c2
1.0 (0.69-1.72)
0.54 (0.12-3.06)
0.34 (0.09-1.17)
1.60
<0.0001
miR-30e
1.0 (0.70-2.98)
0.79 (0.12-4.57)
0.47 (0.10-2.28)
1.68
<0.0001
miR-26a1
1.0 (0.77-4.06)
0.34 (0.11-1.78)
0.09 (0.02-0.47)
3.64
<0.0001
miR-26b
1.0 (0.68-4.38)
0.49 (0.15-2.93)
0.34 (0.06-1.64)
1.44
0.0008
7 down-regulated miRNAs selected in the screening series
miR-654-3p
1.0 (0.72-1.34)
0.30 (0.05-2.68)
0.66 (0.04-17.8)
−2.16
<0.0001
miR-203
1.0 (0.51-2.43)
0.88 (0.02-5.78)
1.51 (0.05-19.6)
−1.72
0.0059
miR-146a
1.0 (0.54-3.71)
0.70 (0.07-3.63)
0.95 (0.10-4.30)
−1.36
0.0344
miR-494
1.0 (0.85-2.17)
0.65 (0.02-6.96)
0.69 (0.02-9.03)
−1.07
ns
miR-338-5p
1.0 (0.79-1.78)
0.84 (0.19-4.66)
0.96 (0.12-5.08)
−1.15
ns
miR-891a
1.0 (0.77-1.64)
1.37 (0.14-8.43)
2.07 (0.37-15.5)
−1.51
ns
miR-1244
1.0 (0.73-1.69)
1.23 (0.16-5.11)
2.34 (0.35-25.3)
−1.91
<0.0001
12 miRNAs selected from the literature
let-7a
1.0 (0.73-1.79)
0.58 (0.15-2.00)
0.47 (0.11-2.99)
1.24
0.0055
let-7b
1.0 (0.71-1.69)
0.53 (0.08-2.04)
0.31 (0.04-0.82)
1.75
<0.0001
miR-18a
1.0 (0.49-3.33)
0.50 (0.06-2.53)
1.12 (0.12-23.9)
−2.24
<0.0001
miR-18b
1.0 (0.47-4.45)
0.50 (0.07-3.52)
1.04 (0.13-25.3)
−2.07
<0.0001
miR-19a
1.0 (0.70-2.13)
0.34 (0.03-2.61)
0.42 (0.02-14.4)
−1.24
ns
miR-21
1.0 (0.49-5.26)
2.05 (0.41-16.6)
1.84 (0.21-9.53)
1.12
ns
miR-22
1.0 (0.38-4.51)
0.71 (0.12-12.9)
0.66 (0.09-3.36)
1.08
ns
miR-92a1
1.0 (0.68-1.40)
0.32 (0.10-1.17)
0.49 (0.09-8.95)
−1.54
<0.0001
miR-155
1.0 (0.55-4.24)
2.06 (0.52-10.9)
3.97 (0.35-32.0)
−1.93
<0.0001
miR-206
1.0 (0.01-2.28)
0.25 (0.02-7.71)
0.32 (0.01-2.74)
−1.29
ns
miR-221
1.0 (0.65-1.92)
0.40 (0.07-4.24)
0.53 (0.05-5.55)
−1.31
ns
miR-222
1.0 (0.63-2.30)
0.39 (0.06-2.68)
0.50 (0.04-3.88)
−1.28
ns
Results in ER+ and ER− tumors are expressed as the median (range) of miRNA level relative to normal breast tissues. For each miRNA, we report the fold-change
(FC) between ER+ and ER− tumors and the p-value associated to Mann–Whitney test (ns for not significant)
but with a significantly greater decrease in ER−/Normal
than in ER+/Normal (FC ranging from 2.1 to 11.1 and
from 1.7 to 7.1, respectively) (Table 4). The downregulation of miR-30e was specific to ER− (Additional
file 3: Figure S1B) since its expression was not differentially expressed in ER+/Normal but significantly underexpressed in ER−/Normal. MiR-193b did not particularly
retain our attention to the extent that this miRNA was
deregulated neither in ER+/Normal nor in ER−/Normal
(Additional file 3: Figure S1C). MiR-342-5p was significantly up-regulated in ER+/Normal but not differentially
expressed in ER−/Normal (Additional file 3: Figure S1D),
revealing a specific up-regulation of miR-342-5p in ER+.
Finally, miR-190b retained our attention as it was the
miRNA the most strongly over-expressed in ER+ compared to ER− with a FC upper to 23, much higher than FC
of other up-regulated miRNAs (Table 3, Additional file 3:
Figure S1E). Moreover the ER+ breast tumors showed a
Cizeron-Clairac et al. BMC Cancer (2015) 15:499
Page 7 of 14
Table 4 Relative miRNA expression levels of the 30 selected miRNAs between ER+ or ER− breast tumors and normal breast
tissues
Official
Name
Normal
breast tissue (n = 8)
ER+ breast
tumors (n= 85)
ER+/Normal
FC
p-value
ER− breast
tumors (n= 68)
ER−/Normal
FC
p-value
12 miRNAs up-regulated in ER+ compared to ER−
miR-190b
1.0 (0.32-1.57)
6.34 (0.71-32.3)
6.34
<0.0001
0.27 (0.02-6.23)
−3.70
0.0284
miR-26a1
1.0 (0.77-4.06)
0.34 (0.11-1.78)
−2.94
<0.0001
0.09 (0.02-0.47)
−11.11
<0.0001
miR-342-5p
1.0 (0.78-2.16)
2.03 (0.29-19.4)
2.03
0.0026
0.93 (0.10-3.65)
−1.07
ns
miR-101-1
1.0 (0.69-8.05)
0.30 (0.05-2.10)
−3.33
<0.0001
0.15 (0.01-0.92)
−6.67
<0.0001
let-7b
1.0 (0.71-1.69)
0.53 (0.08-2.04)
−1.89
0.0007
0.31 (0.04-0.82)
−3.23
<0.0001
miR-30e
1.0 (0.70-2.98)
0.79 (0.12-4.57)
−1.27
ns
0.47 (0.10-2.28)
−2.13
0.0005
miR-30c2
1.0 (0.69-1.72)
0.54 (0.12-3.06)
−1.85
0.0032
0.34 (0.09-1.17)
−2.94
<0.0001
miR-143
1.0 (0.45-2.72)
0.21 (0.03-1.40)
−4.76
<0.0001
0.14 (0.02-0.74)
−7.14
<0.0001
miR-26b
1.0 (0.68-4.38)
0.49 (0.15-2.93)
−2.04
0.0034
0.34 (0.06-1.64)
−2.94
0.0001
miR-376c
1.0 (0.52-3.04)
0.14 (0.02-1.55)
−7.14
<0.0001
0.10 (0.02-0.83)
−10.00
<0.0001
miR-193b
1.0 (0.43-1.79)
1.44 (0.10-9,17)
1.44
ns
1.00 (0.11-4.45)
1.00
ns
let-7a
1.0 (0.73-1.79)
0.58 (0.15-2.00)
−1.72
0.0017
0.47 (0.11-2.99)
−2.13
0.0002
−2.00
0.0074
1.12 (0.12-23.9)
1.12
ns
+
−
8 miRNAs down-regulated in ER compared to ER
miR-18a
1.0 (0.49-3.33)
0.50 (0.06-2.53)
miR-654-3p
1.0 (0.72-1.34)
0.30 (0.05-2.68)
−3.33
0.0001
0.66 (0.04-17.8)
−1.51
ns
miR-18b
1.0 (0.47-4.45)
0.50 (0.07-3.52)
−2.00
0.0063
1.04 (0.13-25.3)
1.04
ns
miR-155
1.0 (0.55-4.24)
2.06 (0.52-10.9)
2.06
0.0181
3.97 (0.35-32.0)
3.97
0.0019
miR-1244
1.0 (0.73-1.69)
1.23 (0.16-5.11)
1.23
ns
2.34 (0.35-25.3)
2.34
0.0073
miR-203
1.0 (0.51-2.43)
0.88 (0.02-5.78)
−1.14
ns
1.51 (0.05-19.6)
1.51
ns
miR-92a1
1.0 (0.68-1.40)
0.32 (0.10-1.17)
−3.12
<0.0001
0.49 (0.09-8.95)
−2.04
0.0007
miR-146a
1.0 (0.54-3.71)
0.70 (0.07-3.63)
−1.43
ns
0.95 (0.10-4.25)
−1.05
ns
10 miRNAs not differentially expressed in ER+ compared to ER−
miR-451
1.0 (0.32-11.1)
0.17 (0.02-14.0)
−5.88
0.0009
0.14 (0.01-9.77)
−7.14
0.0003
miR-21
1.0 (0.49-5.26)
2.05 (0.41-16.6)
2.05
0.0269
1.84 (0.21-9.53)
1.84
ns
miR-22
1.0 (0.38-4.51)
0.71 (0.12-12.9)
−1.41
ns
0.66 (0.09-3.36)
−1.51
ns
miR-494
1.0 (0.85-2.17)
0.65 (0.02-6.96)
−1.54
0.0462
0.69 (0.02-9.03)
−1.45
0.0449
miR-338-5p
1.0 (0.79-1.78)
0.84 (0.19-4.66)
−1.19
ns
0.96 (0.12-5.08)
−1.04
ns
miR-19a
1.0 (0.70-2.13)
0.34 (0.03-2.61)
−2.94
0.0003
0.42 (0.02-14.4)
−2.38
0.0037
miR-222
1.0 (0.63-2.30)
0.39 (0.06-2.68)
−2.56
0.0001
0.50 (0.04-3.88)
−2.00
0.0015
miR-206
1.0 (0.01-2.28)
0.25 (0.02-7.71)
−4.00
0.0156
0.32 (0.01-2.74)
−3.12
0.0114
miR-221
1.0 (0.65-1.92)
0.40 (0.07-4.24)
−2.50
0.0004
0.53 (0.05-5.55)
−1.89
0.0098
miR-891a
1.0 (0.77-1.64)
1.37 (0.14-8.43)
1.37
ns
2.07 (0.37-15.5)
2.07
0.0381
Results in ER+ and ER− breast tumors are expressed as the median (range) of miRNA level relative to normal breast tissues. For each miRNA, we report the foldchange (FC) between ER+ or ER− breast tumors and normal breast tissue and the p-value associated to Mann-Whitney’s test (ns for not significant)
miR-190b up-regulation compared to normal breast tissue
with a FC of 6.34 whereas the ER− breast tumors, a downregulation with a FC of −3.70 (Table 4).
Among the seven down-regulated miRNAs selected
from the screening series, under-expression of four miRNAs, miR-654-3p, miR-203, miR-146a and miR-1244, in
ER+ compared to ER− was confirmed in the validation
series (Table 3). Among the miRNAs selected from the
literature, we found four other miRNAs down-regulated
in ER+ compared to ER−: miR-18a, miR-18b, miR-92a1
and miR-155. Among these eight down-regulated miRNAs, we identified five different expression profiles according to their expression in ER+/Normal and RE−/Normal
(Additional file 4 and Table 4). The first profile concerned
miR-18a, miR-18b and miR-654-3p (see miR-654-3p for
example in Additional file 4: Figure S2A) that were not
Cizeron-Clairac et al. BMC Cancer (2015) 15:499
Page 8 of 14
differentially expressed in ER−/Normal but significantly
under-expressed in ER+/Normal, revealing a specific
down-regulation of miR-18a, miR-18b and miR-654-3p in
ER+ (Table 4). We found two miRNAs that were not differentially expressed in breast cancer, miR-203 and miR-146a
(see miR-146a for example in Additional file 4: Figure S2B)
and one miRNA, miR-92a1, that was significantly downregulated in breast cancer (Additional file 4: Figure S2C).
The two last expression profiles concerned miR-155
(Additional file 4: Figure S2D) and miR-1244 (Additional
file 4: Figure S2E). Although these two miRNAs were significantly up-regulated in ER− breast cancer compared to
normal breast tissue, miR-155 showed also significant increase of its expression in ER+/Normal whereas miR-1244
was not differentially expressed in ER+/Normal, revealing
a specific up-regulation of miR-1244 in ER− (Table 4).
Expression of genes required for miRNAs biogenesis in ER+
and ER− breast tumors
The majority of these 20 miRNAs deregulated in ER+
breast tumors, except miR-155 and miR-1244, were significantly down-regulated in breast cancers compared to
normal breast tissue (Additional file 5: Table S3) so we
explored if genes required for miRNAs biogenesis could
be deregulated. In the validation series, we measured by
RT-qPCR the expression levels of DICER1, DROSHA,
AGO2 and DGCR8, four genes encoding proteins playing
pivotal roles in the processing of mature miRNAs. We
found that these genes were deregulated in ER+ compared to ER− breast tumors: DICER1, DROSHA and
DGCR8 were significantly under-expressed in ER− while
AGO2 was moderate over-expressed in ER−. We did
not however observe significant expression changes in
ER+/Normal for these four genes. On the other hand,
we observed a significant under-expression of DICER1
in ER−/Normal (Table 5). These results revealed a deregulation of genes required for miRNA biogenesis in
the absence of ER.
Expression of host genes of miRNAs in ER+ and ER−
breast tumors
Among the 20 miRNAs identified as deregulated in ER+
compared to ER− breast tumors, 6 miRNAs are located
in intragenic regions: miR-26a1 in CTDSPL, miR-342-5p
in EVL, miR-30e in NFYC, miR-30c2 in OGFRL1, miR26b in CTDSP1 and miR-1244 in PTMA. The expression
levels of these 6 host genes were then measured, by RTqPCR, in the validation series (Table 6). These genes
showed significant expression difference between ER+
and ER−similar to their miRNA (Table 4). Thus
CTDSPL, EVL, NFYC, OGFRL1 and CTDSP1 are more
expressed in ER+ than in ER− like miR-26a1, miR-3425p, miR-30a, miR-30c2 and miR-26b respectively, and
PTMAP2 is less expressed in ER+ than in ER− like miR1244. Moreover Spearman’s rank correlation analysis revealed a significant and positive correlation between expression of all host genes and its resident miRNA in breast
tumors : miR-26a1 and CDTSPL (r = 0.3157, p < 0.0001),
miR-342-5p and EVL (r = 0.5931, p < 0.0001), miR-30e and
NFYC (r = 0.3157, p < 0.0001), miR-30c2 and OGFRL1
(r = .02803, p = 0.0004), miR-26b and CDTSP1 (r = 0.2502,
p = 0.0018) and miR-1244 and PTMA (r = 0.2258, p = 0.005),
indicating a miRNA-host co-transcription. According to ER
status, a significant correlation was observed for miR-3425p/EVL in ER+ (r = 0.3817, p = 0.0004) and for miR-26b/
CTDSP1 and miR-1244/PTMAP2 in ER− (r = 0.3584, p =
0.0029 and r = 0.2822, p = 0.0197, respectively) (data not
shown).
miRNA expression in human breast cancer cell lines
We further evaluated the expression levels of 20 miRNAs
identified as deregulated in ER+ compared to ER− breast
tumors in 30 human breast cancer cell lines including 19
ER− and 11 ER+. The patterns of expression changes observed between ER+ and ER− breast tumors do not have
been validated in breast cancer cell lines for all miRNAs
(Table 7). We only confirmed the significant over-
Table 5 Expression levels of 4 genes required for miRNA biogenesis in breast tissues
ER+/ER−
Breast tissue
ER−/Normal
ER+/Normal
Gene
Normal (n = 8)
ER+ (n = 85)
ER− (n = 68)
FC
p-value
FC
p-value
FC
p-value
DICER1
1.0
0.92
0.50
1.85
<0.0001
−1.09
ns
−2.00
0.0004
(0.79-1.36)
(0.05-3.18)
(0.10-1.94)
1.65
<0.0001
1.27
ns
−1.30
0.0486
1.46
<0.0001
1.05
ns
−1.39
0.0506
−1.37
0.0433
−1.25
ns
1.10
ns
DROSHA
DGCR8
AGO2
1.0
1.27
0.77
(0.77-1.56)
(0.08-4.91)
(0.09-6.37)
1.0
1.05
0.72
(0.78-1.56)
(0.19-4.77)
(0.13-3.44)
1.0
0.80
1.10
(0.56-1.10)
(0.17-3.74)
(0.08-4.74)
Results in ER+ and ER− breast tumors are expressed as the median (range) of level relative to normal breast tissues. For each comparison, we report the fold-change (FC)
and the p-value associated to Mann-Whitney’s test (ns for not significant)
Cizeron-Clairac et al. BMC Cancer (2015) 15:499
Page 9 of 14
Table 6 Expression levels of host genes containing miRNAs deregulated in ER+ compared to ER− breast tumors in the validation
series
ER+/ER−
Breast tissue
−
miRNA
Host gene
Normal (n = 8)
ER (n = 85)
ER (n = 68)
FC
p-value
miR-26a1
CTDSPL
1.0
0.95
0.42
2.26
<0.0001
(0.49-2.20)
(0.21-19.6)
(0.03-7.64)
miR-342-5p
EVL
1.0
3.36
0.54
6.17
<0.0001
(0.89-1.42)
(0.16-26.9)
(0.08-2.77)
miR-30e
NFYC
1.0
1.00
0.90
1.11
0.0143
(0.85-1.42)
(0.06-2.91)
(0.45-2.46)
miR-30c2
OGFRL1
1.0
0.67
0.44
1.51
0.0002
(0.69-1.29)
(0.03-2.20)
(0.08-2.04)
miR-26b
CTDSP1
1.0
0.93
0.67
1.39
<0.0001
(0.66-1.56)
(0.20-3.85)
(0.25-3.11)
miR-1244
PTMAP2
1.0
1.41
1.89
−1.34
0.0002
(0.53-2.04)
(0.00-6.10)
(0.85-12.4)
+
Results in ER+ and ER− breast tumors are expressed as the median (range) of level relative to normal breast tissues. For each comparison, we report the fold-change (FC)
and the p-value associated to Mann-Whitney’s test (ns for not significant)
Table 7 Relative miRNA expression levels of 20 miRNAs in breast cancer cell lines. Results in breast cancer cell lines are expressed as
the median (range) of miRNA level relative to ER- breast cancer cell lines
Official Name
ER− breast cancer cell lines (n = 19)
+
ER+ breast cancer cell lines (n = 11)
FC
p-value
−
12 miRNAs up-regulated in ER compared to ER breast tumors
miR-190b
1.0 (0.18-3.14)
42.9 (1.73-631)
42.99
<0.0001
miR-26a1
1.0 (0.36-3.22)
3.14 (0.36-7.83)
3.14
0.0477
miR-342-5p
1.0 (0.26-2.72)
8.24 (1.72-17.4)
8.24
<0.0001
miR-101-1
1.0 (0.50-2.54)
2.04 (0.61-6.64)
2.04
0.0111
let-7b
1.0 (0.34-4.92)
1.02 (0.01-5.24)
1.02
ns
miR-30e
1.0 (0.56-3.45)
1.50 (0.68-2.50)
1.50
ns
miR-30c2
1.0 (0.43-2.89)
0.92 (0.36-3.94)
−1.09
ns
miR-143
1.0 (0.37-36.3)
1.22 (0.37-3.84)
1.22
ns
miR-26b
1.0 (0.41-4.89)
3.54 (0.98-7.81)
3.54
0.0006
miR-376c
1.0 (0.11-22.8)
0.92 (0.00-22.1)
−1.09
ns
miR-193b
1.0 (0.26-3.90)
3.45 (0.29-12.0)
3.45
0.0052
let-7a
1.0 (0.50-2.01)
0.87 (0.10-3.61)
−1.15
ns
8 miRNAs down-regulated in ER+ compared to ER− breast tumors
miR-18a
1.0 (0.15-2.39)
0.50 (0.24-25.1)
−2.00
0.0642
miR-654-3p
1.0 (0.13-9.85)
0.46 (0.24-1.93)
−2.17
ns
miR-18b
1.0 (0.17-2.45)
0.64 (0.16-27.5)
−1.56
ns
miR-155
1.0 (0.00-72.2)
0.03 (0.00-0.84)
−33.3
0.0609
miR-1244
1.0 (0.32-1.90)
0.91 (0.43-2.20)
−1.10
ns
miR-203
1.0 (0.01-10.0)
5.62 (0.03-13.3)
5.62
0.0226
miR-92a1
1.0 (0.41-2.46)
0.62 (0.35-4.29)
−1.61
0.0707
miR-146a
1.0 (0.03-91.6)
0.11 (0.03-0.25)
−9.09
0.0583
+
−
The miRNAs are ranked according to the deregulation level between ER and ER breast tumors. For each miRNA, we report the fold-change (FC) between ER+
and ER− breast cancer cell lines and the p-value associated to Mann–Whitney U test (ns for not significant)
Cizeron-Clairac et al. BMC Cancer (2015) 15:499
expression of miR-190b, miR-26a1, miR342-5p, miR-1011, miR-26b and miR-193b in ER+ breast cancer cell lines.
None down-regulation of miRNAs in ER+ compared to
ER- tumors was validated in cell lines; miR-203 was even
significantly up-regulated (p = 0.0226). It is worthy to note
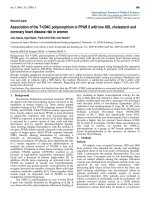
that miR-190b, the highest up-regulated miRNA in ER+
tumors, was also the highest miRNA expressed in ER+
breast cancer cell lines, with a FC of 43 compared to 8 for
the second higher up-regulated miRNA, miR-342-5p
(Table 7), and that this up-regulation was observed in
most of ER+ breast cancer cell lines (Fig. 1) confirming
thus that miR-190b may have an important role in ERdependent tumorigenesis. This is why we decided to focus
next experiments on the expression and function of miR190b.
Confirmation of miR-190b up-regulation in ER+ compared
to ER− breast tumors
The heightened increase of miR-190b expression in ER+
compared to ER− breast tumors identified previously by
Qiagen quantitative RT-PCR was validated by another
experimental technique provided by Applied System
Biotechnologies. Indeed, on 20 breast tumor samples
which showed a FC of 23 between ER+ and ER− with
Qiagen technology, we found a similar increase of miR190b expression levels with Applied technology (FC of
26) (data not shown) and a strong positive correlation of
miR-190b expression between the two techniques
(Spearman’s coefficient correlation of 0.8977 significant
at p < 0.0001).
Prognostic value of miR-190b expression in breast cancer
patients
Using a Kaplan-Meier analysis, we showed that high expression of miR-190b did not impact metastasis-free survival in ER+ and ER- separated subgroups (datas not
shown). If we compared MFS according to the type of
treatment, we observed no prognostic impact related on
Page 10 of 14
miR-190b expression level for patients who received
hormone therapy alone (p = 0.40, datas not shown). All
patients receiving other adjuvant treatment expressed
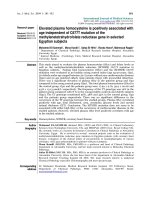
miR-190b at low level. Interestingly high expression of
miR-190b was associated with a prolonged metastasisfree survival independently to ER status and treatment
(log rank test: p = 0.0173, HR = 1.869, 95 % CI = 1.12 to
3.13) (Fig. 2A), as well as a prolonged event-free survival (log rank test: p = 0.0046, HR = 2.048, 95 % CI =
1.248 to 3.360) (Fig. 2B). This result prompted us to explore functions of miR-190b in breast carcinogenesis.
Effect of estrogen on miR-190b expression
To identify if estrogen could explain the deregulation of
miR-190b between ER+ and ER− breast tumors, we measured its expression levels on the ERα-positive MCF-7
and T-47D breast cancer cell lines treated with 17βestradiol (E2). We did not observe an increase of miR190b expression levels in MCF-7 or in T-47D treated by
E2 whereas the expression of the well-known ERαinduced gene pS2 was highly increased in the two cell
lines (Additional files 6: Figure S3A and S3B). Others 19
miRNAs did not respond to 17β-estradiol either (datas
not shown). Obviously we neither observed effect of
tamoxifen treatment on miR-190b expression in MCF-7
cell lines (datas not shown).
Role of miR-190b expression in tumor proliferation
The heightened increase of miR-190b in ER+ breast cancer prompted us to explore this possible biological significance in cell proliferation. As initial step, the capacity
of proliferation induction was evaluated on breast cancer
cell lines ER+ MCF-7 and T-47D that were transfected
with an antagomir against miR-190b and on ER− MDMBA-231 that was transfected with a miR-190b mimic.
The efficacy of transfection was verified by quantifying
miR-190b in RNA extracted from transfected cells by
qRT-PCR (datas not shown). Antagomir did not affect
Fig. 1 Expression levels of miR-190b in breast cancer cell lines. Representation of miR-190b relative expression level in 30 breast cancer cell lines.
For each cell line, the miRNA levels were normalized such that the median value of the ER− breast cancer cell lines was 1 (horizontal line)
Cizeron-Clairac et al. BMC Cancer (2015) 15:499
Page 11 of 14
Fig. 2 Metastasis-free survival (a) and event-free survival (b) according to miR-190b expression level in breast tumors for the total cohort.
Kaplan-Meier survival analysis stratified by the miR-190b expression level. The p value was determined using the log rank test
proliferation of MCF-7 (Additional file 7: Figure S4A)
and T-47D cell lines (Additional file 7: Figure S4B) as
miR-190b mimic has no effect on MDA-MB-231 proliferation (Additional file 7: Figure S4C). Other experiments are therefore needed to decipher the role of miR190b in mammary tumorigenesis.
Discussion
From the study of more than 800 miRNA in ER+ en ER−
breast tumors and confirmation of our results in a large
validation series, we identified a robust collection of 20
miRNAs significantly deregulated in ER+ compared to
ER− breast cancers: 12 up-regulated and eight downregulated miRNAs. Among these 20 miRNAs, we found
ten miRNAs similarly deregulated in ER+ and ER−, independently to their ER status: let-7a, let-7b, miR-26a1,
miR-101-1, miR-30c2, miR-143, miR-26b, miR-376c and
miR-92a1 which were down-regulated in both ER+/Normal and in ER−/Normal and miR-155 which was upregulated in both ER+/Normal and in ER−/Normal.
Moreover we found six miRNAs only deregulated in ER
+
/Normal or in ER−/Normal (miR-30e, specifically down-
regulated in ER−, miR-342-5p, specifically up-regulated
in ER+, miR-18a, miR-18b and miR-654-3p, specifically
down-regulated in ER+ and miR-1244, specifically upregulated in ER−) and 3 miRNAs, not particularly attractive since not deregulated in ER+/Normal nor in
ER−/Normal (miR-193b, miR-203 and miR-146a). In
contrast we found a very interesting miRNA, miR190b, which was not only the strongly up-regulated in
ER+ compared to ER− (FC of 23.30) but also the only
miRNA for which deregulation was different in breast
cancer according to ER status.
Production and maturation of miRNAs require a set of
proteins collectively known as the miRNA biogenesis
machinery and it is now established that alterations in
this machinery can generate changes in miRNA expression and contribute thus in the development and progression of cancer. We fully support the same view since
we found that several key miRNA processing genes are
differentially expressed between ER+ and ER− breast cancer, which may explain the different regulatory effects of
miRNAs in these two breast cancer subtypes. Indeed
DROSHA, DGCR8 and DICER1 were significantly down-
Cizeron-Clairac et al. BMC Cancer (2015) 15:499
regulated in ER− whereas AGO2 was moderate upregulated. These results support previous observations
[16, 20, 32–34] and strengthen the pertinence of alterations of the basic miRNA biogenesis machinery in
breast cancer.
For all six miRNAs located in intragenic regions, we
demonstrated a significant and positive correlation between expression of host gene and its resident
miRNA, in particular the well-known co-regulation of
the ER+ marker miR-342 and the ER-regulated gene
EVL [16, 35, 36]. However, in the study of Dvinge, results suggested a limited miRNA-host co-transcription
concerning only 49 out 227 same-strand intragenic
miRNAs [17].
These 20 miRNAs have been already described in early
studies identifying miRNAs implicated in breast cancers
[7, 9, 15, 17] but miR-190b retained our attention because it was the only miRNA strongly up-regulated in
ER+ compared to ER− breast tumors with a FC of 23
much higher than all other up-regulated miRNAs. This
observation remained true also in breast cancer cell lines
with a FC of 43 for miR-190b. Moreover miR-190b was
strongly up-regulated in ER+ breast tumors compared to
normal breast cancer and especially the only miRNA for
which deregulation was different according to ER status. Indeed MiR-190b was significantly up-regulated in
ER+/Normal and down-regulated in ER−/Normal suggesting a different deregulation of miR-190b depending
on the ER status. We could note that we did not select
miR-135b because of absence of expression in our
screening series whereas this microRNA would be differentially expressed in ER+ and ER− breast tumors, and
is described by Aakula et al. as a regulator of ER [37]
Few studies reported miR-190b implication in cancers.
A recent next generation sequencing project identified
mir-190b among seven others microRNAs as a biomarker for the diagnosis of Merkel cell carcinoma [38].
In lung cancer, miR-190b could be detected easily in
serum of patients to facilitate diagnosis [39]. MicroRNA
expression profile associated with response to neoadjuvant chemoradiotherapy in locally advanced rectal cancer patients included miR-190b [40]. However none of
these studies explored mechanism of action of miR-190b
and its targets did not have been well described contrary
to miR-190 that could interfere with VEGF-mediated
angiogenesis [41]. Morevover miR-190b has not been selected by previous microarray breast cancer studies [16,
17, 19, 42] so we tried to decipher its properties in
breast cancer. By treating MCF7 and T47D cell lines
with estradiol, we demonstrated that miR-190b is not
directly regulated by this hormone whereas it seems particularly deregulated in ER+ breast tumors. We could
speculate that expression of miR-190b is controlled by
other mechanisms like ER-signaling pathways independent
Page 12 of 14
of estrogen but it remains to be demonstrated [43, 44].
Transfection experiments with anti-miR-190b in MCF7
and T47D cell lines, or with mimic of miR-190b in MDAMB-231 cell line have shown that miR-190b has probably
no effect on cell proliferation. Nevertheless, if the mechanisms of its expression regulation like its exact role in
oncogenesis of ER+ breast cancers are elucidated, miR190b could become a very interesting biomarker in ER+
breast cancers as it has the advantage to be highly
expressed in this subtype and therefore easy to detect by
RT-qPCR. We could speculate that miR-190b would be
used as a circulating biomarker for minimal residual disease follow-up in hormone-dependent breast cancers to
detect therapeutic resistance and early relapses.
Last but not least, a high expression of miR-190b was
associated with a prolonged MFS and EFS in breast tumors, independently to ER status. To date miR-190b just
appears in one study using global microRNA expression
profiling to identify markers of recurrence in ER+ patients receiving tamoxifen [45]. Ten highly significant
miRNAs including miR-190b could discriminate the patient samples according to outcome but this result was
not confirmed in two validation cohorts. More interesting, miR-190b and its function have been explored in a
very recent study in human hepatocellular carcinoma
[46]. The authors have showed that up-regulation of
miR-190b could play a role for decreased IGF-1 that induce insulin resistance in hepatocellular carcinoma.
IGF-1 appears to be a direct target of miR-190b and another study have demonstrated that IGF-1 and ER expressions are raised in breast cancer cases which were
likely to develop tamoxifen resistance [47]. Taking into
account our present work and these two recent studies,
we argued that the link between miR-190b and tamoxifen resistance could be very interesting to study in breast
cancers.
Conclusion
This study identified miR-190b as the highest upregulated miRNA in ER+ breast cancers compared to
ER− tumors and to normal breast tissues. Surprisingly,
expression of miR-190b is not directly regulated by estradiol. Using synthetic miRNA to mimic or to
antagonize miR-190b, we demonstrated that miR-190b
does not affect the proliferation of transfected breast
cancer cell lines. However miR-190b affects MFS of
breast cancer patients. Even if miR-190b exact role in
breast carcinogenesis and regulation expression mechanisms remain to elucidate, this microRNA seems to be
specifically expressed in ER+ breast cancers at higher
level that all others miRNAs and could therefore represent a new biomarker of interest for the follow-up of
this subtype of tumors.
Cizeron-Clairac et al. BMC Cancer (2015) 15:499
Additional files
Additional file 1: Table S1. Relative mRNA expression level of 804
miRNAs studied in normal, ER+ and ER- breast tissues. For each miRNA,
we give the number of samples analyzed (Nb), the median and the range
(min and max) of mRNA level relative to normal breast tissue samples,
the median of cycle threshold (Ct) obtained by RT-qPCR, the fold
change (FC) between ER+ and ER- tumors and the p-value associated to
Mann-Whitney's test (ns for not significant when p-value >0,05). The
miRNAs are alphabetically ranked.
Additional file 2: Table S2. Relative mRNA expression level of 333
informative miRNAs in normal, ER+ and ER- breast tissues. For each
miRNA, we give the number of samples analyzed (Nb), the median and
the range (min and max) of mRNA level relative to normal breast tissue
samples, the median of cycle threshold (Ct) obtained by RT-qPCR, the fold
change (FC) between ER+ and ER- tumors and the p-value associated to
Mann-Whitney's test (ns for not significant when p-value > 0,05). All miRNAs
indicated with an asterisk following their name, all miRNAs with a median
of values of cycle threshold (Ct) obtained by RT-qPCR upper to 30 in the
three groups and all miRNAS with a Ct upper to 30 in at least 60 % of
samples were filtrered. The miRNAs are alphabetically ranked.
Additional file 3: Figure S1. Expression profiles of 12 miRNAs significantly
up-regulated in ER+ compared to ER− breast tumors. Five expression profiles
were identified: miR-26a1 expression representative of let-7b, miR-101-1,
miR-30c2, miR-143, miR-26b, miR-376c and let-7a1 in A, miR-30e expression
in B, miR-193b expression in C, miR-342-5p expression in D and miR-190b
expression in E. For each time, the mRNA levels were normalized such that
the median value of normal cells was of 1 (mean ± SEM, n = 3). Only the
p values analyzing the differences in miRNA expression between ER+ and
normal breast tissue and between ER− and normal breast tissue by the
Mann-Whitney’s test are given.
Additional file 4: Figure S2. Expression profiles of 8 miRNAs significantly
down-regulated in ER+ compared to ER− breast tumors. Five expression
profiles were identified: miR-654-3p expression representative of miR-18b
and miR-18a expression in A, miR-146a expression representative of miR-203
in B, miR-92a1 expression in C, miR-155 expression in D and miR-1244
expression in E. For each time, the mRNA levels were normalized such that
the median value of normal cells was of 1 (mean ± SEM, n = 3). Only the
p values obtained by the Mann-Whitney’s test analyzing the differences in
miRNA expression between ER+ and normal breast tissue and between
ER- and normal breast tissue are given.
Additional file 5: Table S3. Relative miRNA expression levels of the 30
selected miRNAs in breast cancer. Results in breast tumors are expressed
as the median (range) of miRNA level relative to normal breast tissues.
For each miRNA, we report the fold-change (FC) between breast tumors
and normal breast tissue and the p-value associated to Mann–Whitney
test (ns for not significant). These 30 miRNAs are ranked according their
expression level in ER+ compared to ER- breast tumors (Table 3).
Additional file 6: Figure S3. Effects of estradiol on expression levels of
miR-190b and pS2 in MCF-7 (A) and T-47D (B). Cell lines were treated with
estradiol (E2) or vehicle during the indicated time and mRNA levels were
measured by RQ-PCR normalized to RNU44 (mean ± SEM, n = 3). For each
time, the mRNA levels were normalized such that the median value of
control cells was of one (horizontal line).
Additional file 7: Figure S4. MiR-190b does not interfere with proliferation
in MCF7, T47D and MDA-Mb-231 cell lines. MCF7 (A) and T-47D (B) cell lines
were transfected with antagomir against miR-190b whereas MDA-MB-231 cell
line (C) was transfected with miR-190b mimic. Cytotoxicity was evaluated by
MTT colorimetric test at indicated times (mean ± SEM, n = 3).
Abbreviations
Ct: Cycle threshold; EFS: Event free survival; ER: Estrogen receptor; FC: Fold
change; MFS: Metastasis free survival; RT-qPCR: Reverse transcriptase
quantitative polymerase chain reaction; RT-PCR: Reverse transcriptase
polymerase chain reaction.
Competing interest
The authors declare that they have no competing interest.
Page 13 of 14
Authors’ contributions
Conception and design: CC, IB, GCC and RL. Development of methodology:
GCC, SV and FL. Acquisition of data: SV and FL. Analysis and interpretation
of data: IB, CC and GCC. Writing and review of the manuscript: GCC, CC
and IB. Administrative, technical, or material support: CC, GCC and IB. Study
supervision: CC and IB. All authors have read and approved the final
version of this manuscript.
Acknowledgments
We thank the staff of Curie Institute - René Huguenin Hospital for their
assistance in specimen collection and patient care.
Received: 14 October 2014 Accepted: 19 June 2015
References
1. Jordan VC. A century of deciphering the control mechanisms of sex steroid
action in breast and prostate cancer: the origins of targeted therapy and
chemoprevention. Cancer Res. 2009;69(4):1243–54.
2. Giacinti L, Claudio PP, Lopez M, Giordano A. Epigenetic information and
estrogen receptor alpha expression in breast cancer. Oncologist. 2006;11(1):1–8.
3. Herynk MH, Fuqua SA. Estrogen receptor mutations in human disease.
Endocr Rev. 2004;25(6):869–98.
4. Holst F, Stahl PR, Ruiz C, Hellwinkel O, Jehan Z, Wendland M, et al. Estrogen
receptor alpha (ESR1) gene amplification is frequent in breast cancer. Nat
Genet. 2007;39(5):655–60.
5. Toy W, Shen Y, Won H, Green B, Sakr RA, Will M, et al. ESR1 ligand-binding
domain mutations in hormone-resistant breast cancer. Nat Genet.
2013;45(12):1439–45.
6. Di Leva G, Garofalo M, Croce CM. MicroRNAs in cancer. Annu Rev Pathol.
2014;9:287–314.
7. Zhang W, Liu J, Wang G. The role of microRNAs in human breast cancer
progression. Tumour Biol. 2014;35(7):6235–44.
8. Shah NR, Chen H. MicroRNAs in pathogenesis of breast cancer: Implications
in diagnosis and treatment. World J Clin Oncol. 2014;5(2):48–60.
9. Le Quesne J, Caldas C. Micro-RNAs and breast cancer. Mol Oncol.
2010;4(3):230–41.
10. Esquela-Kerscher A, Slack FJ. Oncomirs - microRNAs with a role in cancer.
Nat Rev Cancer. 2006;6(4):259–69.
11. Yahya SM, Elsayed GH. A summary for molecular regulations of miRNAs in
breast cancer. Clin Biochem. 2015;48(6):388–96.
12. Graveel CR, Calderone HM, Westerhuis JJ, Winn ME, Sempere LF. Critical
analysis of the potential for microRNA biomarkers in breast cancer
management. Breast Cancer (Dove Med Press). 2015;7:59–79.
13. Christodoulatos GS, Dalamaga M. Micro-RNAs as clinical biomarkers and
therapeutic targets in breast cancer: Quo vadis? World J Clin Oncol.
2014;5(2):71–81.
14. Serpico D, Molino L, Di Cosimo S. microRNAs in breast cancer development
and treatment. Cancer Treat Rev. 2014;40(5):595–604.
15. Kaboli PJ, Rahmat A, Ismail P, Ling KH. MicroRNA-based therapy and breast
cancer: a comprehensive review of novel therapeutic strategies from
diagnosis to treatment. Pharmacol Res. 2015.
16. Blenkiron C, Goldstein LD, Thorne NP, Spiteri I, Chin SF, Dunning MJ, et al.
MicroRNA expression profiling of human breast cancer identifies new
markers of tumor subtype. Genome Biol. 2007;8(10):R214.
17. Dvinge H, Git A, Graf S, Salmon-Divon M, Curtis C, Sottoriva A, et al. The
shaping and functional consequences of the microRNA landscape in breast
cancer. Nature. 2013;497(7449):378–82.
18. Li D, Xia H, Li ZY, Hua L, Li L. Identification of Novel Breast Cancer SubtypeSpecific Biomarkers by Integrating Genomics Analysis of DNA Copy Number
Aberrations and miRNA-mRNA Dual Expression Profiling. Biomed Res Int.
2015;2015:746970.
19. Iorio MV, Ferracin M, Liu CG, Veronese A, Spizzo R, Sabbioni S, et al.
MicroRNA gene expression deregulation in human breast cancer. Cancer
Res. 2005;65(16):7065–70.
20. Cheng C, Fu X, Alves P, Gerstein M. mRNA expression profiles show
differential regulatory effects of microRNAs between estrogen receptorpositive and estrogen receptor-negative breast cancer. Genome Biol.
2009;10(9):R90.
Cizeron-Clairac et al. BMC Cancer (2015) 15:499
21. Finak G, Sadekova S, Pepin F, Hallett M, Meterissian S, Halwani F, et al. Gene
expression signatures of morphologically normal breast tissue identify
basal-like tumors. Breast Cancer Res. 2006;8(5):R58.
22. Bhat-Nakshatri P, Wang G, Collins NR, Thomson MJ, Geistlinger TR, Carroll JS,
et al. Estradiol-regulated microRNAs control estradiol response in breast
cancer cells. Nucleic Acids Res. 2009;37(14):4850–61.
23. Zhao Y, Deng C, Wang J, Xiao J, Gatalica Z, Recker RR, et al. Let-7 family
miRNAs regulate estrogen receptor alpha signaling in estrogen receptor
positive breast cancer. Breast Cancer Res Treat. 2011;127(1):69–80.
24. Leivonen SK, Makela R, Ostling P, Kohonen P, Haapa-Paananen S, Kleivi K,
et al. Protein lysate microarray analysis to identify microRNAs regulating
estrogen receptor signaling in breast cancer cell lines. Oncogene.
2009;28(44):3926–36.
25. Wickramasinghe NS, Manavalan TT, Dougherty SM, Riggs KA, Li Y, Klinge
CM. Estradiol downregulates miR-21 expression and increases miR-21 target
gene expression in MCF-7 breast cancer cells. Nucleic Acids Res.
2009;37(8):2584–95.
26. Xiong J, Yu D, Wei N, Fu H, Cai T, Huang Y, et al. An estrogen receptor
alpha suppressor, microRNA-22, is downregulated in estrogen receptor
alpha-positive human breast cancer cell lines and clinical samples. FEBS J.
2010;277(7):1684–94.
27. Jiang S, Zhang HW, Lu MH, He XH, Li Y, Gu H, et al. MicroRNA-155 functions
as an OncomiR in breast cancer by targeting the suppressor of cytokine
signaling 1 gene. Cancer Res. 2010;70(8):3119–27.
28. Lu Z, Ye Y, Jiao D, Qiao J, Cui S, Liu Z. miR-155 and miR-31 are differentially
expressed in breast cancer patients and are correlated with the estrogen
receptor and progesterone receptor status. Oncol Lett. 2012;4(5):1027–32.
29. Kondo N, Toyama T, Sugiura H, Fujii Y, Yamashita H. miR-206 Expression is
down-regulated in estrogen receptor alpha-positive human breast cancer.
Cancer Res. 2008;68(13):5004–8.
30. Di Leva G, Gasparini P, Piovan C, Ngankeu A, Garofalo M, Taccioli C, et al.
MicroRNA cluster 221–222 and estrogen receptor alpha interactions in
breast cancer. J Natl Cancer Inst. 2010;102(10):706–21.
31. Castellano L, Giamas G, Jacob J, Coombes RC, Lucchesi W, Thiruchelvam P,
et al. The estrogen receptor-alpha-induced microRNA signature regulates
itself and its transcriptional response. Proc Natl Acad Sci U S A.
2009;106(37):15732–7.
32. Grelier G, Voirin N, Ay AS, Cox DG, Chabaud S, Treilleux I, et al. Prognostic
value of Dicer expression in human breast cancers and association with the
mesenchymal phenotype. Br J Cancer. 2009;101(4):673–83.
33. Dedes KJ, Natrajan R, Lambros MB, Geyer FC, Lopez-Garcia MA, Savage K,
et al. Down-regulation of the miRNA master regulators Drosha and Dicer is
associated with specific subgroups of breast cancer. Eur J Cancer.
2011;47(1):138–50.
34. Kwon SY, Lee JH, Kim B, Park JW, Kwon TK, Kang SH, et al. Complexity in
regulation of microRNA machinery components in invasive breast
carcinoma. Pathol Oncol Res. 2014;20(3):697–705.
35. Luqmani YA, Al Azmi A, Al Bader M, Abraham G, El Zawahri M. Modification
of gene expression induced by siRNA targeting of estrogen receptor alpha
in MCF7 human breast cancer cells. Int J Oncol. 2009;34(1):231–42.
36. Enerly E, Steinfeld I, Kleivi K, Leivonen SK, Aure MR, Russnes HG, et al.
miRNA-mRNA integrated analysis reveals roles for miRNAs in primary breast
tumors. PLoS One. 2011;6(2):e16915.
37. Aakula A, Leivonen SK, Hintsanen P, Aittokallio T, Ceder Y, Borresen-Dale AL
et al. MicroRNA-135b regulates ERalpha, AR and HIF1AN and affects breast
and prostate cancer cell growth. Mol Oncol. 2015.
38. Ning MS, Kim AS, Prasad N, Levy SE, Zhang H, Andl T. Characterization of
the Merkel Cell Carcinoma miRNome. J Skin Cancer. 2014;2014:289548.
39. Patnaik SK, Yendamuri S, Kannisto E, Kucharczuk JC, Singhal S, Vachani A.
MicroRNA expression profiles of whole blood in lung adenocarcinoma.
PLoS One. 2012;7(9):e46045.
40. Svoboda M, Sana J, Fabian P, Kocakova I, Gombosova J, Nekvindova J, et al.
MicroRNA expression profile associated with response to neoadjuvant
chemoradiotherapy in locally advanced rectal cancer patients. Radiat Oncol.
2012;7:195.
41. Hao Y, Yang J, Yin S, Zhang H, Fan Y, Sun C, et al. The synergistic regulation
of VEGF-mediated angiogenesis through miR-190 and target genes. RNA.
2014;20(8):1328–36.
42. Mattie MD, Benz CC, Bowers J, Sensinger K, Wong L, Scott GK, et al.
Optimized high-throughput microRNA expression profiling provides novel
Page 14 of 14
43.
44.
45.
46.
47.
biomarker assessment of clinical prostate and breast cancer biopsies. Mol
Cancer. 2006;5:24.
Ding L, Yan J, Zhu J, Zhong H, Lu Q, Wang Z, et al. Ligand-independent
activation of estrogen receptor alpha by XBP-1. Nucleic Acids Res.
2003;31(18):5266–74.
Zwijsen RM, Buckle RS, Hijmans EM, Loomans CJ, Bernards R. Ligandindependent recruitment of steroid receptor coactivators to estrogen
receptor by cyclin D1. Genes Dev. 1998;12(22):3488–98.
Lyng MB, Laenkholm AV, Sokilde R, Gravgaard KH, Litman T, Ditzel HJ.
Global microRNA expression profiling of high-risk ER+ breast cancers from
patients receiving adjuvant tamoxifen mono-therapy: a DBCG study. PLoS
One. 2012;7(5):e36170.
Hung TM, Ho CM, Liu YC, Lee JL, Liao YR, Wu YM, et al. Up-regulation of
microRNA-190b plays a role for decreased IGF-1 that induces insulin
resistance in human hepatocellular carcinoma. PLoS One. 2014;9(2):e89446.
Chong K, Subramanian A, Sharma A, Mokbel K. Measuring IGF-1, ER-alpha
and EGFR expression can predict tamoxifen-resistance in ER-positive breast
cancer. Anticancer Res. 2011;31(1):23–32.
Submit your next manuscript to BioMed Central
and take full advantage of:
• Convenient online submission
• Thorough peer review
• No space constraints or color figure charges
• Immediate publication on acceptance
• Inclusion in PubMed, CAS, Scopus and Google Scholar
• Research which is freely available for redistribution
Submit your manuscript at
www.biomedcentral.com/submit