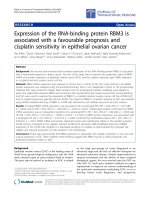
Inflammation-regulating factors in ascites as predictive biomarkers of drug resistance and progression-free survival in serous epithelial ovarian cancers
Bạn đang xem bản rút gọn của tài liệu. Xem và tải ngay bản đầy đủ của tài liệu tại đây (1.12 MB, 11 trang )
Lane et al. BMC Cancer (2015) 15:492
DOI 10.1186/s12885-015-1511-7
RESEARCH ARTICLE
Open Access
Inflammation-regulating factors in ascites
as predictive biomarkers of drug resistance
and progression-free survival in serous
epithelial ovarian cancers
Denis Lane1, Isabelle Matte1, Perrine Garde-Granger2, Claude Laplante2, Alex Carignan1, Claudine Rancourt1
and Alain Piché1*
Abstract
Background: Platinum-based combination therapy is the standard first-line treatment for women with advanced
serous epithelial ovarian carcinoma (EOC). However, about 20 % will not respond and are considered clinically
resistant. The availability of biomarkers to predict responses to the initial therapy would provide a practical approach to
identify women who would benefit from a more appropriate first-line treatment. Ascites is an attractive inflammatory
fluid for biomarker discovery as it is easy and minimally invasive to obtain. The aim of this study was to evaluate
whether six selected inflammation-regulating factors in ascites could serve as diagnostic or drug resistance biomarkers
in patients with advanced serous EOC.
Methods: A total of 53 women with stage III/IV serous EOC and 10 women with benign conditions were enrolled
in this study. Eleven of the 53 women with serous EOC were considered clinically resistant to treatment with
progression-free survival < 6 months. Ascites were collected at the time of the debulking surgery and the levels
of cytokines were measured by ELISA. The six selected cytokines were evaluated for their ability to discriminate
serous EOC from benign controls, and to discriminate platinum resistant from platinum sensitive patients.
Results: Median ascites levels of IL-6, IL-10 and osteoprotegerin (OPG) were significantly higher in women with
advanced serous EOC than in controls (P ≤ 0.012). There were no significant difference in the median ascites
levels of leptin, soluble urokinase plasminogen activator receptor (suPAR) and CCL18 among serous EOC women
and controls. In Receiver Operator curve (ROC) analysis, IL-6, IL-10 and OPG had a high area under the curve value
of 0.905, 0.832 and 0.825 respectively for distinguishing EOC from benign controls. ROC analysis of individual
cytokines revealed low discriminating potential to stratify patients according to their sensitivity to first-line
treatment. The combination of biomarkers with the highest discriminating potential was with CA125 and leptin
(AUC = 0.936, 95 % CI: 0.894–0.978).
Conclusion: IL-6 was found to be strongly associated with advanced serous EOC and could be used in
combination with serum CA125 to discriminate benign and EOC. Furthermore, the combination of serum CA125
and ascites leptin was a strong predictor of clinical resistance to first-line therapy.
Keywords: Ascites, Ovarian cancer, Tumor microenvironment, Cytokines, Inflammation, Drug resistance
* Correspondence:
1
Département de Microbiologie et Infectiologie, Faculté de Médecine,
Université de Sherbrooke, 3001, 12ième Avenue Nord, J1H 5 N4 Sherbrooke,
Canada
Full list of author information is available at the end of the article
© 2015 Lane et al. This is an Open Access article distributed under the terms of the Creative Commons Attribution License
( which permits unrestricted use, distribution, and reproduction in any medium,
provided the original work is properly credited. The Creative Commons Public Domain Dedication waiver (http://
creativecommons.org/publicdomain/zero/1.0/) applies to the data made available in this article, unless otherwise stated.
Lane et al. BMC Cancer (2015) 15:492
Background
Epithelial ovarian cancer (EOC) is the leading cause of
gynecological cancer-related death [1, 2]. Serous carcinomas are the most frequent subtype encountered in patients with EOC [3]. Being largely asymptomatic, over
70 % of patients are diagnosed at an advanced stage of
the disease (stage III/IV) with metastasis throughout the
peritoneal cavity and large amount of ascites [1, 3, 4].
Platinum-based combination chemotherapy is the standard
first-line treatement for advanced stage EOC. Although
overall initial response rates to first-line platinum based
chemotherapy are good, 15–20 % of patients will not
respond to the initial chemotherapy [5]. The tumors
are considered resistant if the patient do not respond
to platinum-based therapy or show progression during
the course of therapy, or if the clinical progression-free
survival (PFS) is less than 6 months [6]. These patients
are considered to have intrinsic resistance to first-line
treatment. There is currently no available biomarker
to identify these patients at baseline. Unfortunately,
these patients are identified retrospectively after they
experienced early relapse or did not respond to initial
treatment. Thus, customised treatments and clinical
stratification of these EOC patient remain critical objectives in the field. The identification of new biomarkers
for intrinsic drug resistance would represent a substantial step forward in our efforts to adequately treat EOC
and increase survival.
The only clinically validated biomarker for disease
monitoring and assessing response and relapse to treatment is CA125 which is encoded by MUC16 mucin gene
[7–12]. The N-terminal extracellular region of MUC16
is cleaved and released into the serum of patients with
EOC [9]. Serum CA125 lacks specificity and sensitivity,
as a single marker, for early EOC detection and prognosis [13]. Recent studies suggest that a Risk of Ovarian
Malignancy Algorithm (ROMA) incorporating CA125
and HE4 levels in serum shows a high potential for discriminating ovarian cancer from benign gynecological
diseases [14–16]. HE4 is the only biomarker, other than
CA125, that has been approved as a diagnostic marker
for ovarian cancer [17].
Tumor-promoting inflammation is now established as
a hallmark of cancer [18, 19]. Serum cytokine levels have
been investigated as diagnostic and prognostic markers
in ovarian cancer. Ascites from women with advanced
serous EOC is an inflammatory milieu rich in inflammation promoting factors. An inflammatory environment
such as ascites promotes drug resistance of EOC cells
[20–23]. High levels of pro-inflammatory cytokines, chemokines and growth factors are found in OC ascites
[23–29]. A recent multiplex profiling of cytokines in the
ascites of 10 EOC patients has demonstrated enhanced
expression of several inflammation-regulating factors
Page 2 of 11
including IL-6, IL-6R, IL-8, IL-10, leptin, osteoprotegerin
(OPG) and urokinase plasminogen activator (uPAR)
among others [30]. Specific inflammatory cytokines in
ascites such as IL-6 were shown to be an independent
prognostic factor of worse outcome [31]. IL-6 contributes
to EOC progression by inhibition of apoptosis, stimulation
of angiogenesis, increased migration and invasion, and
stimulation of cell proliferation [32–35].
Ascites is an attractive biofluid for biomarker discovery
as it is easy and minimally invasive to obtain. Proximal
fluids such as ascites – as opposed to serum – might
reflect events in ovarian tumorigenesis earlier than in
peripheral blood circulation [36]. Furthermore, the
concentration of cytokines is usually much higher in
ascites compared to serum [29]. Thus, the accessibility
of ascites – a simple non-invasive puncture - provides
an excellent source of inflammation promoting factors
(with potential enrichment relative to serum) for the
investigation of prognostic biomarkers.
Ascites from a small subset of serous EOC patients
and patients with benign gynecological conditions has
been previously analyzed with a panel of 120 cytokines
by cytokine array [30]. This analysis has revealed 20 cytokines/growth factors, which showed a statistically significant (P < 0.01) > 2-fold up-regulation relative to
benign fluids. For this study, six inflammatory-regulating
factors including IL-6, IL-10, leptin, osteoprotegerin
(OPG), soluble urokinase plasminogen activator receptor
(suPAR) and CCL18 were initially selected based on the
following biological rationales: 1) IL-6, IL-10, leptin,
OPG, suPAR and CCL18 are present at high levels in
EOC ascites [29, 30]; 2) high ascites levels of IL-6, IL-10,
leptin and OPG have been associated with EOC worse
outcome [30]; 3) their concentrations in ascites are well
within the range required to induce a biological effect
[29, 30]; 4) IL-6, IL10, leptin, suPAR and OPG can inhibit drug-induced apoptosis in vitro in EOC cells or
other cancer cells [34, 37–46].
In the present study, we have measured the baseline
levels of six inflammation-regulating factors including
IL-6, IL-10, leptin, OPG, suPAR and CCL18 in prospectively collected ascites patients with advanced serous
EOC with complete clinicopathologic data and adequate
follow up. The aims of the study was to establish (1)
whether levels of these cytokines differ between benign
and serous EOC, (2) whether levels can distinct patients
with intrinsic drug resistance to those that respond to
first-line platinum-based treatment.
Methods
Patients
Ascites is routinely obtained at the time of the debulking
surgery of ovarian cancer patients treated at the Centre
Hospitalier Universitaire de Sherbrooke. After collection,
Lane et al. BMC Cancer (2015) 15:492
Page 3 of 11
cell-free ascites are stored at - 80 °C in our tumor bank
until use. The study population consisted of 53 women
with newly diagnosed epithelial ovarian cancer admitted
at the Centre Hospitalier Universitaire de Sherbrooke.
Ten cases with benign conditions, namely histologically
benign gynecological conditions including fibromas (5),
mucinous and serous cystadenomas (4), and one inflammatory lesion, constituted the control group. This study
was approved by the Institutional Review Board of the
Centre de Recherche Étienne-Le Bel. Informed consent
was obtained from women that underwent surgery by
the gynecologic oncology service between 2000 and
2013. All samples were reviewed by an experienced
pathologist. Baseline characteristics and serum CA125
levels were collected for all patients. All patients had a
follow up ≥ 12 months. Disease progression was defined
by either serum CA125 ≥ 2 X nadir value on two occasions, documentation of lesion progression or appearance of new lesions on CT-scan or death [37]. Patient’s
conditions were staged according to the criteria of the
International Federation of Gynecology and Obstetrics
(FIGO). PFS was defined by the time from the initial
surgery to evidence of disease progression. Drug resistance was defined as those with PFS < 6 months or lack
of response to initial platinum-based chemotherapy. Patient characteristics are summarised in Table 2.
Peritoneal fluid specimens
Peritoneal fluids and ascites were obtained at the time of
initial cytoreductive surgery for all patients. Peritoneal
fluids were centrifuged at 1000 rpm for 15 min and cellfree supernatants were stored at−80 °C until assayed. All
acellular fluids were supplied by the Banque de tissus et
de données of the Réseau de Recherche en Cancer of the
Fonds de la Recherche du Québec en Santé affiliated to
the Canadian Tumor Repository Network (CTRNet).
ELISA measurements
Cytokine levels in peritoneal fluid samples were determined by ELISA using the commercially available human
Quantikine kits from R&D Systems (Minneapolis, MN).
OPG levels were determined using an ELISA from E
Bioscience (Vienna, Austria). The assays were performed
in duplicate according to the manufacturer’s protocols.
The detection thresholds were 0.79 pg/ml for IL-6, 2.9 pg/
ml for IL-10, 7.8 pg/ml for leptin, 4.5 pg/ml for OPG,
33 pg/ml for suPAR and 1.1 ng/ml for CCL18. The intraassay variability was 5–10 % for IL-6, 2.5–6.6 % for IL-10,
3–3.2 % for leptin, 4.3–7.9 % for OPG, 2.1–7.5 % for
suPAR and 3.2–3.7 % for CCL18. The inter-assay variability varied from 3.5 to 7.6 % depending on the cytokine. All
samples were examined in duplicate and the median
values were used for statistical analysis.
CA125 measurements
CA125 was determined at Centre Hospitalier Universitaire
de Sherbrooke laboratory in serum samples by EIA using
the Elecsys 2010 analyzer and CA125 II regents (Roche
Diagnostics, Québec, Canada). The reference range was
0–35 kUI/L.
Statistical analysis
Comparison between unpaired groups was made using
the Mann–Whitney test or the Kruskal-Wallis test.
Statistical differences in PFS were determined by the
log-rank test, and Kaplan-Meier survival curves were
made. PFS was defined as the interval between the date
of the initial debulking surgery and the time of disease
progression or the last date of follow up. Receiveroperator curves (ROC) were created to determine the
predictive value of the cytokines to distinguish between
EOC patients and control, and between clinically resistant and sensitive patients. The threshold for statistical
significance is P < 0.05.
Results
Predictive value of ascites inflammation-regulating factors
for EOC versus control group
Expression levels of IL-6, IL-10, leptin, OPG, suPAR and
CCL18 in ascites were measured by ELISA. These
inflammation-regulating factors were measured in a cohort
of 53 patients with advanced (stage III/IV) serous EOC
Table 1 Ascites levels of the selected inflammatory cytokines
Cytokines
Benign controls median, pg/ml
Serous EOC median, pg/ml
Fold change (FC) relative to benign
P value
IL-6
15 (6–65)
1820 (279–4327)
121
<0.001
IL-10
10 (0–45)
97,5 (23–186)
9.8
<0.001
Leptin
254 (152–917)
453 (177–1956)
1.8
NS
suPAR
272 (89–15,944)
7021 (1170–15,538)
28.8
NS
CCL18
15,000 (2000–27,000)
20,000 (3000–39,000)
1.3
NS
OPG
18 (2–166)
296 (23–865)
16,4
0.012
Values in brackets indicate 25–75 quartiles
NS not statistically significant
P value = Student T test
Lane et al. BMC Cancer (2015) 15:492
Fig. 1 (See legend on next page.)
Page 4 of 11
Lane et al. BMC Cancer (2015) 15:492
Page 5 of 11
(See figure on previous page.)
Fig. 1 Ascites levels of inflammation-regulating factors in serous EOC patients and those with benign conditions. Box plots representing ascites levels
of IL-6 (a), IL-10 (b), leptin (c), suPAR (d), CCL18 (e) and OPG (f) in patients with advanced serous EOC and patients with benign gynecological
conditions. (g) Box plot of serum CA125 levels in serous EOC patients and patients with benign gynecological diseases. The P value is
indicated for each factor. ROC analysis using leptin, suPAR and CCL18 (h), and IL-6, IL-10 and OPG (i) for distinguishing patients with serous
EOC from control patients. (j) ROC analysis of serum CA125 for distinguishing serous EOC from control patients
from ascites that were obtained at the time of their debulking surgery. Median IL-6 ascites levels were 121-fold, IL-10
levels 9.8-fold and OPG levels 16.4-fold higher in serous
EOC samples compared to benign controls (Table 1, Fig. 1a,
b and f). In contrast, median CCL18 and leptin ascites
levels were not statistically different in serous EOC compared to benign controls (Table 1, Fig. 1c and e). Although,
median levels of suPAR were almost 29-fold higher in serous EOC patients, the difference was not statistically significant (P = 0.68) (Table 1, Fig. 1d). IL-6 and IL-10 levels
were undetectable in 6 % of serous EOC and in 10 % and
40 % of the benign controls respectively. Serum CA125
levels were measured and the median level was 23-fold
higher in serous EOC sample compared to control with a
P < 0.001 (Fig. 1g). The expression of IL-6 in the ascites of
serous EOC patients did not show a strong correlation
with those of IL-10 (correlation coefficient, R < 0.1). We
also observed a lack of significant correlation between the
expression of IL-6 and those of leptin, suPAR and CCL18
with R < 0.1.
ROC analyses were performed to determine the predictive value of ascites factors distinguishing EOC patients from the control group. Ascites levels of IL-6
allowed most accurate discrimination (AUC = 0.905,
95 % CI: 0.850–0.960) between EOC patients and benign
controls although it did not outperformed serum CA125
(AUC = 0.951, 95 % CI: 0.906–0.996) (Fig. 1i and j). IL10 and OPG also discriminated serous EOC patients
from benign controls with AUC = 0.832 (95 % CI: 0.763–
0.901) and AUC = 0.825 (95 % CI: 0.782–0.868 respectively (Fig. 1j). The other inflammation-regulating factors
tested had lower discriminating potential with AUC for
suPAR = 0.757 (95 % CI: 0.632–0.882), for leptin = 0.586
(95 % CI: 0.488–0.684) and for CCL18 = 0.612 (95 % CI:
0.538–0.686) (Fig. 1h). The results did not reach statistical significance for suPAR, leptin and CCL18. Thus,
ascites levels of IL-6 in this study proved to be the most
reliable cytokine biomarker for discriminating EOC serous patients from the control group. At a cutoff value
of 75 pg/ml for IL-6, the sensitivity was 92 % and the
specificity was 80 %. Combining CA125 and IL-6 further improved specificity. In patients with serum levels
above the cutoff point of CA125 > 35 kUI/L, a cutoff
point of IL-6 > 45 pg/ml gave a specificity of 100 % for
distinguishing between EOC and control group (Fig. 2).
Discriminating potential of ascites inflammation-regulating
factors to identify women with intrinsic drug resistance
Inflammation has been associated with tumor progression and drug resistance [18, 19]. Serous EOC ascites
has been previously shown to inhibit drug-induced
apoptosis [20–23]. Inflammation-regulating factors may
enhance cisplatin resistance [32–35, 42, 44, 46]. ROC
were created to determine the predictive value of ascites
IL-6, IL-10, leptin, OPG, suPAR and CCL18 for discriminating, at baseline, clinically resistant patients from
those that are sensitive. The clinical and pathological
characteristics of the patients in our cohort are shown in
Table 2. Of the 53 patients, 42 were drug sensitive and
11 were drug resistant. The median age at diagnosis was
60 years (range, 27 to 85 years), and all patients had advanced-stage (FIGO stages III/IV) with serous histology.
Most (≥79 %) of patients were optimally cytoreduced after
initial surgery, and about 30 % received pre-operative
chemotherapy. There was no significant difference between
the two groups. All patients had a follow-up ≥ 12 months
Fig. 2 Serum CA125 and ascites IL-6 levels can discriminate between patients with serous EOC or benign gynecological conditions. The markers
with cutoff (pg/ml for IL-6 and kUI/L for CA125) are depicted together with the percentage of the patients with EOC or benign conditions that
were predicted by the combination of markers
T2
Lane et al. BMC Cancer (2015) 15:492
Page 6 of 11
Table 2 Patient characteristics
Characteristic
Drug sensitive
patients
Drug resistant
patients
n = 53
(n = 42)
(n = 11)
Median
61,5
62
Range
31–81
27–89
Age (years)
NS
FIGO stage
NS
I–II
0 (0)
0 (0)
III–IV
42 (100)
11 (100)
1
4 (10.5)
0 (0)
2
8 (21)
2 (18)
3
19 (50)
8 (73)
ND
0 (0)
1 (9)
Grade
NS
Histologic
subtype
Serous
P value
NS
42 (100)
11 (100)
Debulking status
NS
<2 cm
33 (79)
9 (82)
>2 cm
5 (12)
2 (18)
ND
4 (10)
0 (0)
Prior
chemotherapy
NS
Yes
9 (21)
4 (36)
No
33 (79)
7 (64)
CA125 at
diagnosis
NS
Median
626
1145
Range
20–6549
88–14,180
FIGO international federation of gynecology and obstetrics, NS not statistically
significant, ND not determined
(range, 12 to 108 months). Clinically sensitive patients have
a median PFS of 13.9 months and clinically resistant patients a median PFS of 4 months.
Median ascites levels of IL-6 and IL-10, and serum
levels of CA125, were not statistically different between
patients that had drug sensitive or drug resistant diseases (Fig. 3a-c). Similarly, median levels of leptin,
suPAR and CCL18 were not significantly different (data
not shown). In contrast, ascites OPG levels were significantly higher in chemosensitive patients compared to resistant patients (Fig. 3d). ROC analysis for individual
cytokines revealed low discriminating potential to stratify patients according to their sensitivity to first-line
treatment (Additional file 1: Figure S1). To improve the
accuracy, we assessed combinations of the studied cytokines and CA125 in ROC analysis. The combination of
biomarkers with the highest discriminating potential was
with CA125 and leptin (AUC = 0.936, 95 % CI: 0.894–
0.978) (Fig. 2d). All other combination, including CA125
with suPAR (Fig. 3d) and CA125 with IL-6 (Fig. 3e), had
low discriminating potential with AUC < 0.650.
Inflammation-regulating factor levels as prognostic
marker in serous EOC
We assessed the prognostic value of IL-6, IL-10, leptin,
OPG, suPAR and CCL18 in relation with PFS in the cohort of 53 patients. A cutoff value corresponding to the
median of each factor was used to separate patients into
two groups: those with high ascites levels versus those
with low ascites levels. Kaplan-Meier curves of the six
factors are shown in Fig. 4. Among the six inflammationregulating factors, only IL-6 was significantly associated
with a worse outcome. Patients with low ascites IL-6 levels
had a median PFS of 12 months compared to patients
with high levels who had a PFS of 28 months (P = 0.0004,
log rank test).
Discussion
We selected for this study patients with advanced serous
EOC to ensure a homogenous group of patients and because this subtype is the most frequently encountered
subtype in clinic. In this context, the conclusions of this
study may not apply to other ovarian cancer sub-types
or to patients presenting with FIGO stage I/II diseases.
However, this study has the advantage of comprising a
homogeneous group of women with advanced serous
EOC, thus limiting potential bias associated with inclusion of various sub-types with distinct genetic backgrounds. In our study, ascites levels of IL-6, IL-10 and
OPG were found to be elevated in patients with advanced stage serous EOC compared with patients with
benign gynecological conditions. Moreover, determination of IL-6 levels could classify 68 % of the advanced
stage serous EOC patients accurately, without falsely
classifying patients with benign gynecological conditions.
These findings are in line with previous studies demonstrating higher levels of IL-6, IL-10 and OPG in malignant ascites or serum compared to patients with benign
conditions [29, 47, 48]. In a recent study, IL-6 levels in
ascites were the most discriminating to distinguish EOC
patients from patients with benign conditions among
ten selected factors [49]. Without surprise, serum
CA125 levels were found to be the most discriminating
factor for advanced stage serous EOC patients. Indeed,
CA125 was elevated (>35 kUI/L) in 100 % of EOC patients and in 30 % of patients with benign conditions in
this study. Others found CA125 commonly elevated in
serous EOC patients but it has not always consistently
discriminated between malignant and benign pelvic mass
[50]. Serum CA125 may be elevated in a variety of other
benign conditions [17, 50]. Therefore, CA125 alone lacks
specificity. Our data suggest that ascites IL-6 might be a
Lane et al. BMC Cancer (2015) 15:492
Fig. 3 (See legend on next page.)
Page 7 of 11
Lane et al. BMC Cancer (2015) 15:492
Page 8 of 11
(See figure on previous page.)
Fig. 3 Ascites levels of inflammation-regulating factors in clinically resistant patients and those sensitive to first-line treatment. Box plots representing
ascites levels of IL-6 (a), IL-10 (b), suPAR (c), serum CA125 (d), OPG (e), CCL18 (f) and leptin (g) in patients with resistance to first-line therapy and
patients with sensitive diseases. The P value is indicated for each factor. ROC analysis using the combination of CA125/leptin and CA125/suPAR
(h) and CA125/IL-6 (i) for distinguishing patients with resistant or sensitive EOC
good addition to serum CA125 for diagnosis of serous
EOC versus benign conditions. In our study, a cutoff
point of CA125 > 35 kUI/L and a cutoff point of IL-6 >
45 pg/ml gave a sensitivity of 92 % and a specificity of
100 % for distinguishing between EOC and control
group. One limitation of this study is that data were derived from a small number of samples, thus conclusions
should be viewed appropriately. Further studies however
are needed to evaluate the additional value of ascites IL-6
in combination with serum CA125 to discriminate advanced stage serous EOC patients and patients with
benign gynecological conditions. Indeed, because of its
retrospective nature, a confirmation of our results in a
larger cohort is necessary.
IL-6 production generates an inflammatory environment that promotes metastatic growth. In this context,
there is a number of studies that linked serum or ascites
IL-6 levels with a worse prognosis and poor overall survival in EOC patients [31, 51, 52]. In line with these
studies, our data demonstrate that higher IL-6 levels
were significantly associated with shorter PFS. In addition,
IL-6 has been associated, in some context, with cisplatin
resistance in vitro through upregulation of anti-apoptotic
proteins, such as Bcl-2 and IAPs, and downregulation
of pro-apoptotic proteins, such as BID and BAX [34, 53].
In this study however, we did not observed a correlation
between IL-6 levels in ascites and clinical resistance to
cisplatin. Furthermore, using IL-6 concentrations (500
to 5000 pg/ml) at levels similar to those found in ascites, we have found no effect on cisplatin-induced cell
death in EOC cell lines (data not shown). IL-6 does
however promotes cell migration and invasion in vitro
Fig. 4 Kaplan-Meier curves of ascites IL-6, IL-10, OPG, leptin, suPAR and CCL18. The median levels of each factor were taken as cutoff points. The
P value is indicated for each factor
Lane et al. BMC Cancer (2015) 15:492
as such may contribute to metastatic growth and worse
prognosis.
The second goal of the study was to determine if a single inflammation-regulating factor, or a combination of
factors, could be used as a predictive value to discriminate clinically resistant versus sensitive patients. This is
critical because the prognosis of women with EOC is
strongly associated with the length of PFS after first-line
therapy [54]. The availability of biomarkers to predict responses to the initial therapy would provide a practical
approach to identify women who would benefit from a
more appropriate first-line treatment. Because ascites is
a proinflammatory milieu rich in cytokines, chemokines
and growth factors, and because ascites may enhance resistance to various drugs, it constitutes an excellent reservoir for the identification of drug resistance biomarkers.
There is a large effort in the field of EOC to identify new
diagnostic and prognostic biomarkers, in particular for
clinically resistant patients [55–57]. Huang et al. have performed proteomic studies of ovarian cancer ascites using
gel electrophoresis coupled with matrix-assisted laser desorption/ionization time-of-flight mass spectrometry, and
compared chemoresistant and chemosensitive patients
[55]. They found that ceruloplasmin levels, an acute phase
protein, was significantly higher in chemoresistant than in
chemosensitive ascites. Such acute phase protein levels are
often modulated by chemotherapy treatments [58]. Therefore, ceruloplasmin may act not as a causal protein but as
a marker of systemic inflammation. In ROC analysis,
the combination of CA125 and leptin had the highest
discriminating potential (AUC 0.936) to distinguish
clinically resistant patients to first-line therapy from
sensitive patients presenting with advanced serous EOC.
Interestingly, CA125 expression has been associated
with resistance to cisplatin and death receptor ligand in
ovarian and breast cancer cell lines [59–61]. It was suggested that CA125 affects tumor cells by altering the expression of pro- and anti-apoptotic proteins [59, 61].
Leptin has been shown to activate PI3K/Akt and ERK1/
2 survival pathways and stimulate the expression of antiapoptotic protein Mcl-1 in ovarian cancer cell line
OVCAR3 [62]. Furthermore, serous EOC ascites was
found to activate PI3K/Akt and ERK1/2 pathways and
stimulate the expression of Mcl-1 in ovarian cancer cells
[20, 22]. These signaling alterations were associated with
increased resistance to death receptor-induced apoptosis.
Altogether, these data provide a biological rationale for
the findings that the combination of CA125 and leptin
discriminate between sensitive and resistant patients.
Conclusions
In conclusion, ascites IL-6 was found to be strongly related to serous EOC and may be used in combination
with CA125 for diagnosis of advanced serous EOC. This
Page 9 of 11
finding however requires further validation. Serum CA125
in combination with leptin has the potential to discriminate clinically resistant from sensitive patients at baseline
and could therefore be used to stratify patients at baseline
that are more likely to benefit from standard first-line
treatment among patients presenting with advanced
serous EOC. The potential role of CA125 and leptin
needs to be further explored.
Additional file
Additional file 1: Figure S1. Receiver operator curve (ROC) analysis by
using single inflammation-regulating factor to differentiate patients resistant
to first-line treatment (PFS < 6 months) from those that are clinically
sensitive to first-line treatment (PFS > 6 months).
Competing interest
The authors declare that they have no competing interests.
Authors’ contributions
DL participated in the design of the study and performed the assays for
measuring IL-6, IL-10, OPG, leptin, suPAR and CCL18 levels in ascites. IM
was responsible for obtaining the ascites and the clinical data. She also
performed the cytokine chip arrays experiments. AC performed the survival
analyses. Pathological specimens were reviewed by PGG or CL. CR participated
in the design of the study and helped to draft the manuscript. AP conceived
the study, participated in its design and drafted the manuscript. All authors read
and approved the final manuscript.
Acknowledgments
This work was supported by a grant from the Canadian Institutes of Health
Research (A.P.), by the Centre d’excellence en Inflammation-Cancer de
l’Université de Sherbrooke and by the “Programme d’aide de financement
interne” of the Centre de Recherche du Centre Hospitalier Universitaire de
Sherbrooke. We wish to thank the Banque de tissus et de données du Réseau
de Recherche en Cancer du Fond de Recherche du Québec en Santé (FRQS),
affiliated to the Canadian Tumor Repository Network (CTRNet) for providing the
ascites samples.
Author details
1
Département de Microbiologie et Infectiologie, Faculté de Médecine,
Université de Sherbrooke, 3001, 12ième Avenue Nord, J1H 5 N4 Sherbrooke,
Canada. 2Département de Pathologie, Faculté de Médecine, Université de
Sherbrooke, 3001, 12ième Avenue Nord, J1H 5 N4 Sherbrooke, Canada.
Received: 16 March 2015 Accepted: 19 June 2015
References
1. Partridge EE, Barnes MN. Epithelial ovarian cancer: prevention, diagnosis,
and treatment. CA Cancer J Clin. 1999;49:297–320.
2. Jemal A, Siegel R, Xu J, Ward E. Cancer Statistics 2010. CA Cancer J Clin.
2010;60:277–300.
3. Bast RC, Hennessy B, Mills GB. The biology of ovarian cancer: new
opportunities for translation. Nat Rev Cancer. 2009;9:415–28.
4. Ozols RF, Bookman MA, Connolly DC, Daly MB, Godwin AK, Schilder RJ,
et al. Focus on epithelial ovarian cancer. Cancer Cell. 2004;5:19–24.
5. Cannistra SA. Cancer of the ovary. N Engl J Med. 2004;351:2519–29.
6. Chien J, Kuang R, Landen C, Shridhar V. Platinum-sensitive recurrence in
ovarian cancer: the role of the tumor environment. Front Oncol. 2013;3:251.
7. Yin BW, Lloyd KO. Molecular cloning of the CA125 ovarian cancer antigen:
identification as a new mucin (Muc16). J Biol Chem. 2001;276:27371–5.
8. Yin BW, Dnistrian A, Lloyd KO. Ovarian cancer antigen CA125 is encoded by
the MUC16 mucin gene. Int J Cancer. 2002;98:737–40.
9. O’Brien TJ, Beard JB, Underwood LJ, Shigemasa K. The CA125 gene: a newly
discovered extension of the glycosylated N-terminal domain doubles the
size of this extracellular superstructure. Tumour Biol. 2002;23:154–69.
Lane et al. BMC Cancer (2015) 15:492
10. Canney PA, Moore M, Wilkinson PM, James RD. Ovarian cancer antigen
CA125: a prospective clinical assessment of its role as a tumour marker.
Br J Cancer. 1984;50:765–9.
11. Vergote IB, Bormer OP, Abeler VM. Evaluation of serum CA 125 levels in the
monitoring of ovarian cancer. Am J Obstet Gynecol. 1987;157:88–92.
12. Bast Jr RC, Klug TL, St-John E, Jenison E, Niloff JM, Lazarus H, et al. A
radioimmunoassay using a monoclonal antibody to monitor the course
of epithelial ovarian cancer. N Engl J Med. 1983;309:883–7.
13. Rancourt C, Matte I, Lane D, Piché A. The role of MUC16 mucin (CA125) in
the pathogenesis of ovarian cancer. Chapter 4 in Ovarian Cancer: Basic
science perspective. INTECH open access publisher: Janeza Trdine 9, 51000
Rijeka, Croatia; 2012.
14. Moore RG, Miller MC, DiSilvestro P, Landrum LM, Gajewski W, Ball JJ, et al.
Evaluation of the diagnostic accuracy of the risk of ovarian malignancy
algorithm in women with pelvic mass. Obstet Gynecol. 2011;118:280–8.
15. Moore RG, McMeekin DS, Brown AK, DiSilvestro P, Miller MC, Allard WJ, et al.
A novel multiple marker bioassay utilizing HE4 and CA125 for the prediction
of ovarian cancer in patients with pelvic mass. Gynecol Oncol. 2009;112:40–6.
16. Molina R, Escudero JM, Augé JM, Filella X, Foj L, Torné A, et al. HE4 a novel
tumour marker for ovarian cancer: comparison with CA125 and ROMA
algorithm in patients with genaecological diseases. Tumor Biol. 2011;32:1087–95.
17. Felder M, Kapur A, Bosquet JG, Horibata S, Heintz J, Albrecht R, et al. MUC16
(CA125): tumor biomarker to cancer therapy, work in progress. Mol Cancer.
2014;13:129.
18. Hanahan H, Weinberg RA. Hallmarks of cancer: the next generation. Cell.
2011;144:646–74.
19. Mantovani A, Allavena P, Sica A, Balkwill F. Cancer-related inflammation.
Nature. 2008;454:436–44.
20. Lane D, Robert V, Grondin R, Rancourt C, Piché A. Malignant ascites protect
against TRAIL-induced apoptosis by activating the PI3K/Akt in human ovarian
carcinoma cells. Int J Cancer. 2007;121:1227–37.
21. Lane D, Goncharenko-Khaider N, Rancourt C, Piché A. Ovarian cancer ascites
protects from TRAIL-induced cell death through αvβ5 integrin-mediated
focal adhesion kinase and Akt activation. Oncogene. 2010;29:3519–31.
22. Goncharenko-Khaider N, Matte I, Lane D, Rancourt C, Piché A. Ovarian
cancer ascites increase Mcl-1 expression in tumor cells through ERK1/2-Elk-1
signaling to attenuate TRAIL-induced apoptosis. Mol Cancer. 2012;11:84.
23. Lane D, Matte I, Rancourt C, Piché A. The prosurvival activity of ascites
against TRAIL is associated with a shorter disease-free interval in patients
with ovarian cancer. J Ovarian Res. 2010;3:1.
24. Mills GB, May C, McGill M, Roifman CM, Mellors A. A putative new growth
factor in ascitic fluid from ovarian cancer patients: identification,
characterization, and mechanism of action. Cancer Res. 1988;48:1066–71.
25. Mills GB, May C, Hill M, Campbell S, Shaw P, Marks A. Ascitic fluid from
human ovarian cancer patients contains growth factors necessary for
intraperitoneal growth of human ovarian adenocarcinoma cells. J Clin
Invest. 1990;86:851–5.
26. Richardson M, Gunawan J, Hatton MW, Seidlitz E, Hirte HW, Singh G.
Malignant ascites fluids (MAF), including ovarian cancer-associated MAF,
contains angiostatin and other factor(s) which inhibit angiogenesis. Gynecol
Oncol. 2002;86:279–87.
27. Xu Y, Gaudette DC, Boynton JD, Frankel A, Fang XJ, Sharma A, et al.
Characterization of an ovarian cancer activating factor in ascites of ovarian
cancer patients. Clin Cancer Res. 1995;1:1223–32.
28. Yamada T, Sato K, Komachi M, Malchinkhuu E, Tobo M, Kimura T, et al.
Lysophosphatidic acid (LPA) in malignant ascites stimulates motility of
human pancreatic cancer cells through LPA1. J Biol Chem. 2004;279:6595–605.
29. Giuntoli RL, Webb TJ, Zoso A, Rogers O, Diaz-Montes TP, Bristow RE, et al.
Ovarian cancer-associated ascites demonstrates altered immune
environment: implications for antitumor immunity. Anticancer Res.
2009;29:2875–84.
30. Matte I, Lane D, Laplante C, Rancourt C, Piché A. Profiling of cytokines in
human epithelial ovarian cancer ascites. Am J Cancer Res. 2012;2:566–80.
31. Lane D, Matte I, Piché A. Prognostic significance of IL-6 and IL-8 ascites
levels in ovarian cancer patients. BMC Cancer. 2011;11:210.
32. Shahzad MM, Arevalo JM, Armaiz-Pena GN, Lu C, Stone RL, Moreno-Smith
M, et al. Stress effects on FosB- and interleukin-8 (IL8)-driven ovarian cancer
growth and metastasis. J Biol Chem. 2010;285:35462–70.
33. Johnson MT, Gotlieb WH, Rabbi M, Martinez-Maza O, Berek JS. Induction of
cisplatin resistance and metallothionein expression by interleukin-6. Gynecol
Oncol. 1993;49:110.
Page 10 of 11
34. Cohen S, Bruuchim I, Graiver D, Evron Z, Oron-Karni V, Pasmanik-Chor M,
et al. Platinum-resistance in ovarian cancer cells is mediated by IL-6
secretion via the increased expression of its target cIAP-2. J Mol Med.
2013;91:357–68.
35. Coward JI, Kulbe H. The role of interleukin-6 in gynaecological malignancies.
Cytokine Growth Factor Rev. 2012;23:333–42.
36. Hanash SM, Pitteri S, Faca VM. Mining the plasma proteome for cancer
biomarker. Nature. 2008;452:571–9.
37. Rustin GJ, Timmers P, Nelstrop A, Shreeves G, Bentzen SM, Baron B, et al.
Comparison of CA-125 and standard definitions of progression of ovarian
cancer in the intergroup trial of cisplatin and paclitaxel versus cisplatin and
cyclophosphamide. J Clin Oncol. 2006;24:45–51.
38. Lane D, Matte I, Rancourt C, Piché A. Osteoprotegerin (OPG) protects
ovarian cancer cells from TRAIL-induced apoptosis but does not contribute
to malignant ascites-mediated attenuation of TRAIL-induced apoptosis.
J Ovarian Res. 2012;5:34.
39. Lane D, Matte I, Laplante C, Garde-Granger P, Rancourt C, Piché A.
Osteoprotegerin (OPG) activates integrin, focal adhesion knase (FAK),
and Akt signaling in ovarian cancer cells to attenuate TRAIL-induced
apoptosis. J Ovarian Res. 2013;6:82.
40. Duan Z, Foster R, Bell DA, Mahoney J, Wolak K, Vaidya A, et al. Signal transducers
and activators of transcription 3 pathway activation in drug-resistant ovarian
cancer. Clin Cancer Res. 2006;12:5055–63.
41. Guo Y, Nemeth J, O’Brien C, Susa M, Liu X, Zhang Z, et al. Effects of
siltuximab on the IL-6-induced signaling pathway in ovarian cancer.
Clin Cancer Res. 2010;16:5759–69.
42. Yan HQ, Huang XB, Ke SZ, Jiang YN, Zhang YH, Wang YN, et al. Interleukin-6
augments lung cancer chemotherapeutic resistance via ataxia-telangiectasia
mutated/NF-kappaB pathway activation. Cancer Sci. 2014;105:1220–7.
43. Zeng L, O’Connor C, Zhang J, Kaplan AM, Cohen DA. IL-10 promotes resistance
to apoptosis and metastatic potential in tumor lung tumor cell lines. Cytokine.
2010;49:294–302.
44. Efferth T, Fabry U, Osieka R. Leptin contributes to the protection of human
leukemic cells from cisplatinum cytotoxicity. Anticancer Res. 2000;20:2541–6.
45. Alfano D, Iaccarino I, Stoppelli MP. Urokinase signaling through its receptor
protects against anoikis by increasing Bcl-xL expression levels. J Biol Chem.
2006;281:17758–67.
46. Gutova M, Najbauer J, Gevorgyan A, Metz MZ, Weng Y, Shih CC, et al.
Identification of uPAR-positive chemoresistant cells in small cell lung cancer.
PLoS ONE. 2007;2:e243.
47. Lambeck AJ, Crijns AP, Leffers N, Sluiter WJ, ten Hoor KA, Braid M, et al.
Serum cytokine profiling as a diagnostic and prognostic tool in ovarian
cancer: a potential role for interleukin-7. Clin Cancer Res. 2007;13:2385–91.
48. Mustea A, Konsgen D, Braicu EI, Pirvulescu C, Sun P, Sofroni D, et al.
Expression of IL-10 in patients with ovarian carcinoma. Anticancer Res.
2006;26:1715–8.
49. Chudecka-Glaz AM, Cymbaluk-Ploska AA, Menkiszak JL, Pius-Sadowska E,
Machalinski BB, Sompolska-Rzechula A, et al. Assessment of selected cytokines,
proteins, and growth factors in the peritoneal fluid of patients with ovarian
cancer and benign gynecological conditions. OncoTargets Ther. 2015;8:471–85.
50. Einhorn N, Knapp RC, Bast RC, Zurawski Jr VR. CA125 assay used in
conjunction with CA 15–3 and TAG-72 assays for discrimination between
malignant and non-malignant diseases of the ovary. Acta Oncol.
1989;28:655–7.
51. Scambia G, Testa U, Panici PB, Foti E, Martucci R, Gadducci A, et al.
Prognostic significance of IL-6 serum levels in patients with ovarian cancer.
Br J Cancer. 1995;71:354–64.
52. Plante M, Rubin SC, Wong GY, Federici MG, Finstad CL, Gastl GA. Interleukin-6
level in serum and ascites as a prognostic factor in patients with epithelial
ovarian cancer. Cancer. 1994;73:1882–8.
53. Borsellino N, Belldegrun A, Bonavida B. Endogenous interleukin-6 is a resistance
factor for cis-diamminedichloroplatinum and etoposide-mediated cytotoxicity
of human prostate carcinoma cell lines. Cancer Res. 1995;55:4633–9.
54. Spriggs D. Optimal sequencing in the treatment of recurrent ovarian cancer.
Gynecol Oncol. 2003;90:539–44.
55. Huang H, Li Y, Liu J, Zheng M, Feng Y, Hu K, et al. Screening and
identification of biomarkers in ascites related to intrinsic chemoresistance of
serous epithelial ovarian cancers. PLoS ONE. 2012;7:51256.
56. Han Y, Huang H, Xiao Z, Zhang W, Cao Y, Qu L, et al. Integrated analysis of
gene expression profiles associated with response of platinum/paclitaxel-based
treatment in epithelial ovarian cancer. PLoS ONE. 2012;7:52745.
Lane et al. BMC Cancer (2015) 15:492
Page 11 of 11
57. Bachvarov D, L’Esperance S, Popa I, Bachvarova M, Plante M, Têtu B. Gene
expression patterns of chemoresistant and chemosenstive serous epithelial
ovarian tumors with possible predictive value in response to initial
chemotherapy. Int J Oncol. 2006;29:919–33.
58. Weijl NI, Hopman GD, Wipkink-Bakker A, Lentjes EG, Berger HM, Cleton FJ,
et al. Cisplatin combination chemotherapy induces a fall in plasma antioxidants
of cancer patients. Ann Oncol. 1998;9:1331–7.
59. Lakshmanan I, Ponnusamy MP, Das S, Chakraborty S, Haridas D,
Mukhopadhyay P, et al. MUC16 induced rapid G2/M transition via
interactions with JAK2 for increased proliferation and anti-apoptosis in
breast cancer cells. Oncogene. 2012;31:805–17.
60. Matte I, Lane D, Boivin M, Rancourt C, Piché A. MUC16 mucin (CA125)
attenuates TRAIL-induced apoptosis by decreasing TRAIL receptor R2
expression and increasing c-FLIP expression. BMC Cancer. 2014;14:234.
61. Boivin M, Lane D, Rancourt C, Piché A. CA125 (MUC16) tumor antigen
selectively modulates the sensitivity of ovarian cancer cells to genotoxic
drug-induced apoptosis. Gynecol Oncol. 2009;115:407–13.
62. Chen C, Chang YC, Lan MS, Breslin M. Leptin stimulates ovarian cancer cell
growth and inhibits apoptosis by incresing cyclin D1 and Mcl-1 expression
via the activation of the MEK/ERK1/2 and PI3K/Akt signaling pathways.
Int J Oncol. 2013;42:1113–9.
Submit your next manuscript to BioMed Central
and take full advantage of:
• Convenient online submission
• Thorough peer review
• No space constraints or color figure charges
• Immediate publication on acceptance
• Inclusion in PubMed, CAS, Scopus and Google Scholar
• Research which is freely available for redistribution
Submit your manuscript at
www.biomedcentral.com/submit