SDF-1alpha concentration dependent modulation of RhoA and Rac1 modifies breast cancer and stromal cells interaction
Bạn đang xem bản rút gọn của tài liệu. Xem và tải ngay bản đầy đủ của tài liệu tại đây (4.84 MB, 17 trang )
Pasquier et al. BMC Cancer (2015) 15:569
DOI 10.1186/s12885-015-1556-7
RESEARCH ARTICLE
Open Access
SDF-1alpha concentration dependent
modulation of RhoA and Rac1 modifies
breast cancer and stromal cells interaction
Jennifer Pasquier1,2, Nadine Abu-Kaoud1, Houari Abdesselem3, Aisha Madani3, Jessica Hoarau-Véchot1,
Hamda Al. Thawadi1, Fabien Vidal1, Bettina Couderc4, Gilles Favre5 and Arash Rafii1,2,6,7*
Abstract
Background: The interaction of SDF-1alpha with its receptor CXCR4 plays a role in the occurrence of distant metastasis
in many solid tumors. This interaction increases migration from primary sites as well as homing at distant sites.
Methods: Here we investigated how SDF-1α could modulate both migration and adhesion of cancer cells through the
modulation of RhoGTPases.
Results: We show that different concentrations of SDF-1α modulate the balance of adhesion and migration in cancer
cells. Increased migration was obtained at 50 and 100 ng/ml of SDF-1α; however migration was reduced at 200 ng/ml.
The adhesion between breast cancer cells and BMHC was significantly increased by SDF-1α treatment at 200 ng/ml and
reduced using a blocking monoclonal antibody against CXCR4. We showed that at low SDF-1α concentration, RhoA was
activated and overexpressed, while at high concentration Rac1 was promoting SDF-1α mediating-cell adhesion.
Conclusion: We conclude that SDF-1α concentration modulates migration and adhesion of breast cancer cells, by
controlling expression and activation of RhoGTPases.
Keywords: Breast cancer, Tumor microenvironment, Metastasis, SDF-1alpha, Stromal cells
Background
Development of distant metastasis in breast cancer is responsible for the majority of cancer related deaths [1].
Metastasis happens through highly organized and organ
specific sequential steps [2]. Among chemokines implicated in this cascade; SDF-1α/CXCR4 regulates organ
specific colonization of metastatic tumor cells [3–6].
The stromal cell derived factor 1-α (SDF-1α) or CXCL12 is physiologically expressed by mesenchymal stromal
cells of metastasized breast cancer host organs such as
liver, lungs, lymphatic tissues or bone marrow [7].
CXCR4 is over-expressed in many breast cancer cells
(BCC), promoting cancer cell migration and invasion
[8]. BCC differential chemokine receptor expression is
correlated with their metastatic behavior [9]. CXCR4
* Correspondence:
1
Stem Cell and Microenvironment Laboratory, Weill Cornell Medical College
in Qatar, Education City, Qatar Foundation, Doha, Qatar
2
Department of Genetic Medicine, Weill Cornell Medical College, New York,
NY, USA
Full list of author information is available at the end of the article
expression predicts bone metastasis in breast cancer patients [10]. Two new ligands, the ubiquitin and the
macrophage migration inhibitory factor were recently
discovered to bind CXCR4, however their role in cancer
biology has not been documented as much as SDF-1α
[11–14].
Among many effects, SDF-1α/CXCR4 interaction regulates cancer cell motility and adhesion. [15]. Muller
et al. showed that CXCR4 expression on breast cancers
related to their migratory/metastatic behavior. They also
illustrated that the inhibition of SDF-1α/CXCR4 interaction resulted in reduced metastasis in breast cancer
xenograft models [16]. Concordantly, multiple studies
showed that in different tumor types SDF-1α/CXCR4
interaction resulted in increased metastasis. SDF-1α signaling is involved in cell migratory properties, cell survival, homing and resistance to treatment [5, 17–19].
The mechanism through which SDF-1α can regulate
such different proprieties as migration and adhesion (implicated in homing) is not clearly established.
© 2015 Pasquier et al. This is an Open Access article distributed under the terms of the Creative Commons Attribution License
( which permits unrestricted use, distribution, and reproduction in any medium,
provided the original work is properly credited. The Creative Commons Public Domain Dedication waiver (http://
creativecommons.org/publicdomain/zero/1.0/) applies to the data made available in this article, unless otherwise stated.
Pasquier et al. BMC Cancer (2015) 15:569
It has been shown that CXCR4/SDF-1α interactions
induced increased migration, proliferation and adhesion
of breast cancer cells through different signaling pathways such as calcium mobilization [20], phosphorylation
of src and fak [21], and phosphatidylinositol 3-kinase
[22]. In multiple melanomas, SDF-1α increases homing,
adhesion and invasiveness of cancer through the activation of GTPases of the Ras superfamily, RhoA and Rac1
[23]. Small GTPases play important roles in basic cellular processes such as cell proliferation, invasion, chemotaxis and adhesion [24]. Rho-protein-dependent cell
signaling is important for malignant transformations
[25]. RhoA activation triggers many pathways including
Rho-associated protein kinase (ROCK) responsible for
actin polymerization required for cell locomotion [26].
We have previously illustrated the role of Rho GTPases
modulation in different neoplasic context such as melanoma, breast and ovarian cancers [27–31].
Here, we investigated the effect of different concentrations of SDF-1α in the modulation of cancer cell
migration and adhesion. We studied how the Rho
GTPases mediated SDF-1α effect, by demonstrating
that RhoA and Rac1 were sequentially activated at different concentration of SDF-1α, thus, promoting different metastatic properties through the modulation
of cancer cells phenotype.
Page 2 of 17
tissue samples and cell lines were obtained. The Hotel
Dieu IRB is the ethics committee who approved the bone
marrow samples and reviewed the project. All donors were
healthy donors in a bone marrow graft program and informed consent was given. Written informed consent for
participation in the study was obtained from participants
or, where participants are children, a parent or guardian.
All samples obtained were de-identified.
Tissue micro-array construction and
immunohistochemistry
Immunohistochemistry was performed on 5-μm thick
routinely processed paraffin sections. Using a tissue
microarray instrument (Beecher Instruments, Alphelys™),
we removed representative areas of the tumor from paraffin embedded tissue blocks. The antibodies were incubated for 30 or 60 min and then revealed by a system of
polymers coupled to the peroxidase (EnVision™ kit, Dako
Cytomation, Glostrup, Denmark).
Cell proliferation assay
Cells were plated at 50,000 cells per well in a 6 well plate
in medium without FBS. Cells were then counted with a
hemocytometer for the following six days every two
days. Two wells were counted per conditions. For cocultures, only the green cells (MDA-GFP) were counted.
The experiment was performed in triplicates.
Methods
Cell cultures
Confocal microscopy
Breast cancer cell line MDA-MB231, MCF7, SK-BR-3,
MDA-MB261, Hs578T, T47D was purchased from ATCC
and cultured following ATCC recommendations (ATCC,
Manassas, VA, USA). DMEM high glucose (Hyclone,
Thermo Scientific), 10 % FBS (Hyclone, Thermo Scientific),
1 % Penicillin-Streptomycin-Amphotericyn B solution
(Sigma), 1X Non-Essential Amino-Acid (Hyclone, Thermo
Scientific) and 1 % L-glutamine. MDA-MB231 cell lines
were stably transduced by lentiviral vectors encoding eGFP
(Genethon, Evry). Bone Marrow host cells (BMHCs) are
mesothelial cells extracted from bone marrow aspirates of
donors within a bone marrow transplantation program in
the Hematology Department of Hôtel-Dieu in Paris [32].
The samples were obtained with the approval of an appropriate ethics committee and are in compliance with the
Helsinki Declaration. BMHCs were maintained and expanded in culture using DMEM low glucose (Hyclone,
Thermo Scientific), 30 % FBS (Hyclone, Thermo Scientific),
1 % Penicillin-Streptomycin-Amphotericyn B solution
(Sigma). All cultured cells were incubated as monolayers at
37 °C under a water-saturated 95 % air-5 % CO2 atmosphere and media are renewed every 2–3 days.
Bone marrow samples were obtained from the
Hematology Department of Hôtel-Dieu in Paris. All necessary ethical approval for the collection and use of the
Live-cell microscopy was used to analyze co-culture of
mesothelial and tumor cells. Cells were labeled with
1 mg/ml Alexa FluorW 594 conjugated wheat germ agglutinin (WGA, Invitrogen SARL, Cergy Pontoise,
France) at 5 μg/ml for 10 min at 37 °C in the dark.
WGA is a probe for detecting glycoconjugates, which selectively binds to N-acetylglucosamine and Nacetylneuraminic acid residues of cell membranes. Confocal
microscopy was performed on fixed cells in 3.7 % formaldehyde. Cells were stained with a 50 μg/ml AF647conjugated phalloidin (Sigma) to label actin filaments.
Slides were mounted in a mounting media SlowFade®
Gold Antifade Reagent with DAPI (Invitrogen). Imaging
was performed using a Zeiss confocal Laser Scanning
Microscope 710 (Carl Zeiss). Post-acquisition image analysis was performed with Zeiss LSM Image Browser Version 4.2.0.121 (Carl Zeiss).
Electron microscopy
Co-culture of MDA-MB231 and BMHC were established
for 48 h. Cells were subsequently washed with PBS and
fixed for 45 min in 30 % formaldehyde +5 % glutaraldehyde. Fixed cells were then centrifuged, treated with
50 mM ammonium chlorate, dehydrated and enveloped
in Epoxy resin at low temperature at polymerization
Pasquier et al. BMC Cancer (2015) 15:569
Page 3 of 17
conditions. The micro sections (600–800 Au) were performed and colored with uranyl acetate and lead and visualized on a Philips CM 10 electron microscope as
previously described [33].
Motility assay in agarose gel
Our agarose gel assay was conceived based on the publication of Mousseau et al. [34]. First, we designed two
molds using 15 ml tube lids, one with 3 lids allowing us
to quantify the motility of the cells between a control
wells, and a treated one and one with 5 lids for the competition experiments.
other wells. Due to the short SDF1-α half-life, the
medium was replaced every day [35]. Image capture
and measurements were performed using an AMG
Evos microscope (Fisher Scientific). The number of
migrating cells was evaluated by measuring the distance traveled by the cells. The starting reference
point used was the beginning of the agarose wall.
Wound closure assay
Migration was assessed by wound closure assay as previously described [6]. Cells cultured at confluence in 24well plates were scratched with a small tip along the
ruler. Cells were then cultured for 24 h in starvation
media with or without SDF-1α.
Agarose gel well formation
A 1 % solution of agarose was prepared in medium composed of 50 % phosphate-buffered saline (PBS) and 50 %
DMEM (Gibco®; Invitrogen, Carlsbad, CA, USA) supplemented with 10 % heat-inactivated FBS and 2 mM Lglutamine (Invitrogen). For a 100-mm diameter Petri
dish, 20 mL final agarose solution was needed. Type II
agarose (Sigma-Aldrich) was added to PBS. After agarose
was dissolved in PBS in a microwave oven, the solution
was autoclaved and sterile DMEM was added. The agarose solution was poured into the Petri dish around the
specific molds to give the well shape (Additional file 1:
Figure S1). After 20–30 min of cooling, the gel was humidified with 5 mL DMEM, and the template was removed. Before performing the cell assay, 5 mL FBS-free
DMEM were added to the gel for 1–6 h in order to
stabilize the pH, for saturation of the gel and to prevent
culture medium from diffusing in the gel during the
experiment.
Calcein-AM staining
For the calcein-AM assay, cells were prepared as previously described [36]. Briefly, cells were stained with 0,25
μM of calcein-AM. After 15 min incubation at 37 °C,
cells were washed twice with PBS.
Tube formation assay
A Matrigel-based capillary-genesis assay was performed
on cells to assess their ability to form an organized tubular network as previously described [37]. Cells were
starved for 6 h then 100,000 cells were cultured on
250 μl of Matrigel (BD bioscience). The degree of tube
formation was quantified at different time-points by
measuring the intersection of tubes in five randomly
chosen fields from each well using ImageJ.
Western blot analysis
Chemotaxis assay and measurements during cell migration
Cells were seeded at a density of 80 000 cells per well
in a complete medium with FBS. After 24 h, the
medium was replaced with a starving medium with
FBS. For the 3 wells experiments, the MDA-MB231
were seeded in the middle well, starving medium was
poured as negative control on one side, on the other
side BMHC or SDF-1α concentration tested was used.
For the 5 wells experiments, MDA-MB231 were
seeded on the middle well, one well was poured with
starving medium as negative control and different
concentrations of SDF-1α were added in the three
Western blot were carried out as previously described
[38]. Immunostaining was carried out using a goat
monoclonal antibodies against RhoA (2117), Rock2
(9029), Rac1 (2465), Cdc42 (2466), SDF-1α (3740), integrin (α4-4600; α5-4705; αV-4711; β3-4702; β4-4707;
β5-4708), actin (3200) (1/1000, Cell signaling) and a
secondary polyclonal mouse anti-goat antibody HRP
conjugated (1/2000, cell signaling). Blots were developed using HRP and chemiluminescent peroxidase
substrate (#CPS1120, Sigma). Data were collected
using Geliance CCD camera (Perkin Elmer), and analyzed using ImageJ software (NIH).
Table 1 Primers Sequence used for RT-PCR
Primer
FORWARD
REVERSE
CXCR4
GCCTTATCCTGCCTGGTATTGTC
GCGAAGAAAGCCAGGATGAGGAT
SDF-1
ACTGGGTTTGTGATTGCCTCTGAAG
GGAACCTGAACCCCTGCTGTG
GAPDH
AGCCACATCGCTCAGACAC
GCCCAATACGACCAAATCC
Pasquier et al. BMC Cancer (2015) 15:569
Page 4 of 17
Pulldown assay
Cells were treated as indicated with SDF-1α. Pulldown
assays were performed according to the manufacturer's
A
protocol (Rho activation assay kit 17–294 and Rac1
activation assay kit 17–441, both from Millipore,
Billerica, MA).
B
BMHC
MDA
MCF7
C
E
D
BMHC
BMHCWGA-AF594 MDAGFP
F
G
Ctrl
MDA
MDA + BMHC
3,5
MDA BMHC
1
2
Cell number (x105)
3,0
Media
2,5
Wall
MDA
2,0
1,5
1,0
0,5
1
0,0
0
1
2
3
4
5
6
Migration
Time (Days)
MDA
Wall
BMHC
2
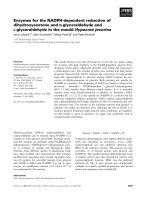
Fig. 1 Intercellular interactions between cancer cells and Bone Marrow Host Cells (BMHC). a Paraffin-embedded immunohistochemistry.
Antibody against CD-10 was used. Picture showed a network of BMHC (brown cells) surrounding cancer cell clusters (blue cells). The insert
picture showed the metastatic node the tissue micro-array. b Electronic microscopy imaging. MDA-MB-231 and BMHC or MCF7 and BMHC
were co-cultured during 48 h and analyzed by electronic microscopy. A pseudopodia of BMHC with two MDA-MB-231 cells were closely
interacting with the pseudopodia (left panel, arrows). Very close interaction between the two cellular membranes of MCF7 and BMHC can
be observed with formation of tight junction (right panel, arrows). c Co-culture of BMHC and MDA-MB231 in phase microscopy. Cancer
cells are growing on BMHC. Scale bar 250 μm. d Confocal imaging of BMHC and eGFP MDA-MB231 co-culture. BMHC were co-cultured with
tumor cells for 3 days. Before imaging by confocal microscopy, co-cultures were stained with Alexa Fluor 594 conjugated-wheat germ
agglutinin (WGA). Z-X reconstitution shows that cancer cells (green) are growing on BMHC. Scale bar 10 μm. e Adhesion assay testing the
specificity of the adhesion between MDA-MB231 cells and BMHC. BMHC were plated up to 60 % confluency, 50,000 eGFP MDA-MB231
were allowed to adhere for 1 h. HBMEC (human bone marrow endothelial cells) or plastic were used as negative control. f Proliferation
assay. MDA-MB231 were plated and counted every 2 days in presence or not of BMHC during 6 days. BMHC were able to increase
proliferation of MDA-MB231. g Migration in agarose gel assay. MDA-MB231 cells were seeded in the central well. Media only was
poured in the left well as negative control and BMHC were seeded in the right well. Cells could be observed during migration through
the agarose gel (black part, wall). The picture represents MDA-MB231 cells migration through the agarose wall to the BMHC well at day 4
(bottom picture, arrows) or to the media only (top picture)
Pasquier et al. BMC Cancer (2015) 15:569
A
BMHC alone
Page 5 of 17
MDA alone
B
Co-culture
SSC
Unstained
Stained
Coculture D5
CXCR4
GFP
D
F
E
80
160
***
SDF1 relative quantification
CXCR4 relative quantification
C
60
40
20
0
**
250
H
150
100
50
*
150
100
0
-
+
-
+
+
-
+
-
Fig. 2 (See legend on next page.)
+
+
-
+
+
-
+
+
80
60
40
20
***
***
50
0
SDF1
SDF1-mAB
BMHC
CXCR4 mAB
250
200
***
100
Control Day 2 Day 5
***
Adherent cancer cells
(% of control)
Adherent MDA cells
(% of control)
200
***
**
120
0
Control Day 2 Day 5
G
***
140
MCF7 T47D MDAMB361
Control
BMHC
BMHC+ SDF1-mAB
Pasquier et al. BMC Cancer (2015) 15:569
Page 6 of 17
(See figure on previous page.)
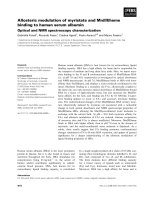
Fig. 2 SDF-1alpha regulates interaction between MDA-MB231 and BMHC. a Flow cytometry cell sorting chart. MDA-MB231 (green) and BMHC
(purple) were gated through GFP fluorescence intensity. b Flow cytometry analysis of CXCR4 expression. After 5 days of co-culture with BMHC,
MDA-MB231 were cell sorted and stained for CXCR4. MDA-MB231 display an increase of the receptor after the co-culture. c-d MDA-MB231 after
co-culture with BMHC. CXCR4 is increased in MDA-MB231 after 2 or 5 days of co-culture with BMHC in western blot (C) or real-time qPCR (D).
Relative transcript levels are represented as the ratios between the 2 subpopulations of their 2–ΔΔCp real-time PCR values. These are data representative
of three different experiments. e-f BMHC after co-culture with MDA-MB231. SDF-1α is increased in BMHC after 2 or 5 days co-culture with MDA-MB231
in western blot (E) or real-time qPCR (F). CXCR4 is increased in MDA-MB231 after 2 or 5 days of co-culture with BMHC (right panel). g Adhesion assay.
BMHC were plated up to 60 % confluency, 50,000 eGFP MDA-MB231 were allowed to adhere for 1 h in presence or not of SDF-1α and a SDF-1α or
CXCR4 monoclonal antibody. Plastic was used as negative control. SDF-1α is involved in MDA-MB231 adhesion. h Adhesion assay. BMHC were plated
up to 60 % confluency, 50,000 MCF7, T47D or MDA-MB361 (stained with Calcein-Am) were allowed to adhere for 1 h in presence or not of SDF-1α
and a SDF-1α monoclonal antibody
RT-PCR analysis
Total RNA was extracted from cells cultures using Trizol.
After genomic DNA removal by DNase digestion (Turbo
DNA free kit, Applied Biosystems), total RNA (1 μg) was
reverse transcribed with oligodT (Promega) using the
Superscript III First-Strand Synthesis SuperMix (Invitrogen). PCR analysis was performed as previously described
[38] with a MasterCycler apparatus (Eppendorf) from 2 μL
of cDNA using primers from IDT (Table 1).
SiRNA treatment
siRNA against human RhoA (Santa Cruz biotechnology)
were introduced into cells by lipid mediated transfection
using siRNA transfection medium, reagent and duplex
(Santa Cruz biotechnology) following manufacturer recommendations. Briefly the day before transfection cells
were platted at 2,5 .105 cells per well in 2 ml antibioticfree normal growth medium supplemented with FBS.
Cells were incubated until they reach 60–80 % confluence. The duplex solution containing the siRNA is then
added to the cells. After 5 to 7 h, antibiotic are added in
each well and the cells are incubated for 24 h more. The
media is then replaced by normal growth media and
cells are used for experiments and assay by RT-PCR to
analyze the expression of RhoA gene.
RNA silencing and generation of lentiviral particles
Stable lentiviral particles expressing small hairpin interfering RNAs (shRNA) targeting human Rac1 mRNA in
MDA-MB231 cells were generated using cDNA lentiviral
shRNA vector (MISSION® shRNA Plasmid DNA, Sigma
Aldrich). The sequence was: 5′-CCGGCCTTCTTAA
CATCACTGTCTTCTCGAGAAGACAGTGATGTTAA
GAAGGTTTTTG-3′. We used a scramble non-sense
RNAi sequence with no homology in the mouse genome
(shScramble) to control the unspecific effects of shRNA
(Sigma Aldrich). In brief, 293 T cells were co-transfected
with shRNA lentiviral plasmid or shScramble lentiviral
plasmid plus the lentiviral packaging and envelope plasmids
(Sigma Aldrich) using lipofectamin2000 and following
manufacturer’s instructions. Medium containing generated
viral particles was collected three days post transfection.
Generated shRac1 lentiviral particles were used to infect
MDA-MB231 cells using 4 μg/ml polybrene in order to
generate stable shRac1 expressing cells. Puromycin selection (2 μg/ml) was used to select the infected cells.
Adhesion assay
adhesion assay Tissue culture plates (96-well) were precoated with bone marrow host cells to reach 70 %
confluency or with nonspecific attachment factors
(Chemicon) following manufacturers’ instructions, or
with human endothelial cells. MDA-MB-231 previously
transfected with eGFP were seeded at 5 *104/well in
200 ml serum-free medium, and allowed to attach for
1 h at 37 °C with BMHC. Non-adherent cells were removed by gentle washing with PBS. The adherent cells
were quantified by quantifying the fluorescence at
560 nm in each well using a Wallac Flite fluorescence
reader. In order to determine the role of the different
GTPases in adhesion to stromal cells we used specific
siRNA transfected MDA-MB-231.
Flow cytometry
Fluorescence (FL) was quantified on a SORP FACSAria2
(BD Biosciences). Data were processed with FACS Diva
6.3 software (BD Biosciences) as previously described
[39, 40].
Statistical analysis
All quantitative data were expressed as mean ± standard
error of the mean (SEM). Statistical analysis was performed with SigmaPlot 11 (Systat Software Inc., Chicago,
IL). A Shapiro-Wilk normality test, with a p = 0.05 rejection value, was used to test normal distribution of data
prior further analysis. All pairwise multiple comparisons
were performed by one way ANOVA followed by HolmSidak posthoc tests for data with normal distribution or
by Kruskal-Wallis analysis of variance on ranks followed
by Tukey posthoc tests, in case of failed normality test.
Paired comparisons were performed by Student’s t-tests
or by Mann–Whitney rank sum tests in case of unequal
Pasquier et al. BMC Cancer (2015) 15:569
A
B
1600
MDA adhesion (eGFP, OD)
Page 7 of 17
***
1400
1200
1000
*
800
600
400
200
0
50
C
100
200
E
Interconnections
X200
Migration distance (µm)
I
N
600
Counting
500
3500
5000
700
Networks
400
300
***
4000
***
3000
***
2000
1000
Migration distance (µm)
0
Control 50
100
F
2500
2000
1500
*
1000
500
0
0
200
***
3000
Control 50
100 200
G0/G1
S
100 200
G2/M
0
0
50
100
200
D
0
Control
72%
16%
50
36%
39%
12 %
70%
SDF1 50
25%
100%
100 200
56 %
27%
17%
100%
Fig. 3 (See legend on next page.)
40%
SDF1 100
SDF1 200
70%
21%
9%
Pasquier et al. BMC Cancer (2015) 15:569
Page 8 of 17
(See figure on previous page.)
Fig. 3 Differential effect of SDF-1alpha on MDA-MB231. a Adhesion assay testing the role of different concentration of SDF-1α. 50,000 eGFP
MDA-MB231 were allowed to adhere for 1 h in presence or absence of SDF-1α (50, 100, 200 ng/ml). The maximum adhesion was observed at
200 ng/ml. b F-actin polymerisation in MDA-MB231. MDA-MB231 were grown on glass bottom slides with different concentration of SDF-1α
(0, 50, 100 or 200 ng/ml) and actin cytosqueletton was revealed by a phalloïdin-fluorescein (1 μg/mL) labelling (red). More stress fiber and filipods
can be seen (arrows) in MDA-MB231 treated with 50 or 100 ng/ml of SDF-1α. Scale bar 20 μm. c MDA-MB231 plasticity on Matrigel. MDA-MB231
were seeded on a 96-wells plate, coated with Matrigel in presence or absence of SDF-1α (50, 100 or 200 ng/ml). Microscopic pictures of cellular
networks after SDF-1α stimulation were taken after 18 h of culture. Quantitative evaluation of the cellular interconnection (white) and network
(black) are presented. The evaluation was made by counting on 10 different fields. The results are expressed as means with standard error.
Interconnection and network number was increased when the cells are treated with 50 or 100 ng/ml of SDF-1α. d Wound closure assay.
Migration ability of MDA-MB231 was tested after a scratch in presence of different concentration of SDF-1α (0, 50, 100 or 200 ng/ml). Only 50
and 100 ng/ml of SDF-1α enhanced MDA-MB231 motility. e Migration in agarose gel assay. MDA-MB231 cells were seeded in the central well.
Media only was poured in the CTRL well as control and different concentration of SDF-1α were used in the right well for the 3 wells experiments
(left panel) or simultaneity in the 5 wells experiments (right panel). Pictures were taken after 8 days and the distance travelled by the cells was
calculated. The histograms present the results of 3 different experiments. f Cell cycle analysis. MDA-MB231 were treated with different concentration of
SDF-1α (0, 50, 100 or 200 ng/ml) for 48 h and position in cell cycle were evaluated with NIM-DAPI by flow cytometry. 50 and 100 ng/ml of SDF-1α
increased the number of cells in phase S (green) and G2/M (purple) and decreased the one in G0/G1 (blue). The results presents in this figure are
representative of three different experiments
variance or failed normality test. Statistical significance
was accepted for p < 0.05 (*), p < 0.01 (**) or p < 0.001
(***). All experiments were performed in triplicates.
Results
Breast cancer cells interact with bone marrow host cells
(BMHC)
Tumor stroma is a composed of multiple cell types;
we have previously described [33] the infiltration of
ovarian cancer tumors by BMHC (CD9+CD10+). Here
using paraffin-embedded immunohistochemistry of
primary breast cancer specimen we found a network
of BMHC (CD9+CD10+) surrounding cancer cell
clusters (Fig. 1a). Electron microscopy analysis of
co-cultures of BMHC and MDA-MB231 or MCF7 displayed close interactions with formation of tight junctions (Fig. 1b). When the two cell types were seeded at
the same time at a ratio of 1/1, breast cancer cells
(BCC) attached preferentially on BMHC compare to
plastic or matrigel as shown on phase contrast and selected (x-z) sections, obtained from confocal microscopy (Fig. 1c-d). Adhesion of BCC and BMHCs was
stronger than spontaneous adhesion to culture plate or to
other cell type HBMEC (Human Bone Marrow Endothelial
Cells) (Fig. 1e). We then investigated the functional benefit
of such interaction. MDA-MB231 co-cultured with BMHC
in serum free cytokine free media displayed a proliferative
advantage compared to controls (Fig. 1f). Finally, in order
to test the ability of BMHC to attract MDA-MB231, we developed an agarose-based migration assay to evaluate the
motility of BCC (Fig. 1g). With this method, BMHC secreted factors rather than the components of extracellular
matrix surrogates (such as Matrigel) would be responsible
for the migration observed. In this set–up MDA-MB231
displayed increased migration toward BMHC compare to
control media.
SDF-1α/CXCR4 regulates adhesion to BMHCs
SDF-1α/CXCR4 interactions regulate chemotaxis and
homing of BCC to the BHMC [16]. To investigate
whether SDF-1α/CXCR4 plays a role in the interaction
between BMHC and MDA-MB231, we performed cell
sorting after 2 and 5 days of co-culture (Fig. 2a) and
showed an increase of CXCR4 in the MDA-MB231
(Fig. 2b-d). Concurrently, an increase of SDF-1α production by BMHC could be observed after co-culture
(Fig. 2e-f ). Western blot and Flow Cytometry analysis
revealed the same profile in 3 other breast cancer cell
lines (MDA-MB361, MCF7 and T47D) and an absence
of expression of CXCR4 or an absence of increase of this
receptor upon co-culture with BMHC in two other one
(Hs578T and SK-BR-3; Additional file 1: Figure S1B-C).
The specific adhesion between MDA-MB231 and
BMHC was significantly reduced with the monoclonal
antibody against SDF-1α or CXCR4 but not significantly
increased by SDF-1α treatment, suggesting that BMHC
secreted SDF-1α already induced optimal adhesion
(Fig. 2g). MDA-MB361, MCF7 and T47D cell lines
showed also an increased adhesion to BMHC, and the
monoclonal antibody against SDF-1α was able to reduce
it (Fig. 2h).
SDF-1α has a concentration dependent effect on
MDA-MB231
We hypothesized that during the migratory process BCC
are exposed to different concentrations of SDF-1α. Muller
et al. established that the optimal migration/invasion of
MDA-MB231 during SDF-1α treatment was obtained at
100 ng/ml with lower migration and invasion at low and
high doses [16]. We selected 3 different concentrations of
SDF-1α, 50, 100 and 200 ng/ml and investigated the dose
dependent response for adhesion, migration, invasion or
proliferation of MDA-MB231 cells.
Pasquier et al. BMC Cancer (2015) 15:569
2.5
2.0
*
1.5
1.0
0.5
0.0
50
100
200
3.0
***
2.5
2.0
1.5
1.0
0.5
0.0
0
50
100
200
3.0
***
Rac1 pixel density/actin pixel density/CTRL
0
Cdc42 pixel density/actin pixel density/CTRL
**
Rock2 pixel density/actin pixel density/CTRL
RhoA pixel density/actin pixel density/CTRL
A
Page 9 of 17
2.5
*
2.0
1.5
1.0
0.5
0.0
0
50
100
200
B
8
6
4
***
2
2.5
1.8
**
1.6
1.4
1.2
1.0
0.8
0.6
0.4
0.2
0.0
0
0
50
100
200
Fig. 4 (See legend on next page.)
3 pixel density/actin pixel density/CTRL
**
pixel density/actin pixel density/CTRL
V pixel density/actin pixel density/CTRL
10
***
2.0
** **
1.5
1.0
0.5
0.0
0
50
100
200
0
50
100
200
16
***
14
12
10
**
8
**
6
4
2
0
0
50
100
200
Pasquier et al. BMC Cancer (2015) 15:569
Page 10 of 17
(See figure on previous page.)
Fig. 4 SDF-1alpha mediates Rho GTPase and integrin modulation. a Western blot analysis. MDA-MB-231 cells, serum-starved for 24 h, were
treated with various concentration of SDF-1α (50, 100 and 200 ng/ml). Western blots against RhoA, Rock2, Rac1 and cdc42 were performed.
The pixel density of each band has been divided by the corresponding actin band and by the control of the experiment. b Western blot
analysis. MDA-MB-231 cells, serum-starved for 24 h, were treated with various concentration of SDF-1α (50, 100 and 200 ng/ml) for 4 h.
Western blots against intergrin αV, β1 and β3 were performed. The pixel density of each band has been divided by the corresponding
actin band and by the control of the experiment
We demonstrated that maximal adhesion was obtained
at a SDF-1α concentration of 200 ng/ml (Fig. 3a). Confocal
microscopy imaging of MDA-MB231 treated with SDF-1α
revealed an increase of F-actin staining in the periphery of
the cells at 50 and 100 ng/ml (Fig. 3b). Stress fibers and
filopods formation required for the invasion of malignant
cells into tissues, were observed only at a concentration of
50 and 100 ng/ml. We then evaluated the role of SDF-1α in
cellular plasticity by quantifying network formation on
matrigel after 24 h of culture (Fig. 3c). Matrigel assays allow
rapid quantification of the relative invasive potential of
metastatic cells [41]. In this assay non tumorigenic cells
generally do not grow; while low metastatic tumor cells
form large round colonies, while high metastatic cells form
branching invasive colonies [42]. SDF-1α at 50 and 100 ng/
ml increased the formation of intercellular connections
while the 200 ng/ml treatment resulted in decrease branching. In a wound-healing migration assay, 50 and 100 ng/ml
of SDF-1α induced maximal migration (Fig. 3d).
To confirm this result, we developed an agarose gel
assay to test the chemotactic properties of different
concentration of SDF-1α (Fig. 3e left graph, Additional
file 1: Figure S2). All concentrations of SDF-1α significantly attracted MDA-MB231 cells as compared to well
with only media in it. In a 4 well setting, MDA-MB231
cells were more attracted toward 100 ng/ml of SDF-1α
as compared to control and 50 or 200 ng/ml (Fig. 3e
right graph, Additional file 1: Figure S3).
Finally SDF-1α treatment increased the number of
cells in S and G2/M at 50 and 100 ng/ml (Fig. 3f ).
Altogether we confirmed the previously described role
of SDF-1α on breast cancer migration and invasion.
However, we also illustrated that high concentration of
SDF-1α does not induce similar phenotypic modulation.
As we verified that CXCR4 expression was not modified
by high SDF-1α concentration (receptor endocytosis or
down regulation leading to loss of effect) (Additional
file 1: Figure S4A), we hypothesized that different downstream effectors could play a role in mediating the concentration dependent phenotypic modulation.
SDF-1α mediated Rho GTPase and integrin regulation is
concentration dependent
Rho GTPases proteins are known to control the dynamics of the actin cytoskeleton during cell migration, proliferation or adhesion [24, 43]. To evaluate the impact of
SDF-1α on regulation of these proteins, and upon the observation that different SDF-1α concentration induced different functional effects, MDA-MB231 cells were exposed
to different concentration of SDF-1α (0, 50, 100 and
200 ng/ml). Western Blot showed an increase of RhoA and
Rock2 protein up to a concentration of 100 ng/ml of SDF1α (Fig. 4a). Interestingly, this effect was reversed when
using 200 ng/ml of SDF-1α. Rac1 and CDC42 displayed a
mirror profile with a maximum expression at a concentration of 200 ng/ml. We confirmed the same profiled of expression of RhoA and Rac1 upon SDF-1α in MCF7, T47D
and MDA-MB-361(Additional file 1: Figure S4B-D).
As the changes in expression do not necessarily correlate with activation of Rho GTPases, we confirmed increased activation of RhoA and Rac1 using a GTP pulldown assay (Additional file 1: Figure S4E). Among the
mediators of migration, invasion and adhesion integrin
play a major role. The shift of integrin profile has been
associated to the acquisition of a metastatic phenotype
[44]. Thus we investigated their expression on MDAMB231 after SDF-1α treatment (Fig. 4c and Additional
file 1: Figure S5A). Western blot data show an upregulation of αV, β1 and β3 protein after 4 h of stimulation with 200 ng/ml of SDF-1α. Moreover, using
an inhibition strategy with monoclonal antibody, we
were able to confirm the role of the αV, β1 and β3 integrin in the adhesion of MDA-MB231 (Additional file 1:
Figure S5B).
A balance between RhoA and Rac1 activation mediates
differential effect of SDF-1α
To confirm the essential role of both RhoA and Rac1 we
used an inhibition strategy. Using a Si-RhoA (Additional
file 1: Figure S5C), we were able to show reduced actin
polymerization when MDA-MB231RhoA- were treated
with SDF-1α (Fig. 5a). The number of cellular extension
was also decreased by the inhibition of RhoA (data not
shown). SDF-1α mediated increase of intercellular connection was reversed in Si-RhoA transfected cells
(Fig. 5b). The inhibition of RhoA has a drastic negative
effect on the migration and proliferation of the MDAMB231 (Fig. 5c and d). However adhesion to BMHC
was increased in Si-RhoA transfected cells (Fig. 5e)
suggesting that activation of RhoA has a negative effect on the MDA-MB231 binding to the BMHC. As a
decrease in RhoA expression was leading to increased
Pasquier et al. BMC Cancer (2015) 15:569
Page 11 of 17
Control
A
SDF1 (100 ng/ml)
B
Interconnections number
Ns-SiRNA
30
*** ***
25
20
15
10
5
0
RhoA-SiRNA
SDF1
Ns-SiRNA
RhoA-SiRNA -
Control
Control
24h
SDF1
E
S
Ns-SiRNA
SDF1 50
53%
100%
14%
50%
RhoA-SiRNA
SDF1 50
30%
Fig. 5 (See legend on next page.)
G2/M
33%
Control
SDF1 100
D
G0/G1
70%
SDF1 100
Ns-SiRNA
RhoA-SiRNA
0h
35%
15%
30%
+
+
-
+
+
RhoA-siRNA
SDF1
C
+
-
Pasquier et al. BMC Cancer (2015) 15:569
Page 12 of 17
(See figure on previous page.)
Fig. 5 Functional consequences of inhibition of RhoA. a F-actin polymerisation in RhoA siRNA transfected MDA-MB231. Two days after si-RNA transfection,
MDA-MB-231 were grown on glass bottom slides and actin cytosqueletton was revealed by a phalloïdin-fluorescein (1 μg/mL) labelling. Pictures present
fluorescence microscope series of adherent MDA-MB-231 transfected with non-specific siRNA (ns-SiRNA), RhoA-specific (RhoA si-RNA) unstimulated or
stimulated with SDF-1α (100 ng/mL). RhoA inhibition reverted the increased of stress fiber in the treated sample. b RhoA specific si-RNA transfected
MDA-MB-231 plasticity on Matrigel. Two days after transfection, with non-specific si-RNA (ns-SiRNA) or RhoA specific (RhoA si-RNA) MDA-MB231 were
seeded on a 96-wells plate, coated with Matrigel. Microscopic pictures of cellular networks after SDF-1α stimulation (100 ng/ml) were taken after 18 h of
culture. Quantitative evaluation of the cellular interconnection is presented. The evaluation was made by counting the number of cellular interconnections
on 10 different fields. RhoA inhibition reversed the interconnection number increase in the treated sample. c Wound Closure assay. Two days after
transfection, with non-specific si-RNA (ns-SiRNA) or RhoA specific (RhoA si-RNA) MDA-MB231 migration ability was tested after a scratch with or without
SDF-1α (100 ng/ml). RhoA inhibition supressed the effect of SDF-1α on MDA-MB231 motility. d Cell cycle analysis. Two days after transfection, with
non-specific si-RNA (ns-SiRNA) or RhoA specific (RhoA si-RNA) MDA-MB231 were treated with or without SDF-1α (50 ng/ml) for 48 h and position in
cell cycle were evaluated with NIM-DAPI by flow cytometry. The inhibition of RhoA doesn’t have any effect on the position of the cell cycle position of
MDA-MB231. The results presents in this figure are representative of three different experiments. e Adherence of MDA-MB231 RhoA specific si-RNA
transfected cells to BMHC. Stable eGFP-MDA-MB231 cells were seeded on the plate and allow to adhere for one hour. As displayed Si-RhoA transfected
cancer cells displayed significantly increased adhesion compared to controls
adhesion, we hypothesized that the balance between
RhoA and Rac1 could be a mediator of the SDF-1α effect. We used the cell-sorting gate set-up in Fig. 2a to
separate MDA-MB231 after a co-culture of 2 or 5 days
with BMHC. The sorted cells displayed an increase of
Rac1 and Cdc42, but a decrease of Rock2 and RhoA
(Fig. 6a). Using NSC23766, a widely used inhibitor of
Rac1 activation, we were able to demonstrate a decrease of MDA-MB231 adhesion to both plastic and
BMHC despite SDF-1α treatment (Fig. 6b). We then
generated a knock-down of Rac1 through ShRNA
(Additional file 1: Figure S5C). We previously demonstrated an up-regulation of αV, β1 and β3 protein after
4 h of stimulation with 200 ng/ml of SDF-1α. Interestingly, when Rac1 was silenced in MDA-MB231, a
200 ng/ml of SDF-1α treatment didn’t lead to increased integrin expression confirming the major role
of Rac1 in MDA-MB231 adhesion through integrin
αV, β1 and β3 (Fig. 6c). When MDA-MB231 ShRac1
cells were co-cultured for 6 days with BMHC, we noticed a decrease in the number of cancer cells present
on BMHC (Fig. 6d top panels). Moreover, MDAMB231 ShRac1 cells co-cultured with BMHC in serum
free cytokine free media didn’t display any proliferative advantage as compared to MDA-MB231 Mock
(Fig. 6d bottom panel). Finally, we confirmed that
Rac1 inhibition reduced the number of proliferating
cells using a cell cycle analysis in presence of SDF-1α
(Fig. 6e).
Discussion
We demonstrated that the migration and adhesion sequences of breast cancer cells, induced by SDF-1α gradients, involves successively the activation and inactivation
of RhoA and an increased expression of Rac1 through
the gradient.
Krook et al. recently underlined the role of Rac1 and
Cdc42 for the CXCR4 dependent metastasis of Ewing
sarcoma cells to SDF-1α-rich microenvironments such
as lungs and bone marrow [45]. Cytokine mediated
tumor cell migration or chemo invasion, is an important
early step in cancer metastasis. Muller et al. have shown
that SDF-1α was mainly produced by organs that are frequent sites of breast cancer metastasis [16]. Experimental metastatic mouse models have shown that targeting
or silencing CXCR4 inhibited development of metastasis
in breast cancer [16, 46–49].
While the role of SDF-1α in the metastatic spread in
solid tumors has been clearly established, its role in activation of RhoGTPases has only been described in the
context of multiple myeloma where SDF-1α binding to
its receptor CXCR4 induces chemotaxis and motility
through RhoA activation [23].
However, it is essential to understand how a single
cytokine can modulate apparently contradictory effects. The importance of cytokine gradients has been
illustrated in the developmental context, where SDF1α gradient is primordial during migration of the zebrafish posterior lateral line primordium [50]. Kim
et al. have investigated the role of SDF-1α gradient
and their data is concordant with our findings as they
demonstrated reduction of MDA-MB231 velocity at
high concentration of SDF-1α (above 150nM) [51].
Similarly, the migration of leukemic cell lines (KG-1v,
KG-1a, HL-60, and leucapheresis-derived CD34+) was
reduced at high concentration of SDF-1α (180 vs
60nM) [52].
Our main hypothesis is that breast cancer cells are
not exposed to similar concentration of SDF-1α during the metastatic process. The differential tissue concentration of cytokines has been shown in different
physiological and pathological contexts such as ischemia and tumor grade in glioblastoma [53, 54].
We have shown for example that endothelial cells
from the bone marrow secrete a high concentration of
SDF-1α as compared to endothelial cells from other organs [55]. Such differential organ concentration can influence cancer cell plasticity. Indeed extensive work
Pasquier et al. BMC Cancer (2015) 15:569
Page 13 of 17
***
7
Target/Actin pixel density/Control
A
***
6
***
5
RhoA
ROCK2
RAC1
CDC42
***
4
3
2
1
0
Control Day 2
B
***
250
D
**
200
150
MDA Mock
MDA ShRac1
4.0
3.5
100
Cell number (x105)
Adherent MDA cells
(% of control)
C
Day 5
50
0
SDF1
NSC23766
BMHC
-
+
-
+
+
-
+
+
+
3.0
2.5
2.0
1.5
1.0
0.5
0.0
0
E
1
2
3
4
Time (Days)
G0/G1
S
71%
G2/M
NSC23766
SDF1 50
19%
10%
Fig. 6 (See legend on next page.)
5
6
Pasquier et al. BMC Cancer (2015) 15:569
Page 14 of 17
(See figure on previous page.)
Fig. 6 RhoGTPase modulation in a co-culture settings of MDA-MB231 and BMHC. a Western blot analysis. MDA-MB231 were sorted after a 2 days
or 5 days of co-culture with BMHC as the chart presented in Fig. 2b. Co-culture increased the level of Rac1(up left panel) and Cdc42 (bottom left
panel) but decreased Rhoa and Rock2 (middle panel) in MDA-MB231. The pixel density of each band has been divided by the corresponding
actin band and then by the control of the experiment. The results are represented in the right histogram. b Adhesion assay. BMHC were plated
up to 60 % confluency, 50,000 eGFP MDA-MB231 were allowed to adhere for 1 h in presence or not of SDF-1α and a Rac1 inhibitor (NSC23766).
Plastic was used as negative control. Rac1 inhibition significantly decreased the adhesion of MDA-MB231 to BMHC. c Western blots analysis.
MDA-MB-231 Mock or ShRac1, serum-starved for 24 h, were treated with SDF-1α (200 ng/ml) for 4 h. Western blots against integrin αV, β1, and
β3 were performed. d Proliferation assay. MDA-MB231 Mock or ShRac1 were plated and counted every 2 days in presence of BMHC during 6 days
in serum free condition. Images represent the co-culture of BMHC and MDA-MB231 Mock (left) or ShRac1 (right) in phase microscopy. Scale bar
250 μm. The chart represents the proliferation curve of MDA-MB231 Mock (black circle) or ShRac1 (white circle). BMHC were able to increase
proliferation of MDA-MB231 Mock but not the ShRac1 one. e Cell cycle analysis. MDA-MB231 were treated with SDF-1α (50 ng/ml) and a Rac1
inhibitor (NSC23766) for 48 h and position in cell cycle were evaluated with NIM-DAPI by flow cytometry. The inhibition of Rac1 reversed the
effect of SDF-1α on the cell cycle position of MDA-MB231
from Massague clearly demonstrates that the microenvironment of the host organ plays a role in selecting
specific cancer cell clones or phenotype. Interestingly
in their data and among the genes involved in Bone
Marrow metastasis, CXCR4 expression was significantly
increased [56].
SDF-1α induced-RhoGTPases activation (expression) in cancer has been previously linked to cell migration. In our settings, CXCR4 expression was not
modified with low and high concentration of SDF-1α.
Hence, suggesting different mechanisms for the differential
regulation of RhoA and Rac1 expression. The differential
regulation of RhoA and Rac1 has been previously suggested, where by the expression of dominant negative Rho
family GTPases mimics activation of other member of the
Rho GTPases family [57]. Inactivation of Rac1 can result in
an inversion of polarity associated to an activation of RhoA
[58]. Metastatic cells interacting with bone marrow cells
display higher levels of Rac1 in vitro and in vivo [59–62].
We found that SDF-1α concentration level radically
modifies the integrin expression profile, where high
SDF-1α concentration increased in αV, β1 and β3. αVβ3
integrin regulates Rac1 in endothelial migration and
angiogenesis [63]. αVβ1 activates Rac1 in CHO cells and
stop cell migration and increase adhesion through cell
polarization [64]. Rac1 up regulation has been associated
to RhoA inhibition and linked to the modulation of the
cytoskeleton [65].
Fig. 7 Differential role of small GTPase in BMHC and MDA-MB231 interactions
Pasquier et al. BMC Cancer (2015) 15:569
If the clinical relevance of our findings is confirmed,
then one might think that targeting RhoA could induce increased adhesion and potential homing; down-regulating
the Rac1 signaling would induce increase migratory
proprieties. SDF-1α blockade is currently used in hematopoietic stem cell mobilization, and is under evaluation in
the treatment of leukemia and solid tumors [66].
Conclusion
Our understanding of metastatic development in breast
cancer is crucial to design novel therapeutic strategies.
The role of the microenvironmental cues, in particular
the cytokine mediated signaling has been already established in breast cancer metastasis. Here using an in vitro
approach we were able to explain two apparently contradictory roles of the interaction between SDF-1α/CXCR4.
We showed that while low concentration of SDF-1α
promoted cell migration through RhoA activation, high
concentration of the cytokine promoted intercellular interaction through Rac1 activation (Fig. 7). Our findings
shed light on the dynamics of the interaction between
breast cancer cells and their microenvironment, as well as
the dual role of SDF-1α.
Additional file
Additional file 1: Figure S1. A. This figure displays pictures of the
3 and 5wells agarose petri dish used for the migration assay.
B. Western blot analysis of six different breast cancer cell lines,
SK-BR-3, T47D, MDA-MB361, MDA-MB231, MCF7 and Hs578t for CXCR4
expression. C. Flow cytometry chart of CXCR4 expression in T47D,
MDA-MB361, MCF7 or SK-BR-3 cell sorted after a co-culture of 5 days
with BMHC. Figure S2. This figure displays representative pictures
taken for the 3 wells agarose migration assay. Figure S3. This figure
displays representative pictures taken for the 5 wells agarose
migration assay. Figure S4. A. Flow cytometry against CXCR4. Plots
for unstained and MDA-MB231 untreated were overlaid (left) and
plots for MDA-MB231 treated with the different concentration of
SDF-1α (right). B-D. Western blot analysis. T47D (B), MCF7 (C) or
MDA-MB-361 (D) cells, serum-starved for 24 h, were treated with
various concentration of SDF-1α (50, 100 and 200 ng/ml). Western
blots against RhoA and Rac1 were performed. E. RhoA and Rac1
Activation Assay. SDF-1α treatment increased the amount of active
GTP-bound RhoA (RhoA-GTP) and active GTP-bound Rac1 (Rac1-GTP).
Total RhoA and Rac1 served as loading control (n = 3). Figure S5.
A. Western blot analysis. MDA-MB-231 cells, serum-starved for 24 h,
were treated with various concentration of SDF-1α (50, 100 and
200 ng/ml) for 4 h. Western blots against intergrin α4, α5, β4 and β5
were performed. B. Adhesion assay testing the role of integrin in the
adhesion of MDA-MB231 cells under SDF-1α treatment. Fifty thousand
eGFP MDA-MB231 were allowed to adhere for 1 h in presence or
absence of monoclonal antibody against integrin β1, β3 or αV or a
mix of the 3 antibodies. C. RhoA SiRNA efficiency in MDA-MB231. Five
days after the SiRNA treatment, RhoA level was evaluated by Western
Blot. RhoA is completely abolished in MDA-MB231 after SiRNA
treatment. D. Rac1 ShRNA efficiency in MDA-MB231. Rac1 level was
evaluated by Western Blot. (PDF 2821 kb)
Competing interests
Authors declare that there are no competing financial interests in relation to
the work described. There are no non-financial competing interests.
Page 15 of 17
Authors’ contributions
JP, NAK, HA, AM, FV, HAT, JHV, BC, GF, AR. Conception and design are made
by JP and AR. Acquisition of data is made by JP, NAK. RNA silencing and
generation of lentiviral particles were performed by HA and AM. Analysis and
interpretation of the data are made by JP, NAK, FV, BC and AR. Paper
preparation was done by JP and NAK. JP, NAK, GF and AR wrote the paper.
Paper reviewing is done by HA, FV, HAT, JHV and BC. All authors read and
approved the final manuscript.
Acknowledgements
We would like to thank warmly Jenine Davidson for her help with the
design of the conclusion figure. We would like to appreciate greatly the help
of Mariam El Bakry for the order and all her administrative work.
We thank the Flow Cytometry Facility within the Microscopy Core at Weill
Cornell Medical College in Qatar for contributing to these studies. The Core
is supported by the “Biomedical Research Program at Weill Cornell Medical
College in Qatar”, a program funded by Qatar Foundation.
Financial support: This publication was made possible by grants from the
Qatar National Research Fund under its National Priorities Research Program
award number NPRP 09-1174-3-291 and NPRP 4-640-1-096. Its contents are
solely the responsibility of the authors and do not necessarily represent the
views of the Qatar National Research Fund.
Author details
Stem Cell and Microenvironment Laboratory, Weill Cornell Medical College
in Qatar, Education City, Qatar Foundation, Doha, Qatar. 2Department of
Genetic Medicine, Weill Cornell Medical College, New York, NY, USA.
3
Department of Immunology and Microbiology, Weill Cornell Medical
College in Qatar, Qatar Foundation, Education city, P.O. Box: 24144, Doha,
Qatar. 4EA 4553, Institut Claudius Regaud, Toulouse, France. 5INSERM U1037
Cancer Research Center of Toulouse, Institut Claudius Regaud, Toulouse,
France. 6Department of Advanced gynecologic Surgery, Université
Montpellier 1, Montpellier, France. 7Department of Genetic Medicine and
Obstetrics and Gynecology, Stem cell and microenvironment laboratory Weill
Cornell Medical College in Qatar, Qatar-Foundation, PO: 24144, Doha, Qatar.
1
Received: 7 January 2015 Accepted: 14 July 2015
References
1. Eisemann N, Waldmann A, Katalinic A. Epidemiology of breast
cancer—current figures and trends. Geburtshilfe Frauenheilkd.
2013;73(2):130–5.
2. Yeatman TJ, Nicolson GL. Molecular basis of tumor progression:
mechanisms of organ-specific tumor metastasis. Semin Surg Oncol.
1993;9(3):256–63.
3. Ben-Baruch A. Organ selectivity in metastasis: regulation by chemokines and
their receptors. Clin Exp Metastas. 2008;25(4):345–56.
4. Dittmar T, Heyder C, Gloria-Maercker E, Hatzmann W, Zanker KS. Adhesion
molecules and chemokines: the navigation system for circulating tumor
(stem) cells to metastasize in an organ-specific manner. Clin Exp Metastas.
2008;25(1):11–32.
5. Lis R, Touboul C, Mirshahi P, Ali F, Mathew S, Nolan DJ, et al. Tumor
associated mesenchymal stem cells protects ovarian cancer cells from
hyperthermia through CXCL12. Int J Cancer. 2011;128(3):715–25.
6. Touboul C, Lis R, Al Farsi H, Raynaud CM, Warfa M, Althawadi H, et al.
Mesenchymal stem cells enhance ovarian cancer cell infiltration through IL6
secretion in an amniochorionic membrane based 3D model. J Transl Med.
2013;11:28.
7. Burger JA, Peled A. CXCR4 antagonists: targeting the microenvironment in
leukemia and other cancers. Leukemia. 2009;23(1):43–52.
8. Luker KE, Luker GD. Functions of CXCL12 and CXCR4 in breast cancer.
Cancer Lett. 2006;238(1):30–41.
9. Ali S, Lazennec G. Chemokines: novel targets for breast cancer metastasis.
Cancer Metastasis Rev. 2007;26(3–4):401–20.
10. Ibrahim T, Sacanna E, Gaudio M, Mercatali L, Scarpi E, Zoli W, et al. Role of
RANK, RANKL, OPG, and CXCR4 tissue markers in predicting bone
metastases in breast cancer patients. Clin Breast Cancer. 2011;11(6):369–75.
11. Crump MP, Gong JH, Loetscher P, Rajarathnam K, Amara A, ArenzanaSeisdedos F, et al. Solution structure and basis for functional activity of
Pasquier et al. BMC Cancer (2015) 15:569
12.
13.
14.
15.
16.
17.
18.
19.
20.
21.
22.
23.
24.
25.
26.
27.
28.
29.
30.
31.
32.
33.
34.
35.
stromal cell-derived factor-1; dissociation of CXCR4 activation from binding
and inhibition of HIV-1. EMBO J. 1997;16(23):6996–7007.
Horuk R. Chemokine receptors. Cytokine Growth Factor Rev.
2001;12(4):313–35.
Saini V, Staren DM, Ziarek JJ, Nashaat ZN, Campbell EM, Volkman BF, et al.
The CXC chemokine receptor 4 ligands ubiquitin and stromal cell-derived
factor-1alpha function through distinct receptor interactions. J Biol Chem.
2011;286(38):33466–77.
Schwartz V, Lue H, Kraemer S, Korbiel J, Krohn R, Ohl K, et al. A functional
heteromeric MIF receptor formed by CD74 and CXCR4. FEBS Lett.
2009;583(17):2749–57.
Chiang AC, Massague J. Molecular basis of metastasis. N Engl J Med.
2008;359(26):2814–23.
Muller A, Homey B, Soto H, Ge N, Catron D, Buchanan ME, et al.
Involvement of chemokine receptors in breast cancer metastasis. Nature.
2001;410(6824):50–6.
Helbig G, Christopherson 2nd KW, Bhat-Nakshatri P, Kumar S, Kishimoto H,
Miller KD, et al. NF-kappaB promotes breast cancer cell migration and
metastasis by inducing the expression of the chemokine receptor CXCR4.
J Biol Chem. 2003;278(24):21631–8.
Roccaro AM, Sacco A, Purschke WG, Moschetta M, Buchner K, Maasch C,
et al. SDF-1 Inhibition Targets the Bone Marrow Niche for Cancer Therapy.
Cell Rep. 2014;9:118–28.
Cojoc M, Peitzsch C, Trautmann F, Polishchuk L, Telegeev GD, Dubrovska A.
Emerging targets in cancer management: role of the CXCL12/CXCR4 axis.
Onco Targets Ther. 2013;6:1347–61.
Bajetto A, Bonavia R, Barbero S, Piccioli P, Costa A, Florio T, et al. Glial and
neuronal cells express functional chemokine receptor CXCR4 and its natural
ligand stromal cell-derived factor 1. J Neurochem. 1999;73(6):2348–57.
Holland JD, Kochetkova M, Akekawatchai C, Dottore M, Lopez A, McColl SR.
Differential functional activation of chemokine receptor CXCR4 is mediated
by G proteins in breast cancer cells. Cancer Res. 2006;66(8):4117–24.
Gautam N, Downes GB, Yan K, Kisselev O. The G-protein betagamma
complex. Cell Signal. 1998;10(7):447–55.
Azab AK, Azab F, Blotta S, Pitsillides CM, Thompson B, Runnels JM, et al.
RhoA and Rac1 GTPases play major and differential roles in stromal
cell-derived factor-1-induced cell adhesion and chemotaxis in multiple
myeloma. Blood. 2009;114(3):619–29.
Etienne-Manneville S, Hall A. Rho GTPases in cell biology. Nature.
2002;420(6916):629–35.
Jaffe AB, Hall A. Rho GTPases in transformation and metastasis. Adv Cancer
Res. 2002;84:57–80.
Prendergast GC, Khosravi-Far R, Solski PA, Kurzawa H, Lebowitz PF, Der CJ.
Critical role of Rho in cell transformation by oncogenic Ras. Oncogene.
1995;10(12):2289–96.
Fritz G, Brachetti C, Bahlmann F, Schmidt M, Kaina B. Rho GTPases in human
breast tumours: expression and mutation analyses and correlation with
clinical parameters. Br J Cancer. 2002;87(6):635–44.
Couderc B, Pradines A, Rafii A, Golzio M, Deviers A, Allal C, et al. In vivo
restoration of RhoB expression leads to ovarian tumor regression. Cancer
Gene Ther. 2008;15(7):456–64.
Sarrabayrouse G, Synaeve C, Leveque K, Favre G, Tilkin-Mariame AF. Statins
stimulate in vitro membrane FasL expression and lymphocyte apoptosis
through RhoA/ROCK pathway in murine melanoma cells. Neoplasia.
2007;9(12):1078–90.
Medale-Giamarchi C, Lajoie-Mazenc I, Malissein E, Meunier E, Couderc B,
Berge Y, et al. RhoB modifies estrogen responses in breast cancer cells by
influencing expression of the estrogen receptor. Breast Cancer Res.
2013;15(1):R6.
Touboul C, Vidal F, Pasquier J, Lis R, Rafii A. Role of mesenchymal cells in
the natural history of ovarian cancer: a review. J Transl Med. 2014;12(1):271.
Mirshahi P, Rafii A, Vincent L, Berthaut A, Varin R, Kalantar G, et al.
Vasculogenic mimicry of acute leukemic bone marrow stromal cells.
Leukemia. 2009;23(6):1039–48.
Rafii A, Mirshahi P, Poupot M, Faussat AM, Simon A, Ducros E, et al.
Oncologic trogocytosis of an original stromal cells induces chemoresistance
of ovarian tumours. PLoS One. 2008;3(12):e3894.
Mousseau Y, Leclers D, Faucher-Durand K, Cook-Moreau J, Lia-Baldini AS,
Rigaud M, et al. Improved agarose gel assay for quantification of growth
factor-induced cell motility. Biotechniques. 2007;43(4):509–16.
Laguri C, Sadir R, Rueda P, Baleux F, Gans P, Arenzana-Seisdedos F, et al. The
novel CXCL12gamma isoform encodes an unstructured cationic domain
Page 16 of 17
36.
37.
38.
39.
40.
41.
42.
43.
44.
45.
46.
47.
48.
49.
50.
51.
52.
53.
54.
55.
56.
which regulates bioactivity and interaction with both glycosaminoglycans
and CXCR4. PLoS One. 2007;2(10):e1110.
Pasquier J, Rioult D, Abu-Kaoud N, Marie S, Rafii A, Guerrouahen BS, et al.
P-glycoprotein-activity measurements in multidrug resistant cell lines:
single-cell versus single-well population fluorescence methods. Biomed Res
Int. 2013;2013:676845.
Ghiabi P, Jiang J, Pasquier J, Maleki M, Abu-Kaoud N, Rafii S, et al.
Endothelial cells provide a notch-dependent pro-tumoral niche for
enhancing breast cancer survival, stemness and pro-metastatic properties.
PLoS One. 2014;9(11):e112424.
Pasquier J, Thawadi HA, Ghiabi P, Abu-Kaoud N, Maleki M, Guerrouahen BS,
et al. Microparticles mediated cross-talk between tumoral and endothelial
cells promote the constitution of a pro-metastatic vascular niche through
Arf6 up regulation. Cancer Microenviron. 2014;7:41–59.
Pasquier J, Guerrouahen BS, Al Thawadi H, Ghiabi P, Maleki M, Abu-Kaoud
N, et al. Preferential transfer of mitochondria from endothelial to cancer
cells through tunneling nanotubes modulates chemoresistance. J Transl
Med. 2013;11:94.
Raynaud CM, Halabi N, Elliott DA, Pasquier J, Elefanty AG, Stanley EG, et al.
Human embryonic stem cell derived mesenchymal progenitors express
cardiac markers but do not form contractile cardiomyocytes. PLoS One.
2013;8(1):e54524.
Albini A, Iwamoto Y, Kleinman HK, Martin GR, Aaronson SA, Kozlowski JM,
et al. A rapid in vitro assay for quantitating the invasive potential of tumor
cells. Cancer Res. 1987;47(12):3239–45.
Albini A, Benelli R, Noonan DM, Brigati C. The “chemoinvasion assay”: a tool
to study tumor and endothelial cell invasion of basement membranes. Int J
Dev Biol. 2004;48(5–6):563–71.
Vega FM, Ridley AJ. Rho GTPases in cancer cell biology. FEBS Lett.
2008;582(14):2093–101.
Onodera Y, Nam JM, Sabe H. Intracellular trafficking of integrins in cancer
cells. Pharmacol Ther. 2013;140(1):1–9.
Krook MA, Nicholls LA, Scannell CA, Chugh R, Thomas DG, Lawlor ER.
Stress-induced CXCR4 promotes migration and invasion of ewing sarcoma.
Mol Cancer Res. 2014;12(6):953–64.
Hassan S, Buchanan M, Jahan K, Aguilar-Mahecha A, Gaboury L, Muller WJ,
et al. CXCR4 peptide antagonist inhibits primary breast tumor growth,
metastasis and enhances the efficacy of anti-VEGF treatment or docetaxel in
a transgenic mouse model. Int J Cancer. 2011;129(1):225–32.
Huang EH, Singh B, Cristofanilli M, Gelovani J, Wei C, Vincent L, et al. A
CXCR4 antagonist CTCE-9908 inhibits primary tumor growth and metastasis
of breast cancer. J Surg Res. 2009;155(2):231–6.
Smith MC, Luker KE, Garbow JR, Prior JL, Jackson E, Piwnica-Worms D, et al.
CXCR4 regulates growth of both primary and metastatic breast cancer.
Cancer Res. 2004;64(23):8604–12.
Liang Z, Yoon Y, Votaw J, Goodman MM, Williams L, Shim H. Silencing of
CXCR4 blocks breast cancer metastasis. Cancer Res. 2005;65(3):967–71.
Venkiteswaran G, Lewellis SW, Wang J, Reynolds E, Nicholson C, Knaut H.
Generation and dynamics of an endogenous, self-generated signaling
gradient across a migrating tissue. Cell. 2013;155(3):674–87.
Kim BJ, Hannanta-anan P, Chau M, Kim YS, Swartz MA, Wu M. Cooperative
roles of SDF-1alpha and EGF gradients on tumor cell migration revealed by
a robust 3D microfluidic model. PLoS One. 2013;8(7):e68422.
Netelenbos T, Zuijderduijn S, Van Den Born J, Kessler FL, Zweegman S,
Huijgens PC, et al. Proteoglycans guide SDF-1-induced migration of
hematopoietic progenitor cells. J Leukoc Biol. 2002;72(2):353–62.
De Falco E, Porcelli D, Torella AR, Straino S, Iachininoto MG, Orlandi A, et al.
SDF-1 involvement in endothelial phenotype and ischemia-induced
recruitment of bone marrow progenitor cells. Blood. 2004;104(12):3472–82.
Rempel SA, Dudas S, Ge S, Gutierrez JA. Identification and localization of the
cytokine SDF1 and its receptor, CXC chemokine receptor 4, to regions of
necrosis and angiogenesis in human glioblastoma. Clin Cancer Res.
2000;6(1):102–11.
Nolan DJ, Ginsberg M, Israely E, Palikuqi B, Poulos MG, James D, et al.
Molecular signatures of tissue-specific microvascular endothelial cell
heterogeneity in organ maintenance and regeneration. Dev Cell.
2013;26(2):204–19.
Kang Y, Siegel PM, Shu W, Drobnjak M, Kakonen SM, Cordon-Cardo C, et al.
A multigenic program mediating breast cancer metastasis to bone. Cancer
Cell. 2003;3(6):537–49.
Pasquier et al. BMC Cancer (2015) 15:569
Page 17 of 17
57. Moorman JP, Luu D, Wickham J, Bobak DA, Hahn CS. A balance of signaling
by Rho family small GTPases RhoA, Rac1 and Cdc42 coordinates cytoskeletal
morphology but not cell survival. Oncogene. 1999;18(1):47–57.
58. Yu W, Shewan AM, Brakeman P, Eastburn DJ, Datta A, Bryant DM, et al.
Involvement of RhoA, ROCK I and myosin II in inverted orientation of
epithelial polarity. EMBO Rep. 2008;9(9):923–9.
59. Kamura S, Matsumoto Y, Fukushi JI, Fujiwara T, Iida K, Okada Y, et al. Basic
fibroblast growth factor in the bone microenvironment enhances cell
motility and invasion of Ewing’s sarcoma family of tumours by activating
the FGFR1-PI3K-Rac1 pathway. Br J Cancer. 2010;103(3):370–81.
60. Barthel SR, Hays DL, Yazawa EM, Opperman M, Walley KC, Nimrichter L,
et al. Definition of molecular determinants of prostate cancer cell bone
extravasation. Cancer Res. 2013;73(2):942–52.
61. McGrail DJ, Ghosh D, Quach ND, Dawson MR. Differential mechanical
response of mesenchymal stem cells and fibroblasts to tumor-secreted
soluble factors. PLoS One. 2012;7(3), e33248.
62. Wang JY, Yu P, Chen S, Xing H, Chen Y, Wang M, et al. Activation of Rac1
GTPase promotes leukemia cell chemotherapy resistance, quiescence and
niche interaction. Mol Oncol. 2013;7(5):907–16.
63. Dormond O, Foletti A, Paroz C, Ruegg C. NSAIDs inhibit alpha V beta 3
integrin-mediated and Cdc42/Rac-dependent endothelial-cell spreading,
migration and angiogenesis. Nat Med. 2001;7(9):1041–7.
64. Cox EA, Sastry SK, Huttenlocher A. Integrin-mediated adhesion regulates cell
polarity and membrane protrusion through the Rho family of GTPases. Mol
Biol Cell. 2001;12(2):265–77.
65. Raftopoulou M, Hall A. Cell migration: Rho GTPases lead the way. Dev Biol.
2004;265(1):23–32.
66. De Nigris D, Collins DL, Arbel T. Multi-modal image registration based on
gradient orientations of minimal uncertainty. IEEE Trans Med Imaging.
2012;31(12):2343–54.
Submit your next manuscript to BioMed Central
and take full advantage of:
• Convenient online submission
• Thorough peer review
• No space constraints or color figure charges
• Immediate publication on acceptance
• Inclusion in PubMed, CAS, Scopus and Google Scholar
• Research which is freely available for redistribution
Submit your manuscript at
www.biomedcentral.com/submit