The Danish cancer pathway for patients with serious non-specific symptoms and signs of cancer–a cross-sectional study of patient characteristics and cancer probability
Bạn đang xem bản rút gọn của tài liệu. Xem và tải ngay bản đầy đủ của tài liệu tại đây (1.19 MB, 11 trang )
Ingeman et al. BMC Cancer (2015) 15:421
DOI 10.1186/s12885-015-1424-5
RESEARCH ARTICLE
Open Access
The Danish cancer pathway for patients with
serious non-specific symptoms and signs of
cancer–a cross-sectional study of patient
characteristics and cancer probability
Mads Lind Ingeman1,2,3*, Morten Bondo Christensen1, Flemming Bro1, Søren T. Knudsen4 and Peter Vedsted1,2
Abstract
Background: A Danish cancer pathway has been implemented for patients with serious non-specific symptoms
and signs of cancer (NSSC-CPP). The initiative is one of several to improve the long diagnostic interval and the poor
survival of Danish cancer patients. However, little is known about the patients investigated under this pathway. We
aim to describe the characteristics of patients referred from general practice to the NSSC-CPP and to estimate the
cancer probability and distribution in this population.
Methods: A cross-sectional study was performed, including all patients referred to the NSSC-CPP at the hospitals in
Aarhus or Silkeborg in the Central Denmark Region between March 2012 and March 2013. Data were based on a
questionnaire completed by the patient’s general practitioner (GP) combined with nationwide registers. Cancer
probability was the percentage of new cancers per investigated patient. Associations between patient characteristics
and cancer diagnosis were estimated with prevalence rate ratios (PRRs) from a generalised linear model.
Results: The mean age of all 1278 included patients was 65.9 years, and 47.5 % were men. In total, 16.2 % of all
patients had a cancer diagnosis after six months; the most common types were lung cancer (17.9 %), colorectal
cancer (12.6 %), hematopoietic tissue cancer (10.1 %) and pancreatic cancer (9.2 %). All patients in combination had
more than 80 different symptoms and 51 different clinical findings at referral. Most symptoms were non-specific
and vague; weight loss and fatigue were present in more than half of all cases. The three most common clinical
findings were ‘affected general condition’ (35.8 %), ‘GP’s gut feeling’ (22.5 %) and ‘findings from the abdomen’
(13.0 %). A strong association was found between GP-estimated cancer risk at referral and probability of cancer.
Conclusions: In total, 16.2 % of the patients referred through the NSSC-CPP had cancer. They constituted a
heterogeneous group with many different symptoms and clinical findings. The GP’s gut feeling was a common reason
for referral which proved to be a strong predictor of cancer. The GP’s overall estimation of the patient’s risk of cancer at
referral was associated with the probability of finding cancer.
Keywords: Fast-track, Neoplasm, General practice, Diagnosis, Cancer symptoms, Denmark
* Correspondence:
1
Research Unit for General Practice, Aarhus University, Aarhus, Denmark
2
Research Centre for Cancer Diagnosis in Primary Care (CaP), Aarhus
University, Aarhus, Denmark
Full list of author information is available at the end of the article
© 2015 Ingeman et al.; licensee BioMed Central. This is an Open Access article distributed under the terms of the Creative
Commons Attribution License ( which permits unrestricted use, distribution, and
reproduction in any medium, provided the original work is properly credited. The Creative Commons Public Domain
Dedication waiver ( applies to the data made available in this article,
unless otherwise stated.
Ingeman et al. BMC Cancer (2015) 15:421
Background
Cancer is the most common cause of death in Denmark
and many other countries. One in five of all citizens in
the developed world will die from cancer [1]. British and
Danish cancer patients experience poorer cancer survival
rates than patients from other western countries [2, 3].
Differences in public cancer awareness, health-care seeking behaviour, diagnostic pathways and treatment options
have been suggested as important contributing factors [3].
Studies indicate that early diagnosis of cancer is important
for improving the prognosis [4, 5]. The health care system
must, therefore, provide medical services for prompt
cancer diagnosis.
The majority of patients with cancer have a symptomatic presentation of the disease [6]. Symptoms are often
diverse and may evolve over time as the cancer develops.
In many health systems, general practitioners (GPs) form
the first line of health care and provide medical advice
to an unselected group of people. At the same time,
GPs often act as ‘gatekeepers’ to ensure appropriate and
timely flow of patients into the more specialized health
services [7]. Thus, general practice plays a central role in
diagnosing cancer [8–10]. Furthermore, the use of general practice has been shown to increase significantly
several months before a patient is diagnosed with cancer [11]; this indicates an open ‘diagnostic window’.
To reduce the length of the diagnostic interval, several
countries have implemented urgent referral cancer pathways [9, 12, 13] for patients with clinical suspicion of
cancer [14]. In the UK, such pathway was introduced as
the 2-week wait referral (2WW) system [15]. The first
Danish Cancer Patient Pathways (CPPs) for diagnosis
and treatment of suspected cancer were implemented in
2008; these are specific clinical pathways for several of the
most common cancers/cancer sites [14, 16]. Once the GP
refers the patient to a CPP, all diagnostic and treatment
procedures will be promptly organised in well-defined
processes; all relevant clinical investigations and treatments will be planned and booked within a given number
of days. The aim of the CPP is to offer patients optimal
diagnosis and treatment, which may ultimately improve
their prognosis, and to provide better quality of life by
reducing the insecurity that tends to accompany unwarranted delays.
Alarm symptoms of cancer and the related practice
guidelines [17] are the primary focus of both the Danish
and the British pathways [18, 19]. This approach may result in shorter diagnostic intervals [20] for patients with
specific alarm symptoms. However, only approx. 40 % of
all cancer patients seem to have benefitted from the implementation of the CPPs based on alarm symptoms as
demonstrated by British and Danish studies [21, 22].
This is due to the fact that only half of cancer patients
initially present symptoms classified as alarm symptoms
Page 2 of 11
by the GP [8, 21], findings from the UK indicate similar
figures [20]. As a consequence of these findings, additional
CPPs were implemented in Denmark in 2011 for patients
with serious non-specific symptoms and signs of cancer
(NSSC-CPP) [23]. These provided the Danish GPs with
the opportunity to refer patients with serious non-specific
symptoms for further diagnostic workup if cancer is
suspected although no alarm symptoms (qualifying for
specific CPP routes) are present [24]. However, the
consequences of this urgent referral modality are not
known at present. In particular, more information is
needed on i) which patients are referred, ii) which factors
constitute the basis of the referral and iii) whether or not
the investigated patients have cancer.
This paper aims to describe the characteristics of patients
referred from general practice to the Danish NSSC-CPP
and to estimate the probability and distribution of cancers
in this population.
Methods
We performed a cross-sectional study including all patients aged 18 years or more who were referred to the
NSSC-CPP at the hospitals in Aarhus or Silkeborg in the
Central Denmark Region between 7 March 2012 and 27
March 2013. All identified patients were followed up for
six months for the diagnosis of cancer.
Setting and NSSC-CPP organisation
All Danish residents are entitled to tax-financed public
health-care benefits with free access to health care. More
than 98 % of Danish citizens are registered with a specific
general practice. The GPs act as gatekeepers to the rest
of the health-care system, except for emergencies [25].
During one year, 85 % of the Danish population is in
contact with general practice.
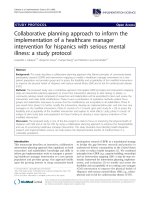
All patients referred from their GP to the NSSC-CPP
underwent a filter function comprising three components: a battery of blood tests, a urine test and diagnostic imaging. The diagnostic imaging consisted of an
abdominal ultrasound and a chest X-ray performed at
Silkeborg hospital and a CT scan (with contrast) of chest,
abdomen and pelvis performed at Aarhus University
Hospital. The results of the diagnostic imaging were
first assessed by a radiologist, and the GP subsequently
interpreted all test results in combination and decided
on further diagnostic steps to be taken. Such steps could
be either watchful waiting or referral to a diagnostic
centre for further investigations. If a specific disease or
type of cancer was suspected, further steps could also
involve referral to a medical specialist or another
cancer-specific CPP (Fig. 1).
A diagnostic centre is a medical unit with comprehensive facilities for diagnostic investigation, including easy
access to expertise in a wide range of relevant medical
Ingeman et al. BMC Cancer (2015) 15:421
Page 3 of 11
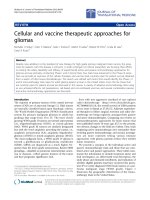
Fig. 1 Organisation of the Danish NSSC-CPP
specialties (e.g. oncology, gynaecology, gastroenterological
surgery, orthopaedics and radiology). NSSC-CPP patients
referred to a diagnostic centre must undergo further investigations on the basis of presented symptoms and
clinical findings (e.g. blood tests, diagnostic imaging,
endoscopies and biopsies). Based on the findings, the
patient is either referred to a CPP for a specific cancer,
to a specific hospital department or back to the GP.
The Danish medical services are divided into five regions, and each of these regions must have at least one
diagnostic centre. Approx. 15 centres have so far been
established in Denmark.
Identification of patients
All patients who underwent the filter function were
identified and included. In the Silkeborg catchment area,
eligible patients were identified by a digital marker on
the battery of blood tests. At the hospital in Aarhus, all
patients receiving CT scans as part of the filter function
were identified with a particular code.
The unique civil registration number (CRN), which is
assigned to all Danish citizens, links the medical records
at the personal level across the Danish national registries
[26]. Newly identified patients were extracted every two
weeks, and we linked these data to the Health Service
Registry (HSR) in the Central Denmark Region to identify the GP of each of the included patients.
Some referrals to the NSSC-CPP were made from
hospital departments. To ensure inclusion of only relevant patients, we sent a letter to the GPs of the patients
who were referred from the hospital to clarify whether
the GP had been involved in the referral of this particular
patient.
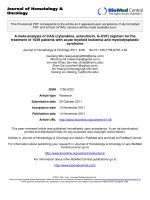
In total, 1899 referrals (1837 unique patients) were
identified. We decided to consider two referrals of the
same patient as two separate events if six or more
months had passed between the referrals.
A total of 167 (8.0 %) referrals were excluded for the following reasons: same patient referred within six months
(51 referrals), patient under 18 years (eight referrals), cancer within one year prior to current referral (41 referrals),
recurrence of known cancer (15 referrals), questionnaire
rejected and returned by the GP for various reasons, e.g.
retirement of the referring GP (52 referrals). In total, 1732
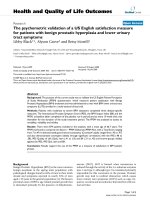
referrals were included in the study (Fig. 2).
Data collection
A pilot-tested paper questionnaire was sent to the GP of
the identified patient no more than two weeks after
inclusion of the patient in the study. This procedure was
followed for all included patients. Non-respondents
received a reminder after three weeks. In general practices with more than one GP, we asked the GP who was
most familiar with the patient to complete the questionnaire. Participating GPs were remunerated for each
completed questionnaire (DKK 121 corresponding to
approx. EUR 16).
The GPs provided information regarding the patient’s
symptoms, known chronic diseases and estimated risk of
cancer at referral in addition to clinical findings, abnormal diagnostic test results and level of the GP’s ‘gut feeling’ (understood as clinical intuition) regarding possible
serious disease. Furthermore, the date of the first symptom presentation to the GP/practice was reported.
Symptoms were defined as presence or absence of 21
specified symptoms at the time of referral, with the option to add other symptoms that were not listed. As far
as possible, all symptoms were classified according to
the International Classification of Primary Care, second
edition (ICPC-2) [27]. Clinical findings were defined as the
GP’s abnormal findings during the clinical examination of
Ingeman et al. BMC Cancer (2015) 15:421
Page 4 of 11
Fig. 2 Referrals and patient inclusion for the NSSC-CPP
the patient. Diagnostic test results were defined as diagnostic tests that were considered abnormal and highly
relevant for the overall pathological picture at the time
of referral. In accordance with Stolper’s work, we define
gut feeling as ‘a physician’s intuitive feeling that something is wrong with the patient, although there are no
apparent clinical indications for this, or a physician’s
intuitive feeling that the strategy used in relation to the
patient is correct, although there is uncertainty about
the diagnosis’ [28].
In line with the Aarhus Statement [13], the primary
care interval was defined as the time from the patient’s
first symptom presentation at the GP/practice until referral to the NSSC-CPP. To ensure accurate data, we used
the registered inclusion date as the referral date, i.e. the
electronically registered date at which the filter function
had been ordered.
Data regarding each patient’s cancer diagnosis were retrieved from the Danish Cancer Registry (DCR) [29–31].
These data were available only for the period until 31
December 2012. Cancer diagnoses made after this date
were retrieved from the National Patient Registry (NPR)
until six months after the date for inclusion of the last
patient. The identification of incident cancers from the
NPR has proven to be reliable as 95 % of the cancer
diagnoses are displayed after four months and with high
validity [32]. The date of diagnosis in the NPR was defined as the first date of the hospital admission at which
the cancer diagnosis was confirmed in the DCR. If the
patient was diagnosed with ICD-10 codes C760–C800
Ingeman et al. BMC Cancer (2015) 15:421
(i.e. malignant neoplasm’s of ill-defined, other secondary
and unspecified sites), we searched and replaced this
code with a more cancer-specific diagnostic code if the
diagnosis had been made no more than two months
after the date at which the cancer incidence had first
been registered.
Data collection regarding referral for further examination at the diagnostic centre at the hospital in Aarhus
did not start until 1 August 2012. Thus, the data collection for the data shown in Table 4 started nearly five
months later than the data collection from the hospital
in Silkeborg.
Statistical analyses
We used chi-square (χ2) test and Wilcoxon rank-sum test
to identify differences between participating and nonparticipating GPs, to examine variations in the primary
care interval between patients with and without cancer
and to calculate the prevalence ratio (PR) in Table 5. The
primary care intervals are presented as medians as well as
75 and 90 percentiles.
Cancer probability is presented as the percentage of
included patients who were diagnosed with a new cancer
within six months after the referral date. Associations
between different patient characteristics and subsequent
cancer diagnosis were estimated with prevalence rate
ratios (PRRs) from a generalised linear model, both unadjusted and adjusted for age and gender, including
95 % confidence intervals (95 % CIs).
The statistical significance level was 0.05 or less. No
alterations were made regarding missing data on presence or no presence of cancer. Stata statistical software
v. 11 was used for the analyses.
Ethics and approval
The study was approved by the Danish Data Protection
Agency (j.no: 2011-41-6118) and the Danish Health and
Medicines Authority (j.no: 7-604-04-2/301). This study
needed no approval from the Danish National Committee
on Health Research Ethics.
Results
Study population
A total of 1278 completed GP questionnaires (73.8 %)
were returned and included in the analyses (Fig. 2). Five
patients were included twice. No significant differences
were found between referrals from participating GPs
and non-participating GPs concerning hospital distribution, gender, age or probability of cancer diagnoses
(Table 1).
Patient characteristics
The mean age of patients included in the analyses was
65.9 years (sd: 14.7, range: 18–99), and 47.5 % were
Page 5 of 11
Table 1 Characteristics of patients referred from participating
GPs and from all included referrals
Variable
Referrals from
participating GPs
All referrals including
non-responders
n = 1278
n = 1732
n
%
N
%
Silkeborg
705
55.2 927
53.5
Aarhus
573
44.8 805
46.5
Female
671
52.5 821
52.6
Male
607
47.5 911
47.7
Hospital
Sex
Age
Mean
65.9 years
66.1
(Range, SD)
(18–98, 14.7)
(18–98, 14.7)
Age groups
18-39 years
70
5.5
40-54 years
179
14.0 234
90
16.1
6.2
55-69 years
441
34.5 481
33.0
70-79 years
345
27.0 368
25.3
≥80 years
243
19.0 282
19.4
Cancer:
Yes
207
16.2 277
16.0
No
1071
83.8 1455
84.0
355
27.8 -
-
Chronic diseases at referral*:
Hypertension
Chronic lung disease
216
16.9 -
-
Diabetes
153
12.0 -
-
Ischaemic heart disease
142
11.1 -
-
Chronic joint or rheumatic
disease
134
10.5 -
-
Light to medium mental
disorder
125
9.8
-
-
Osteoporosis
79
6.2
-
-
Apoplexy
69
5.4
-
-
Moderate to severe mental
disorder
67
5.2
-
-
*Data based on returned questionnaires and therefore exclusively on
participating GPs
men. The most frequent chronic diseases at referral
were hypertension, chronic lung disease and diabetes
(Table 1).
A total of 82 different symptoms and 51 clinical findings
were identified from the GP questionnaires (data not
shown). The median number of symptoms was 3.0. Nonspecific symptoms were the most predominant of all registered symptoms; weight loss and fatigue were both
present in more than half of all referrals (Table 2).
Symptoms associated with the highest probability of
Ingeman et al. BMC Cancer (2015) 15:421
Page 6 of 11
Table 2 Symptoms, abnormal clinical findings and abnormal
diagnostic test results among included patients at referral
Total (n = 1269) Patients with cancer n (%)
Symptoms at referral
Weight loss
671 (52.5 %)
104 (15.5 %)
Fatigue
642 (50.2 %)
102 (15.9 %)
Pain
468 (36.6 %)
86 (18.4 %)
Nausea
352 (27.5 %)
65 (18.5 %)
Malaise
314 (24.7 %)
59 (18.8 %)
Vertigo
174 (13.6 %)
29 (16.7 %)
Change in bowel habits
137 (10.7 %)
24 (17.5 %)
Excessive sweating
128 (10.0 %)
15 (12.5 %)
Cough
114 (8.9 %)
15 (13.2 %)
Lump/tumour
108 (8.5 %)
29 (26.9 %)
No symptom
33 (2.6 %)
7 (21.2 %)
Abnormal clinical
findings at referral
Affected general condition
457 (35.8 %)
80 (17.5 %)
GP’s ‘gut feeling’
287 (22.5 %)
69 (24.0 %)
Abdomen
166 (13.0 %)
35 (21.1 %)
Skin
61 (4.8 %)
12 (19.7 %)
Extremity
56 (4.4 %)
10 (17.9 %)
Lungs
51 (4.0 %)
7 (13.7 %)
Lymph node
44 (3.4 %)
12 (27.3 %)
Weight loss
35 (2.7 %)
3 (8.8 %)
Joints
31 (2.4 %)
3 (9.7 %)
Neurological dysfunction
30 (2.4 %)
8 (26.7 %)
Abnormal diagnostic test results at
referral
Blood sample at GP
619 (48.4 %)
104 (16.8 %)
Blood sample at hospital
253 (19.8 %)
37 (14.6 %)
Diagnostic imaging
192 (15.0 %)
32 (16.7 %)
Urine sample
2 (0.2 %)
1 (50.0 %)
cancer were jaundice (42.9 %), dysphagia (36.7 %), neurological dysfunction (35.3 %) and lump/tumour (26.9 %)
(Table 2).
The three most common clinical findings were affected general condition (35.8 %), the GPs’ gut feeling
(22.5 %) and abdominal findings (13.0 %). The highest
probability of cancer was found for enlarged lymph
nodes (27.3 %), neurological findings (26.7 %), the GPs’
gut feeling (24.0 %) and abdominal findings (21.1 %)
(Table 2).
Abnormal diagnostic test results were primarily related
to blood samples and diagnostic imaging, and no single
diagnostic test result was associated with a particularly
high probability of cancer.
Cancer and primary care interval
After six months, 16.2 % of all patients had a cancer diagnosis. The most common cancer types were lung cancer
(17.9 %), colorectal cancer (12.6 %), hematopoietic tissue
cancer (10.1 %) and pancreatic cancer (9.2 %) (Table 3). In
comparison, the most common cancer types in Denmark
in general for men are prostate cancer, lung cancer, colon
cancer and urinary tract cancer, while the most common
types for women are breast cancer, lung cancer, colon cancer and malignant melanoma.
The median primary care interval for patients diagnosed with cancer was 15 days; the 75 and 90 percentiles
were 72 days and 130 days, respectively. Breast, liver and
biliary cancer patients seemed to have shorter than average primary care intervals, while patients with metastases or cancer of the prostate, hematopoietic tissue,
oesophagus, stomach or small intestine seemed to have
longer primary care intervals than all other patients
(Table 3). However, the study population was too small
to provide any statistical precision for these estimates.
Men generally had a significantly higher probability of
cancer than women when referred (adjusted PRR = 1.32
(95 % CI: 1.03-1.70)) (Table 4).
A more detailed overview of symptoms and clinical
findings found to be highly predictive of cancer is presented in Additional file 1.
Cancer probability in different referral groups
Referred patients with five symptoms had a significantly
higher probability of having cancer than patients referred with only one symptom (adjusted PRR = 1.68
(95 % CI: 1.06-2.65)) (Table 4). The presence of one or
more clinical and/or diagnostic test results implied a significantly higher probability of finding cancer (Table 4).
Patients from Aarhus constituted 44.8 % of the referrals.
These patients had a significantly higher probability of
cancer than the patients referred to the hospital in
Silkeborg (although not in the adjusted analysis) (Table 4).
In total, 59.0 % of the patients from Silkeborg were referred to further examination at the diagnostic centre
compared to 18.8 % of the patients from Aarhus. A
higher probability of cancer was found among patients
who had not been referred to further examination compared to patients who had been referred. However, this
difference was only statistically significant in the group
of patients from Silkeborg (Silkeborg: adjusted PRR =
1.62 (95 % CI: 1.05-2.50); Aarhus: adjusted PRR = 1.22
(95 % CI: 0.62-2.41)).
The number of chronic diseases and the length of the
primary care interval showed no significant associations
with the probability of cancer (Table 4).
A strong association was found between the GP’s assessments of estimated cancer risk at referral and the
probability of finding cancer (Table 4).
Ingeman et al. BMC Cancer (2015) 15:421
Page 7 of 11
Table 3 Diagnosed cancers among patients with serious non-specific cancer symptoms referred from participating GP; primary care
interval shown as median, 75 % and 90 % percentiles
Cancer type
Numbers (% of all cancers)
Median (days)
75 percentile
90 percentile
All cancer patients
207 (100 %)
15
72
130
Lung cancer
37 (17.9 %)
19.5
77.5
127
Colorectal cancer
26 (12.6 %)
11
56
110
Hematopoietic tissue cancer
21 (10.1 %)
19
85
278
Pancreatic cancer
19 (9.2 %)
7
22
51
Oesophagus, stomach and small intestine cancer
17 (8.2 %)
32.5
88
130
Breast cancer
13 (6.3 %)
8
24
35
Liver and biliary system cancer
11 (5.3 %)
7
49
80
Kidney cancer
11 (5.3 %)
35
69
168
Metastasis
11 (5.3 %)
51
100
345
Prostate cancer
10 (4.8 %)
53
131.5
357
Brain cancer
5 (2.4 %)
21
21
52
Cervix, ovarian and uterus cancer
4 (1.9 %)
29
69.5
96
Malignant melanoma
4 (1.9 %)
12.5
79
135
Soft tissue cancer
4 (1.9 %)
36.5
79
99
Unspecified cancer
4 (1.9 %)
123
365
365
Lip, oral and pharynx cancer
2 (1.0 %)
9
9
9
Thyroid cancer
2 (1.0 %)
6
8
8
Other cancers*
6 (2.9 %)
34
74
108
*Ill-defined digestive organ cancer: larynx cancer, chest cavity cancer, sternum cancer and clavicle cancer, penis cancer and testicle cancer
The GPs’ estimations were generally higher than the
actual probability of cancer. The probability of cancer
was higher if the GP had reported ‘strong’ or ‘very strong’
compared to ‘no’ gut feeling. Furthermore, GP gut feeling
showed an association with the four most common clinical findings (weight loss, fatigue, affected general condition and abnormal blood sample) for patients diagnosed
with cancer (Prevalence ratio: 1.50 (95 % CI: 0.82-2.75))
(Table 5).
Discussion
Main findings
NSSC-CPP referred patients were a heterogeneous group
with over 80 different symptoms, 51 different clinical findings and wide variations in number of symptoms per referral. The most frequent symptoms were non-specific
and vague symptoms, which are also very frequent reasons
for consultations in general practice [33]. The term ‘nonspecific symptom’ is used as opposed to specific alarm
symptoms as non-specific symptoms are not necessarily
indicative of a specific cancer type, but may suggest several cancers or other diseases. Only a few symptoms were
highly predictive of cancer; most of these were rare (<2 %
of patients), except for lump/tumour which was present in
almost 9 % of the patients. The GP’s estimation of the patient’s risk of cancer at referral showed an expected correlation with the actual probability of cancer. However, it
should be noted that the GP’s estimated risk was almost
twice the size of the actual probability of cancer.
The overall probability of cancer was 16 %. Cancer was
found more often in men than in women, which might be
explained by the fact that breast cancer often presents
with an alarm symptom [34]. In addition, referred men
tended to have a higher probability of cancer than referred
women [35, 36].
Affected general condition was the most common clinical finding and the GP’s gut feeling was another important clinical finding, which also showed a high probability
of cancer (24.0 %). As seen in Table 4, little influence of
gut feeling was less predictive of cancer than no influence,
which may be because some patients have clear symptoms
where gut feeling has minor importance. Nonetheless, an
association was found between the most common findings
and gut feeling, as shown in Table 5. These findings indicate that more research is needed to further explore the
role of gut feeling in early diagnosis of serious disease.
Our study did not allow identification of the specific components of this gut feeling, but it seems to embrace several
clinical aspects that in combination increase the patient’s
probability of cancer.
The primary care interval for all cancer patients diagnosed in this study was markedly longer than the interval found in previous studies [37, 38]. The long primary
care trajectory before referral underlines the complexity
Ingeman et al. BMC Cancer (2015) 15:421
Page 8 of 11
Table 4 Distribution of referrals, cancer probability, crude PRR and adjusted PRR according to referral characteristics, primary care
interval, GP’s suspicion of cancer and GP’s gut feeling
Referrals (%) Probability of cancer (%) Crude PRR for cancer Adjusted PRR for cancer
(95% CI)
(95% CI)a
All
1278 (100%) 207 (16.2%)
Hospital
Silkeborg
705 (55.2%)
Aarhus
573 (44.8%)
Referral to further examination at diagnostic
centre
Silkeborg Yes 415 (59.0%)
Aarhus
101 (14.3%)
1 (ref)
1 (ref)
106 (18.5%)
1.29 (1.01–1.66)
1.22 (0.95–1.56)
49 (11.8%)
1 (ref)
1 (ref)
No 289 (41.0%)
52 (18.0%)
1.64 (1.05-2.50)
1.62 (1.05-2.50)
Yes 75 (18.8%)
12 (16.0%)
1 (ref)
1 (ref)
No 325 (81.2%)
63 (19.4%)
1.26 (0.64-2.48)
1.22 (0.62-2.41)
671 (52.5%)
95 (14.2%)
1 (ref)
1 (ref)
Sex
Female
Male
607 (47.5%)
112 (18.5%)
1.30 (1.02-1.67)
1.32 (1.03-1.70)
Age group
18-39 years
70 (5.5%)
3 (4.3%)
0.96 (0.26-3.51)
0.95 (0.26-3.49)
40-54 years
179 (14.0%)
8 (4.5%)
1 (ref)
1 (ref)
55-69 years
441 (34.5%)
80 (18.1%)
4.06 (2.00-8.22)
4.01 (1.98-8.12)
70-79 years
345 (27.0%)
73 (21.2%)
4.73 (2.33-9.60)
4.76 (2.35-9.64)
≥ 80 years
243 (19.0%)
43 (17.7%)
3.96 (1.91-8.21)
3.31 (1.90-8.15)
No
1134 (88.7%) 186 (16.4%)
1 (ref)
1 (ref)
0.80 (0.52-2.20)
Patients with previous cancer
Yes
144 (11.3%)
21 (14.6%)
0.89 (0.59-1.35)
Symptoms at referral
0
23 (1.8%)
6 (26.1%)
1.96 (0.92-4.15)
1.88 (0.89-3.95)
(n=1254)
1
240 (19.0%)
32 (13.3%)
1 (ref)
1 (ref)
2
276 (21.9%)
31 (11.2%)
0.84 (0.53-1.34)
0.82 (0.52-1.29)
3
278 (22.0%)
47 (16.9%)
1.27 (0.84-1.92)
1.26 (0.84-1.91)
4
206 (16.3%)
38 (18.5%)
1.38 (0.90-2.13)
1.38 (0.90-2.12)
5
118 (9.3%)
27 (22.9%)
1.72 (1.08-2.72)
1.68 (1.06-2.65)
≥6
122 (9.7%)
28 (18.9%)
1.41 (0.87-2.30)
1.35 (0.83-2.18)
0
147 (3.3%)
9 (6.1%)
1 (ref)
1 (ref)
Clinical findings at referral
1
580 (52.4%)
80 (13.8%)
2.25 (1.16-4.82)
1.98 (1.02-3.84)
(n=1100)
2
297 (26.9%)
67 (22.6%)
3.68 (1.89-7.18)
3.04 (1.56-5.92)
≥3
82 (7.4%)
19 (23.2%)
3.78 (1.80-7.98)
3.25 (1.55-6.81)
Diagnostic test results at referral
0
187 (17.1%)
13 (7.0%)
1 (ref)
1 (ref)
1
565 (51.7%)
98 (17.4%)
2.50 (1.34-4.34)
2.16 (1.24-3.77)
(n=1086)
Number of chronic diseases at referral
(n=1199)
2
267 (24.4%)
41 (16.4%)
2.21 (1.22-4.01)
1.95 (1.07-3.53)
≥3
75 (6.9%)
13 (17.3%)
2.49 (1.21-5.13)
2.28 (1.11-4.66)
0
295 (24.5%)
50 (17.0%)
1 (ref)
1 (ref)
1
403 (33.5%)
62 (15.4%)
0.91 (0.65-1-28)
0.73 (0.52-1.02)
2
286 (23.5%)
48 (16.8%)
0.99 (0.69-1.42)
0.71 (0.49-1.02)
≥3
220 (18.2%)
34 (15.5%)
0.91 (0.61-1.36)
0.63 (0.42-0.95)
Primary care intervalb
<1 month
723 (56.6%)
117 (16.2%)
1 (ref)
1 (ref)
(n=1131)
1-2 months
156 (12.2%)
20 (12.8%)
0.79 (0.51-1.23)
0.81 (0.52-1.26)
2-3 months
79 (6.2%)
16 (20.3%)
1.25 (0.78-2.00)
1.31 (0.82-2.07)
3-4 months
52 (4.1%)
12 (23.1%)
1.43 (0.85-2.41)
1.42 (0.85-2.39)
4-5 months
29 (2.3%)
6 (20.7%)
1.28 (0.62-2.66)
1.36 (0.67-2.76)
5-6 months
17 (1.3%)
3 (17.7%)
1.10 (0.39-3.09)
1.26 (0.47-3.39)
>6 months
222 (17.3%)
33 (14.9%)
0.92 (0.64-1.31)
0.90 (0.64-1.29)
Ingeman et al. BMC Cancer (2015) 15:421
Page 9 of 11
Table 4 Distribution of referrals, cancer probability, crude PRR and adjusted PRR according to referral characteristics, primary care
interval, GP’s suspicion of cancer and GP’s gut feeling (Continued)
GP’s estimation of patient’s risk of cancer at
referral
(n=1208)
Did gut feeling influence the decision of
referral?
(n=1168)
0-20%
448 (36.8%)
36 (8.0%)
1 (ref)
1 (ref)
21-40%
195 (16.0%)
24 (12.3%)
1.53 (0.94-2.50)
1.43 (0.88-2.33)
41-60%
314 (25.8%)
47 (15.0%)
1.86 (1.24-2.81)
1.69 (1.12-2.56)
61-80%
155 (12.6%)
41 (26.5%)
3.29 (2.19-4.95)
2.96 (1.96-4.48)
81-100%
104 (8.6%)
52 (50.0%)
6.22 (4.31-8.99)
5.30 (3.62-7.76)
No
287 (24.6%)
46 (16.0%)
1 (ref)
1 (ref)
A little
224 (19.2%)
25 (11.2%)
0.66 (0.39-1.11)
0.65 (0.38-1.10)
Some
425 (36.4%)
63 (14.8%)
0.91 (0.60-1.38)
0.86 (0.56-1.31)
Much
182 (15.6%)
43 (23.6%)
1.62 (1.02-2.58)
1.55 (0.97-2.48)
Very much
50 (4.3%)
17 (34.0%)
2.70 (1.39-5.25)
2.57 (1.31-5.05)
a
Adjusted for age and gender
GP: General Practitioner
b
Medians are used to categorise the groups
PRR: Prevalence Rate Ratio
of diagnosing these patients, but also stresses the need
for quick and easy access to diagnostic investigations
[39], including earlier referral by the GP despite nonspecific symptoms.
The higher probability of cancer among patients not referred to further examination at a diagnostic centre may
be explained by the separation of patients with specific
cancer findings through the filter function; these patients
are referred to specific CPPs or other pathways and not to
the diagnostic centre. This indicates that the filter function
prior to the referral to the diagnostic centre is useful.
However, some patients who were terminated by the GP
without further examination (watchful waiting) may actually have had a cancer or another serious disease. The
present study did not gain insight into this issue, and further research in this area is needed.
The lower percentage (18.8 %) of referrals from the hospital in Aarhus to further examination at the diagnostic
centre might partly be explained by the use of an initial CT
scan, which may be more effective as a diagnostic instrument and thus may reduce the need for referral to further
diagnostic workup. However, it could also be false assurance as no difference was found in the proportions of cancer between non-referred patients and patients referred to
Table 5 Association between GP gut feeling and the four most
common findings in cancer patients
Four most common findings*
GPs’ gut feeling
At least one
None
Total
Yes
60
9
169
No
109
29
138
Total
169
38
207
Prevalence ratio: 1.50 (95 % CI: 0.82-2.75)
*Weight loss and fatigue (two most common symptoms), affected general
condition (most common clinical finding) and abnormal blood sample at GP
(most common abnormal diagnostic test result)
the diagnostic centre in Aarhus. Furthermore, the NSSCCPP at the hospital in Silkeborg had been implemented
several years before the NSSC-CPP in Aarhus. This difference may also have affected the number of GPs who chose
to refer to the diagnostic centre.
Strengths and weaknesses of the study
A major strength of this study is the prospective design,
which allowed us to include all patients referred to the
NSSC-CPP and not only already diagnosed cancer patients. Although we included patients prospectively, the
questionnaires were sent out retrospectively, and this
may have introduced recall bias. To minimise recall bias,
we posted our questionnaire to the GP no more than
two weeks after inclusion of the patient, and the diagnostic workup for many patients had not been finished
by the time the GP received the questionnaire. This also
minimized possible information bias as the GPs did not
know the results of the referral for many of the patients.
To further minimize recall bias, we encouraged the GPs
to consult their electronic medical records when filling
in the questionnaire. Nevertheless, recall bias might be
more pronounced for patients referred through a hospital department as the GPs referred the patients to a
hospital department before the patients were referred to
the NSSC-CPP by the hospital. Further data on this potential recall bias were not available. Lack of complete
information in some questionnaires might have introduced information bias, but this is unlikely to have influenced the estimated probability of cancer or the reported
clinical findings.
The register data are considered precise and valid as
the cancer information in the DCR was registered prospectively. The DCR has an almost complete registration
of all Danish cancer data and has been shown to be accurate [29]. We used the NPR to identify cancer patients
Ingeman et al. BMC Cancer (2015) 15:421
diagnosed in 2013, and this method of identifying cancer
patients has been reported to have an accuracy of 95 %
after four months [32]. The introduced misclassification
is considered to be non-differential.
The GP response rate is comparable to similar studies
using GP questionnaires [34, 37] and must be considered
high, which limits potential selection bias. Still, nonresponding GPs may have had patients with special characteristics although a non-response analysis revealed no
differences between patients of participating GPs and
patients of non-participating GPs.
Although ’gut feeling’ is a well-known and common
phenomenon among GPs [28], this notion may have introduced a problem regarding the construct validity as it
is uncertain whether GPs regard ‘gut feeling’ in the same
way. Furthermore, ‘gut feeling’ can be difficult to separate
from e.g. the GP’s estimation of the patient’s risk of cancer in this study design. The association between gut
feeling and the four most common findings indicates
that gut feeling is often seen in combination with other
findings. Further sub analysis showed that no symptoms,
clinical findings or abnormal diagnostic test results were
stated in the medical records for only 11 of the patients;
none of these patients were registered with a GP gut
feeling. Furthermore, the fact that the probability of cancer
appeared higher with no gut feeling (compared to little
gut feeling) indicates that presence of clear signs of cancer
does not generally prompt activation of gut feeling. Our
results warrant further studies into the importance of ‘gut
feeling’ in early detection of cancer.
Comparison with other studies
Bosch et al. [40] published a paper on referrals from GPs
to a quick diagnostic unit (QDU) similar to the one described in this paper, but their aim was different from
ours. The study showed that 30 % of the patients referred directly to the QDU had cancer compared to the
16 % found in our study. Data from the UK have shown
that 11 % of the patients referred to the ordinary urgent
referral pathways were diagnosed with cancer [22]. Apart
from the study by Bosch et al. [40], we are unaware of
any published studies examining and quantifying GP referrals to NSSC-CPPs and related outcomes.
An earlier study confirmed that action should be
taken when the GP suspects serious disease as these patients have a high risk of a new diagnosis of cancer or another serious disease within 2 months [41]. Furthermore,
Hamilton has also highlighted the importance of the GP’s
suspicion [6]. Our study adds to this evidence within
primary care diagnostics.
Jensen et al. [21] documented that only 40 % of the
Danish cancer patients were referred to a ‘cancer specific’
CPP. This finding stresses the importance of providing the
Page 10 of 11
GPs with diagnostic tools like the NSSC-CPP as well as
direct access to diagnostic investigations [39, 42, 43].
Conclusions
This study documents that 16.2 % of all patients referred
through the Danish NSSC-CPP because of non-specific
serious symptoms had cancer. Patients referred to the
NSSC-CPP were a heterogeneous group with many different symptoms and clinical findings. The GP’s gut feeling was a common clinical finding which was a strong
predictor of cancer. Likewise, the GP’s assessment of the
patient’s risk of cancer at referral was also strongly associated with the actual probability of finding cancer.
Additional file
Below is the link to the electronic supplementary material.
Additional file 1: Symptoms and abnormal clinical findings highly
predictive of cancer.
Competing interests
The authors declare that they have no competing interests.
Authors’ contributions
MLI participated in the design of the study, drafted the GP questionnaire,
performed the data analysis and drafted the manuscript. PV conceived the
study, contributed to the drafting of the GP questionnaire, the data analysis
and the interpretation of results as well as the revision of the manuscript.
MBC and FB contributed to the design of the study, the GP questionnaire
and the revision of the manuscript. STK contributed to the design of the
study, the data collection at the hospital in Aarhus and the revision of the
manuscript. All authors read and approved the final manuscript.
Acknowledgements
We thank the contributing GPs for their time and effort with completing the
questionnaire. We also thank the personnel at the hospitals in Aarhus and
Silkeborg for providing the data used to include the relevant patients for this
study. Data manager Kaare Rud Flarup is also acknowledged for his substantial
assistance with the data retrieval from the Danish national registries.
The project was supported by the Committee for Quality Improvement and
Continuing Medical Education (KEU) of the Central Denmark Region, the
Danish Cancer Society and the Novo Nordisk Foundation. Sponsoring
organizations were not involved in any part of the study.
Author details
1
Research Unit for General Practice, Aarhus University, Aarhus, Denmark.
2
Research Centre for Cancer Diagnosis in Primary Care (CaP), Aarhus
University, Aarhus, Denmark. 3Department of Public Health, Section for
General Medical Practice, Aarhus University, Aarhus, Denmark. 4Department
of Endocrinology and Internal Medicine (MEA), Aarhus University Hospital,
Noerrebrogade, Aarhus, Denmark.
Received: 16 December 2014 Accepted: 6 May 2015
References
1. Helweg-Larsen K. The Danish register of causes of death. Scand J Public
Health. 2011;39(7):26–9.
2. Coleman MP, Forman D, Bryant H, Butler J, Rachet B, Maringe C, et al.
Cancer survival in Australia, Canada, Denmark, Norway, Sweden, and the UK,
1995–2007 (the International Cancer Benchmarking Partnership): an analysis
of population-based cancer registry data. Lancet. 2011;377(9760):127–38.
3. De Angelis R, Sant M, Coleman MP, Francisci S, Baili P, Pierannunzio D, et al.
Cancer survival in Europe 1999–2007 by country and age: results of
EUROCARE-5-a population-based stud. Lancet Oncol. 2014;15(1):23–34.
Ingeman et al. BMC Cancer (2015) 15:421
4.
5.
6.
7.
8.
9.
10.
11.
12.
13.
14.
15.
16.
17.
18.
19.
20.
21.
22.
23.
24.
25.
26.
27.
28.
29.
30.
Torring ML, Frydenberg M, Hansen RP, Olesen F, Vedsted P. Evidence of
increasing mortality with longer diagnostic intervals for five common
cancers: A cohort study in primary care. Eur J Cancer. 2013;49(9):2187–98.
Torring ML, Frydenberg M, Hamilton W, Hansen RP, Lautrup MD, Vedsted P.
Diagnostic interval and mortality in colorectal cancer: U-shaped association
demonstrated for three different datasets. J Clin Epidemiol. 2012;65(6):669–78.
Hamilton W. Five misconceptions in cancer diagnosis. Br J Gen Pract.
2009;59(563):441–5. 447; discussion 446.
Starfield B. Is primary care essential? Lancet. 1994;344:1129–33.
Nielsen TN, Hansen RP, Vedsted P. Symptom presentation in cancer patients
in general practice. Ugeskr Laeger. 2010;172(41):2827–31.
Hansen RP. Delay in the diagnosis of cancer PhD thesis. Aarhus: Faculty of
Health Sciences, University of Aarhus; 2008.
Allgar VL, Neal RD. General practictioners’ management of cancer in
England: secondary analysis of data from the National Survey of NHS
Patients-Cancer. Eur J Cancer Care (Engl). 2005;14(5):409–16.
Christensen KG, Fenger-Gron M, Flarup KR, Vedsted P. Use of general practice,
diagnostic investigations and hospital services before and after cancer
diagnosis-a population-based nationwide registry study of 127,000 incident
adult cancer patients. BMC Health Serv Res. 2012;12(1):224.
Olesen F, Hansen RP, Vedsted P. Delay in diagnosis: the experience in
Denmark. Br J Cancer. 2009;101:S5–8.
Weller D, Vedsted P, Rubin G, Walter FM, Emery J, Scott S, et al. The Aarhus
statement: improving design and reporting of studies on early cancer
diagnosis. Br J Cancer. 2012;106(7):126210–1267.
The National Board oH. National Cancer Plan II Denmark National Board of
Health recommendations for improving cancer healthcare services.
Copenhagen: The National Board of Health; 2005.
Department oH. The NHS Cancer Plan. A plan for investment, A plan for
reform. London: Department of Health; 2000.
Probst HB, Hussain ZB, Andersen O. Cancer patient pathways in Denmark as
a joint effort between bureaucrats, health professionals and politicians-A
national Danish project. Health Policy. 2012;105(1):65–70.
Mulka O. NICE suspected cancer guidelines. Br J Gen Pract.
2005;55(517):580–1.
Probst HB, Hussain ZB, Andersen O. Cancer patient pathways in Denmark as
a joint effort between bureaucrats, health professionals and politicians-A
national Danish project. Health Policy. 2012;105(1):65–70.
Jones R, Rubin G, Hungin P. Is the two week rule for cancer referrals
working? BMJ. 2001;322(7302):1555–6.
Neal RD, Din NU, Hamilton W, Ukoumunne OC, Carter B, Stapley S, et al.
Comparison of cancer diagnostic intervals before and after implementation
of NICE guidelines: analysis of data from the UK General Practice Research
Database. Br J Cancer. 2014;110(3):584–92.
Jensen H, Torring ML, Olesen F, Overgaard J, Vedsted P. Cancer suspicion in
general practice, urgent referral and time to diagnosis: a population-based
GP survey and registry study. BMC Cancer. 2014;14(1):636–2407. 14-636.
Meechan D, Gildea C, Hollingworth L, Richards MA, Riley D, Rubin G.
Variation in use of the 2-week referral pathway for suspected cancer: A
cross-sectional analysis. Br J Gen Pract. 2012;62(602):590–7.
Vedsted P, Olesen F. A differentiated approach to referrals from general
practice to support early cancer diagnosis - the Danish three-legged strategy.
Br J Cancer. 2015;112(Suppl):S65–9.
Hamilton W. The CAPER studies: five case–control studies aimed at
identifying and quantifying the risk of cancer in symptomatic primary care
patients. Br J Cancer. 2009;101 Suppl 2:S80–6. S80-S86.
Pedersen KM, Andersen JS, Sondergaard J. General practice and primary
health care in Denmark. J Am Board Fam Med. 2012;25 Suppl 1:S34–8.
Pedersen CB. The Danish Civil Registration System. Scand J Public Health.
2011;39(7):22–5.
Soler JK, Okkes I, Wood M, Lamberts H. The coming of age of ICPC:
celebrating the 21st birthday of the International Classification of Primary
Care. Fam Pract. 2008;25(4):312–7.
Stolper E, Van RP, Dinant GJ. The ‘sense of alarm’ (‘gut feeling’) in clinical
practice. A survey among European general practitioners on recognition
and expression. Eur J Gen Pract. 2010;16(2):72–4.
Gjerstorff ML. The Danish Cancer Registry. Scand J Public Health.
2011;39(7):42–5.
Storm HH, Michelsen EV, Clemmensen IH, Pihl J. The Danish Cancer
Registry-history, content, quality and use. Dan Med Bull. 1997;44:535–9.
Page 11 of 11
31. Danish National Board of Health. The Cancer Registry 2009 in Danish. 2010.
p. 1–55.
32. Larsen MB, Jensen H, Hansen RP, Olesen F, Vedsted P. Identification of
patients with incident cancers using administrative registry data. Dan Med J.
2014;61(2):A4777.
33. Moth G, Vedsted P, Olesen F. Kontakt- og sygdomsmønsteret i almen praksis.
KOS 2008. Aarhus: Forskningsenheden for Almen Praksis i Aarhus, Aarhus
Universitet; 2010.
34. Jensen H, Torring ML, Larsen MB, Vedsted P. Existing data sources for
clinical epidemiology: Danish Cancer in Primary Care cohort. Clin Epidemiol.
2014;6:237–46.
35. Cook MB, Dawsey SM, Freedman ND, Inskip PD, Wichner SM, Quraishi SM,
et al. Sex disparities in cancer incidence by period and age. Cancer
Epidemiol Biomarkers Prev. 2009;18(4):1174–82.
36. Edgren G, Liang L, Adami HO, Chang ET. Enigmatic sex disparities in cancer
incidence. Eur J Epidemiol. 2012;27(3):187–96.
37. Hansen RP, Vedsted P, Sokolowski I, Sondergaard J, Olesen F. Time intervals
from first symptom to treatment of cancer: a cohort study of 2,212 newly
diagnosed cancer patients. BMC Health Serv Res. 2011;11(1):284.
38. Lyratzopoulos G, Abel GA, McPhail S, Neal RD, Rubin GP. Measures of
promptness of cancer diagnosis in primary care: secondary analysis of
national audit data on patients with 18 common and rarer cancers. Br J
Cancer. 2013;108(3):686–90.
39. Guldbrandt LM, Fenger-Gron M, Folkersen BH, Rasmussen TR, Vedsted P.
Reduced specialist time with direct computed tomography for suspected
lung cancer in primary care. Dan Med J. 2013;60(12):A4738.
40. Bosch X, Escoda O, Nicolas D, Coloma E, Fernandez S, Coca A, et al. Primary
care referrals of patients with potentially serious diseases to the emergency
department or a quick diagnosis unit: a cross-sectional retrospective study.
BMC Fam Pract. 2014;15(1):75.
41. Hjertholm P, Moth G, Ingeman ML, Vedsted P. Predictive values of GPs’
suspicion of serious disease: a population-based follow-up study. Br J Gen
Pract. 2014;64(623):e346–53.
42. Rubin G, Vedsted P, Emery J. Improving cancer outcomes: Better access to
diagnostics in primary care could be critical. 2011. p. 317–8.
43. Baughan P, Keatings J, O’Neill B. Urgent suspected cancer referrals from
general practice: audit of compliance with guidelines and referral outcomes.
Br J Gen Pract. 2011;61(592):700–6.
Submit your next manuscript to BioMed Central
and take full advantage of:
• Convenient online submission
• Thorough peer review
• No space constraints or color figure charges
• Immediate publication on acceptance
• Inclusion in PubMed, CAS, Scopus and Google Scholar
• Research which is freely available for redistribution
Submit your manuscript at
www.biomedcentral.com/submit