A microRNA molecular modeling extension for prediction of colorectal cancer treatment
Bạn đang xem bản rút gọn của tài liệu. Xem và tải ngay bản đầy đủ của tài liệu tại đây (2.69 MB, 12 trang )
Li and Mansmann BMC Cancer (2015) 15:472
DOI 10.1186/s12885-015-1437-0
RESEARCH ARTICLE
Open Access
A microRNA molecular modeling extension
for prediction of colorectal cancer treatment
Jian Li1,2,3* and Ulrich R. Mansmann1,2
Abstract
Background: Several studies show that the regulatory impact of microRNAs (miRNAs) is an essential contribution
to the pathogenesis of colorectal cancer (CRC). The expression levels of diverse miRNAs are associated with specific
clinical diagnoses and prognoses of CRC. However, this association reveals very little actionable information with
regard to how or whether to treat a CRC patient. To address this problem, we use miRNA expression data along
with other molecular information to predict individual response of CRC cell lines and CRC patients.
Methods: A strategy has been developed to join four types of information: molecular, kinetic, genetic and treatment
data for prediction of individual treatment response of CRC.
Results: Information on miRNA regulation, including miRNA target regulation and transcriptional regulation of miRNA,
in integrated into an in silico molecular model for colon cancer. This molecular model is applied to study responses of
seven CRC cell lines from NCI-60 to ten agents targeting signaling pathways. Predictive results of models without and
with implemented miRNA information are compared and advantages are shown for the extended model. Finally, the
extended model was applied to the data of 22 CRC patients to predict response to treatments of sirolimus and
LY294002. The in silico results can also replicate the oncogenic and tumor suppression roles of miRNA on the
therapeutic response as reported in the literature.
Conclusions: In summary, the results reveal that detailed molecular events can be combined with individual
genetic data, including gene/miRNA expression data, to enhance in silico prediction of therapeutic response of
individual CRC tumors. The study demonstrates that miRNA information can be applied as actionable information
regarding individual therapeutic response.
Keywords: MicroRNA regulation, Signaling pathway, Individualized medicine, Colorectal cancer
Background
With an average of 610,000 deaths per year, CRC has
become the second most common cause of cancer death
on a global scale. Because it is most commonly diagnosed
at advanced stages, approximately 50 % of patients diagnosed with CRC will surrender to the disease [1]. From a
molecular perspective, CRC is characterized by the accumulation of genetic alterations affecting the cellular functionalities of oncogenes and tumor suppressor genes,
leading to genomic instability and cellular dysfunction [2].
A number of deregulated signaling pathways, most notably
Wnt [3], Notch [4], Hedgehog [5] and others [6, 7], have
* Correspondence:
1
Institute for Medical Informatics, Biometry and Epidemiology,
Ludwig-Maximilians-University München, Munich, Germany
2
German Cancer Consortium (DKTK), Heidelberg, Germany
Full list of author information is available at the end of the article
been identified as maintaining the malignant cellular
growth and cancerous functional integration of CRC. The
signaling network based on these deregulated pathways
steers the oncogenetic development. Furthermore, miRNAs are deeply involved in the pathogenesis of CRC by
affecting key components of those signaling pathways.
They play significant roles in regulating cell growth,
proliferation, invasion and metastasis in CRC [8–14].
Moreover, recent studies have demonstrated that
miRNAs detected in blood serum, plasma and even in
stool offer novel non-invasive approaches to diagnose
CRC [13, 15–17]. Other recent studies revealed experimentally that expression levels of certain miRNAs were
associated with specific prognosis and therapeutic
outcomes in CRC, which provides compelling evidence
that miRNAs have the potential to be prognostic and predictive biomarkers [18–21]. Further, detailed molecular
© 2015 Li and Mansmann. This is an Open Access article distributed under the terms of the Creative Commons Attribution
License ( which permits unrestricted use, distribution, and reproduction in any
medium, provided the original work is properly credited. The Creative Commons Public Domain Dedication waiver (http://
creativecommons.org/publicdomain/zero/1.0/) applies to the data made available in this article, unless otherwise stated.
Li and Mansmann BMC Cancer (2015) 15:472
information related to miRNA function in clinical application was reported in the study of Melo & Kalluri [22]. Our
study introduces an in silico model for the colorectal cancer cell which implements miRNA information and
explores its potential for improved response prediction to
specific treatment.
Methods
Colorectal Cancer Patients
The gene-expression and miRNA-expression data of the
22 CRC patients examined in this study can be downloaded from which is
provided by the Cancer Genome Atlas, with the following
filter setting configuration: Select a disease → COAD- Colon
adenocarchinoma; Data type → RNASeqV2/miRNASeq;
Center/Platform → All; Batch number → All; Sample →
Patient ID; Data level → Level 3; Availability → None.
Each dataset was produced through the analysis of
high-quality colon tumor samples from the participants. Each dataset was normalized using the trimmed
mean of M-values normalization method proposed by
Robinson & Oshlack [23], to remove systematic technical effects and minimize the sequencing technical
bias on the data.
Page 2 of 12
(PubMed) as value); for example, miRT
[ENSG00000236342] = (mir-1238, 17964270).
2. Convert the TransmiR data into a data array (TFmiR)
(with miR-ID as key; Ensembl-ID, transcriptional
regulation, references (PubMed) as value); for
example, TFmiR[mir-223] = (ENSG00000159216,
repression, 17996649).
3. Divide the NSAID model (XML file of NSAID) into
different data arrays according to component type
(such as gene array, mRNA array, protein array,
reaction array, etc.)
4. Iterate all the gene components in the gene array;
when a gene with Ensembl-ID matches a key of
miRT, then the corresponding miRNA is created in
the model by defining name, ID, location and other.
Afterwards, the TFmiR is applied to identify the
transcriptional factors that regulate the expression
level of this miRNA. The corresponding type of
transcription reaction is defined to link the miRNA
gene with the miRNA. Afterwards, the miRNA is
translocated into cytoplasm and modeling of its
regulation on the corresponding mRNA is created
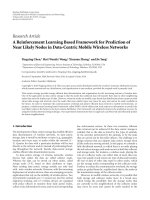
and added into the model (Fig. 1). (The detailed
molecular modeling is explained in the study of Li
et al. [28].)
The Genomic Data of CRC Cancer Cell Lines from NCI-60
The CRC cancer cell lines examined in this study are
COLO-205, HCC-2998, HCT-116, HCT-15, HT29, KM12,
SW-620. The gene-expression data of these cancer cell
lines can be downloaded via [24]. The miRNA-expression
data can be accessed via [25].
Model Initialization with miRNA and Gene Expression Data
Our previous study [26] introduced the in silico NSAID
model, which incorporates information of 20 diverse
CRC-relevant signaling pathways, such as Wnt, Notch,
BMP, beta-catenin and Hedgehog, and other molecular
features. The model contains different types of biological
components such as genes, RNAs, proteins and complexes. Components of the network are used to quantify
specific aspects of tumorigeneity in terms of the cancer
hallmarks [27]. The study demonstrated application for
two therapeutic developmental strategies: synthetic lethality and miRNA biomarker discovery.
The initial value of all components in the model is zero.
The miRNA- and gene-expression data is available
through the link from the Cancer Genome Atlas (as
mentioned in the paragraph “Colorectal Cancer
Patients”) or from the cell line data. These datasets are
converted into a data array (similarly to the method explained above). The keys of this data array are the
miRNA-IDs and Ensembl-IDs as well as the expression
values. Afterwards, the expression levels of miRNA
genes and normal genes in the model are set to the
values as given by the miRNA-ID and Ensembl-ID.
During Petri net simulation, signal fluxes of reactions
are simulated in the model by transcription reactions
and are expanded to the rest of the model by other
reactions defined in the model. This data initialization
is the input for the Flux Comparative Analysis
explained in the following.
Molecular Addition of miRNA-Regulation (miRAO)
Mathematical Implementation of Sirolimus and LY294002
The algorithmic basis for our study is the NSAID model
introduced by Li & Mansmann [26]. The following steps
implement miRNA regulations:
We study the effect of sirolimus as a specific mTor
inhibitor. According to Nashan [29], its dissociation constant is 0.65 nM indicating an inhibition of biochemical
reactions catalyzed by the mTor protein complex.
LY294002 is a potent inhibitor of PI3K, which catalyzes
the conversion from PIP2 to PIP3. The dissociation constant of LY294002 is 210 nM [30]. Table 1 contains the
The Non-Steroidal Anti-Inflammatory Drug (NSAID) Model
1. Convert miRNA-target data into a data array (miRT)
(with Ensembl-ID as key; miRNA-ID and references
Li and Mansmann BMC Cancer (2015) 15:472
Page 3 of 12
Fig. 1 The conceptual visualization of miR-add-on algorithm. The step (1) simplifies two biological processes: (a) the transcription catalyzed by
transcriptional activator or repressor (if available); (b) the primary transcript (pri-miRNA) is cropped into a hairpin intermediate (pre-miRNA) by the
nuclear 650 kDa microprocess complex, which consists of humans of the RNase III DROSHA (RNASEN) and the DiGeorge syndrome critical region
gene 8 (DGCR8) . The step (2) defines a transport reaction to translocate the miRNA into cytoplasm so that it is ready for the following target
binding process. The step (3) is a degradation process. The step (4) simplifies two processes: (a) mature miRNA binds to different protein partners
and turns into the RNA-induced silencing complex (RISC); (b) RISC recognizes the target mRNA and binds to it. The steps (5), (6) and (7) are
transcription, translation and degradation of target gene, mRNA and protein, respectively
molecular modeling of both drugs and the corresponding control state (without treatment).
Flux Comparative Analysis (FCA)
The FCA is an advanced Petri net simulation strategy.
As the name suggests, it is an analysis of flux comparison
of two different states of a molecular model. The goal of
FCA analysis is to detect whether a therapeutic intervention (drug treatment) can cause a significant flux change
with regard to the structure of an entire molecular network, in order to predict how an individual would
respond to a therapeutic intervention [26]. Essentially,
Li and Mansmann BMC Cancer (2015) 15:472
Page 4 of 12
Table 1 'E': enzyme; 'I': Inhibitor. Currently, we have only applied the mass action law for implementing biochemical reaction
Sirolimus treatment
CRC patient + sirolimus
CRC patient
Molecular modeling
mTor complex II (E); Sirolimus (I)
mTor complex II (E)
PRKCG + ATP → → → P-PRKCG + ADP
PRKCG + ATP → → → P-PRKCG + ADP
mTor complex II (E); Sirolimus (I)
mTor complex II (E)
SGK + ATP → → → P-SGK + ADP
SGK + ATP → → → P-SGK + ADP
mTor complex II (E); Sirolimus (I)
mTor complex II (E)
PRKCA + ATP → → → P-PRKCA + ADP
PRKCA + ATP → → → P-PRKCA + ADP
mTor complex II (E); Sirolimus (I)
mTor complex II (E)
AKT + ATP → → → P-AKT + ADP
AKT + ATP → → → P-AKT + ADP
mTor complex II (E); Sirolimus (I)
mTor complex II (E)
HIF1A + ATP → → → P-HIF1A + ADP
HIF1A + ATP → → → P-HIF1A + ADP
mTor complex II (E); Sirolimus (I)
mTor complex II (E)
PPARGC1 + ATP → →P-PPARGC1 + ADP
PPARGC1 + ATP → P-PPARGC1 + ADP
mTor complex II (E); Sirolimus (I)
mTor complex II (E)
EIF4EBP + ATP → → P-EIF4EBP + ADP
EIF4EBP + ATP → →P-EIF4EBP + ADP
mTor complex II (E); Sirolimus (I)
mTor complex II (E)
PPARG + ATP → → P-PPARG + ADP
PPARG + ATP → → P-PPARG + ADP
LY294002 treatment
CRC patient + LY294002
CRC patient
Molecular modeling
Enzymes; LY294002 (I)
Enzymes
PIP2 + ATP → → → PIP3 + ADP
PIP2 + ATP → → → PIP3 + ADP
For instance, the substance A and B participate in a reaction catalyzed by an enzyme and inhibitor to produce the products C and D: enzyme; inhibitor
A+B→→→C+D
where the mathematical implementation: [C] = [D] = [A] * [B] * [enzyme] * [iKd] / [inhibitor] * [eKd], eKd: enzymatic dissociation constant; iKd: inhibitor
dissociation constant
during FCA, two states are generated for each cell line/
patient for each treatment: one is the control state
(without treatment) and the other is the perturbation
state (with treatment). During the Petri net simulation,
the fluxes generated for each state in the model are
compared for each patient. The following simulation
algorithm code is applied to generate the steady state of
each state:
Ri = the i-th reaction in the molecular model; Parameters
of Ri include speed (S), kinetic parameter (k), product
(p), reactant (a), enzyme (e)
Cj,t = the concentration of the j-th bio-object (such as
gene, protein) in the model at time step t
St = Ca,t * Ce,t * k
N, M = the number of reactions and bio-objects in the
model, respectively.
1. Input: Gene-expression data and miRNA-expression
data
2. For each j (from 1 to M) at time step t:
3. if Cj,t – Cj,t-5 > 0.001:
4. then reachSteadyState = False
5. If not reachSteadyState:
6. for each i (from 1 to N) at time step t:
7. if Cp,t-1 < Ca,t-1 & St < Ca,t-1 * 0.75:
8. then evaluate Ri as Petri net firing rule at t:
9. Cp,t = Cp,t-1 + St
10. Ca,t = Ca,t-1 - St
11. If reachSteadyState:
12. select the readout components
13. Output: compare readout components between two
states (Control vs. Treatment)
Definition of Sensitivity Score for Drug Response
Experimentally based sensitivity score (experimental
data) = GI50
(GI50: the -log mol/L drug/concentration yielding a
growth inhibition of 50 %, [31])
Model-based sensitivity score (prediction data) =
log(P) + K
(P: relative change value of readout component
'proliferation' hallmark in the treatment state compared to that in the control state. In this case, the
hallmark 'proliferation' is selected as the readout
component for the FCA analysis; K: constant value,
currently estimated as 5.2. the hallmark "proliferation", as a mirror of proliferative ability, is taken as
the primary outcome, since the cell line models
Li and Mansmann BMC Cancer (2015) 15:472
quantify response on treatment by its impact on cellular growth)
Correlation Between Experimentally Measured and
Computationally Simulated Scores
It is of interest to calculate the Pearson correlation
between observed and predicted response of cell lines
under a specific treatment. Aggregating correlation over
all treatments was calculated following the principles of
Bland and Altman as presented in [32].
The Availability of the Model
The XML file of the NSAID-miR model is available
under [33].
Results
A strategy for prediction of individual treatment response
is proposed which is based on an in silico environment in
which the molecular regulation effect of miRNAs combined with other molecular information can be utilized. A
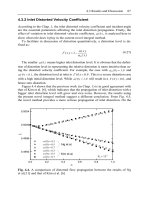
flowchart depicts the work-flow of this concept (Fig. 2).
There are four major sources of input information: molecular, kinetic, individual genetic (miRNA/mRNA expression data) and treatment data.
The microRNA Extension for the Non-Steroidal
Anti-Inflammatory Drug (NSAID) Model
The NSAID model depicts a consolidated molecular basis
of CRC which is extended in this study by including
miRNA regulation. An algorithm, the miRNA-add-on
(miRAO), is proposed which automatically adds miRNA
regulation into molecular models such as the NSAID
model. The miRAO checks whether each miRNA has
Page 5 of 12
been validated with targets according to a specified
miRNA-target database (Additional file 1) and whether
each miRNA has validated transcription factors (TFs)
according to the TransmiR database (version 1.2), which
provides detailed information regarding type and effect
of transcriptional regulations on miRNAs with corresponding literature [34]. If such validated gene targets
or miRNA transcription factors are available, then the
miRAO adds the molecular miRNA regulation to the
model (Fig. Methods;). In this way, the NSAID model is
extended with available validated miRNA-target and
TF-miRNA information, which strengthens the model
with detailed molecular regulation mechanisms related
to miRNA. The new version of the model is named
NSAID-miR; a summarization is given in Table 2.
Therapeutic Prediction of Ten Signaling Agents on CRC
Cancer Cell Lines
In order to validate the NSAID-miR model, the inhibition effects of ten signaling agents on seven CRC
cancer cell lines are simulated and compared to experimentally measured inhibition effects (sensitivity scores)
from the study of Holbeck et al. [31]: COLO-205,
HCC-2998, HCT-116, HCT-15, HT29, KM-12, and
SW-620. The NSAID-miR model is initialized with
gene-expression and miRNA-expression data of individual CRC cancer cell lines (Methods). The effects of
ten signaling agents are studied: dasatinib, erlotinib,
everolimus, gefitinib, imatinib, lapatinib, nilotinib, sorafenib, sunitinib, and temsirolimus. The inhibition
potential of these tyrosine-kinase inhibitors can be specified through corresponding dissociation constants.
They were measured experimentally by Karaman and
Fig. 2 The work-flow of the molecular concept for individualized medicine. In order to reflect or capture the individual patient response to specific
treatment, four types of information are currently needed as input to construct a molecularly based model, which might act as a 'Virtual Patient' to
achieve the goal of individualized medicine
Li and Mansmann BMC Cancer (2015) 15:472
Page 6 of 12
Table 2 The component/reaction summary of the
NSAID-miR model
Table 3 Ten signaling agents and their targets with dissociation
constant
Component
No.
Reaction
No.
Drug
Target
Dissociation constant (nM)
Gene
1284
Transcription
1933
Dasatinib
ABL1
0.53
mRNA
2360
Translation
898
EPHA3
0.09
Protein
1473
Decay
2172
EPHA5/8
0.24
miRNA
367
Complex-formation
579
PDGFRA
0.47
Compound
44
Translocation
1361
LYN
0.57
Complex
856
Phosphorylation
749
KIT
0.62
Pseudo-object
21
Dephosphorylation
357
SRC
0.21
SiRNA
1
Activation
341
EGFR
0.67
miRNA-binding
1516
ERBB4
230
Sum:
6406
Sum:
9906
LYN
530
colleagues [35]. How these inhibition effects are modeled is described in Table 3. Subsequently, we performed the FCA to calculate the simulated sensitivity
scores of the cell lines (Methods) and supplies kinetic
data. The Pearson correlation is used to compare the
model-based sensitivity scores to the experimentally
based sensitivity scores measured under the in vitro
condition by Holbeck et al. [31]. Among these signaling agents, the dasatinib (0.964, p = 2.78e-03),
everolimus (0.929, p = 6.75e-03), imatinib (0.893, p =
1.23e-02), and sunitinib (0.821, p = 3.41e-02) have
high correlations of sensitivity scores (>0.80, Fig. 3a-c,
Additional file 2). We also quantified the correlation
between everolimus and temsirolimus treatment response of CRC cell lines measured by GI-50 and the
model-based sensitivity score using the R2 measure.
Under everolimus, R2 = 0.9713, and under temsirolimus, R2 = 0.9824. (Fig. 3d). These high correlations provide evidence that the NSAID-miR model captures
drug effects in the CRC cellular system.
Lapatinib (0.679, p = 1.10e-02) has the lowest correlation of sensitivity scores (Fig. 3b, Additional file 2). The
reason for this relatively low prediction rate could be
that the inhibition effect of lapatinib in the NSAID-miR
is only determined by the inhibition of three members of
the ERBB-family. The dissociation constant between
lapatinib and ERBB4 is relatively high (54 nM), which
further weakens the effect of lapatinib in the NSAIDmiR (Table 3). The overall correlation of the sensitivity
scores of all ten drug treatments is 0.947. However,
without use of miRNA expression data as input data for
the in silico model, the same approach only achieved an
overall correlation of 0.838 (Fig. 4). This difference (pvalue: 0.021) indicates the value of miRNA expression
profiles in better understanding the molecular mechanisms of cellular systems and their essential role in the
prediction of therapeutic responses.
Erlotinib
SRC
700
Everolimus
MTOR
2.2
Gefitinib
EGFR
1.0
ERBB2
3500
Imatinib
Lapatinib
Nilotinib
Sorafenib
Sunitinib
Temsirolimus
ERBB4
410
LYN
990
ABL1
12.0
ABL2
10.0
KIT
14.0
PDGFRA
31.0
PDGFRB
14.0
EGFR
2.4
ERBB2
7.0
ERBB4
54.0
KIT
22
PDGFRB
22
DDR1
1.5
DDR2
6.6
FLT3
0.47
KIT
0.37
PDGFRA
0.79
PDGFRB
0.08
MTOR
2.2
VEGFR
0.75
The experimentally measured dissociation constants of these signaling agents
were mainly taken from Karaman et al. [35]
Therapeutic Prediction of CRC Patients with Microsatellite
Instability (MSI) and Microsatellite Stability (MSS)
Microsatellites are short repetitive DNA sequences that
are prone to frameshift mutations and base-pair substitutions during duplication. MSI is one of the most
extensively investigated genetic phenotypes, and is detected in approximately 15 % of CRC cases [36]. Many
studies provide evidence that CRC with MSI status is
associated with favorable clinical outcomes [37–41].
Li and Mansmann BMC Cancer (2015) 15:472
Page 7 of 12
Fig. 3 Sensitivity scores of CRC cancer cell lines. a: the plot visualizes how CRC cancer cell lines respond to the treatment of dasatinib, erlotinib, and
everolimus. b: the plot quantitatively displays how CRC cancer cell lines respond to the treatment of gefitinib, imatinib and lapatinib. c: the plot
quantitatively shows how CRC cancer cell lines respond to the treatment of nilotinib, sorafenib, sunitinib and temsirolimus. All data are attached in the
Additional file 2 (Exp: experimentally based sensitivity score; Sim: model-based sensitivity score). d: R2 measure between responses (GI-50) of CRC cell
lines and predicted sensitivity scores to treatments of everolimus and temsirolimus
In contrast, other studies show controversial data related to the predictive value of MSI [42–45]; clearly,
there is uncertainty as to the predictive ability of this
genetic phenotype in clinical practice. In response to
this, we apply the NSAID-miR model to predict the
therapeutic responses of MSI/MSS patients. Moreover,
we investigate the molecular mechanisms leading to
the discrepancy between the clinical outcomes of individual colon cancer patients with MSI status versus
those with MSS status. From the Cancer Genome Atlas
[46], we obtained genetic data, including miRNA/gene-expression data and patient information (age, sex, race, cancer stage and other) of 22 colon cancer patients
(Additional file 3), of which eleven have MSS status, and
eleven MSI; the patients' cancer stages range from I to III.
Further, two recent studies demonstrated that both drugs
sirolimus and LY294002 (targeting mTor- and PI3Ksignaling pathways, respectively) clearly reduced the
Li and Mansmann BMC Cancer (2015) 15:472
Page 8 of 12
Fig. 4 Single points represent reaction of a specific cell line under a specific treatment. Different colours represent different treatments. Overall
correlation: without miRNA information 0.838, with miRNA information 0.947, p-value for difference in correlation structure given miRNA information
(yes, no) p = 0.021
growth of MSI tumors, but not MSS tumors [47, 48]. In
order to investigate this issue with the application of the
NSAID-miR model, we initialized the model with the
gene-expression and miRNA-expression data of these patients individually (Methods). Subsequently, we performed
the FCA to predict how these individual patients would
respond to drug treatments.
The results show that all MSS patients would not respond to the sirolimus treatment, regardless of colon
cancer stage (Fig. 5). Among the eleven MSI patients, we
found that two patients with advanced cancer stage III
would not respond to the sirolimus treatment, while the
remaining nine MSI patients would. In general, the predictions are in agreement with the results from the
aforementioned studies [47, 48]. Further, our results
support the finding that the prognosis for MSI tumors
in stage III CRC is poor [49]. Taking model based
miRNA level as readouts of model NSAID-miRNA, FCA
results between MSI and MSS patients after treatment
show that the expression levels of miR-18a, −19a, −203,
−224, and −92 are downregulated on average by >15 %
(p = 3.49e-06) in patients with stages I and II. The expression levels of miR-181b, −183, −20a, −21, −31 and −96 are
downregulated on average by >15 % (p = 6.09e-04) in patients with stage III (Fig. 6a; Additional file 4). The
expression levels of miR-30a, −143, −145, −200b and −378
are upregulated on average by >1.8 fold (p = 7.84e-06) in
patients of all stages (Additional file 4).
Two male African Americans in cancer stages IIA
and IIIC among eleven MSS patients would respond
to the LY294002 treatment. Further investigation of
the FCA result shows that the expression levels of
mir-21, −140, −188, −216, −224, −374, −503 and −675
were reduced in these two patients after treatment
(Fig. 6b; Additional file 4). Eight among eleven MSI
patients would respond to the LY294002 treatment.
Interestingly, we found that the three MSI patients
with CRC stage III, who would not respond to the
LY294002 treatment, showed high activity of the cellcycle pathway, and the expression levels of mir-21,
−34a, −95, −135a and −320 remained nearly unchanged after this treatment (Additional file 4). This
result might reveal the key miRNA-regulators that
negatively contribute to the clinical outcome of MSI
patients. Furthermore, by using a ROC curve and the
corresponding AUC, we quantified the discrimination
between response between MSS and MSI patients
through the in silico prediction given by our model.
The AUC for response prediction under sirolimus is
0.876, The AUC for response prediction under LY294002
is 0.715. (Fig. 7)
Conclusion & Discussion
This study introduces a concept which integrates different types of molecular data for individualized medicine.
It uses an in silico environment to capture the molecular
Li and Mansmann BMC Cancer (2015) 15:472
Page 9 of 12
Fig. 5 Simulated response of drug treatments. The model component 'proliferation' is considered as the readout component of this FCA analysis,
which compares the flux from treatment state with the flux from control state of each patient. Patients with hallmark proliferation smaller than 1
are considered responders, while those with hallmark proliferation bigger than 1 are considered non-responders
regulation effect of miRNAs within individual cancerous
cellular systems (Fig. 2). Four major sources of input
information are used to calculate the individual response
of the system: molecular, kinetic, individual genetic
(miRNA/mRNA expression data) and treatment data.
The internal network structure of the NSAID-miR
model covers molecular signaling pathways (including
transcription and translation, protein-protein interaction,
and protein modification) and miRNA regulation. The
kinetic data describes kinetic values of different types of
reactions (such as transcription, phosphorylation, complex
formation, receptor-ligand-binding) and allows to implement the treatment effects. The kinetic data impacts the
signal flow (defining classical chemical reactions of substrates for producing products with or without modifiers)
throughout the network. Contrasting the flux in the untreated cell with the flux of the treated cell allows
quantifying changes in the cancer hallmarks. These
changes can be used to predict treatment response of the
system.
During this study, data of CRC cell lines as well as
patients were used for the validation. For ten agents,
we simulated the responses of seven CRC cell lines and
compared them to their in vitro drug response data.
There is high correlation, which indicates the reliability
and precision of the predictions of the proposed model.
In order to give a first demonstration of the potential
clinical usefulness of this concept, we received the
miRNA and gene expression data of 22 MSI/MSS patients provided by the Cancer Genome Atlas [46] for
predicting the clinical outcome of the sirolimus and
LY294002 treatments. The prediction results show that
most MSI patients would respond to both drug treatments, however most MSS patients would not. At the
Li and Mansmann BMC Cancer (2015) 15:472
Page 10 of 12
Fig. 6 Simulated miRNA expression pattern after treatments. The simulated result reveals that global miRNA expression profile can be changed due to
the drug treatment. According to the expression patterns, both treatments have more significant impact on the MSI patients than MSS patients.
However, specific patients may have individual treatment responses
Li and Mansmann BMC Cancer (2015) 15:472
Page 11 of 12
Fig. 7 ROC analysis of discrimination of treatment responses between MSS and MSI patients
moment, data on clinical response for these patients
is still not available. But our result is in accordance
with clinical knowledge that MSI status is related to
the response of the treatment under study [47,48].
Based on our results, we strongly hypothesize that
one molecular reason for better therapeutic outcomes
of MSI patients could be the upregulation of tumorsuppressor miRs and downregulation of oncogenic
miRs, which drives the cellular system of patients
with MSI status away from the full-fledged malignant
cellular state with strong drug resistance and uncontrolled proliferation.
In a recent study, Ellwanger and colleagues [50] decipher the role of miRNA on a large scale, which provides
knowledge for the implementation of miRNA regulation
in molecular in silico models. We see that many of their
findings are already implemented in our NSAID-miR
model, for instance, the regulation mechanisms of mir21, mir-181 and let-7. However, the NSAID-miR model
might be the first molecular signaling model which
contains not only validated miRNA-target relationship
information but also includes literature-referenced relationships between transcription factors and miRNAs. In
addition, the NSAID-miR model can be applied to investigate therapeutic response of patients with cancers
beyond CRC. For instance, we are studying a genomescale model of acute myeloid leukemia (AML) to predict
individual response to AML clinical treatments; the results
achieved thus far are promising (data not shown), which
indicates that our approach also possesses the potential to
be extended to diverse other cancer types. However, one
limitation of our model is the applied kinetic data, which
is mainly determined through empirical experience. How
to perform appropriate estimates in patient groups
(depending on age, sex, etc.) is the issue of our future
research. Furthermore, our concept does not consider
metabolic molecular information. This is another challenge of future research.
Additional file
Additional file 1: Validated miRNA target with literature reference.
Additional file 2: Experimentally based sensitivity score and modelbased sensitivity score for treatments of ten signaling agents with
and without consideration of miRNA expression data.
Additional file 3: Patient Information.
Additional file 4: Comparison result between treatment state and
control state from the FCA analysis.
Competing Interest
The authors declare no conflict of interest with regard to the content of this
manuscript.
Authors' contribution
JL made the conception and design of the study; JL collected the data and
performed the simulation and analysis; JL, UM did evaluation and interpretation
of the read-out data; JL drafted the manuscript; UM revised the manuscript
critically; UM gave final approval for publication. All authors read and approved
the final manuscript.
Acknowledgement
This study is funded by the German Cancer Consortium (DKTK) and German
Cancer Research Center (DKFZ). We thank the Cancer Genome Atlas for the
collaboration and professional technical support. We thank Rory Wilson for
help with the manuscript revision.
Author details
Institute for Medical Informatics, Biometry and Epidemiology,
Ludwig-Maximilians-University München, Munich, Germany. 2German Cancer
Consortium (DKTK), Heidelberg, Germany. 3German Cancer Research Center
(DKFZ), Heidelberg, Germany.
1
Received: 11 July 2014 Accepted: 14 May 2015
References
1. Edwards BK, Ward E, Kohler BA, Eheman C, Zauber AG, Anderson RN, et al.
Annual report to the nation on the status of cancer, 1975–2006, featuring
colorectal cancer trends and impact of interventions (risk factors, screening,
and treatment) to reduce future rates. Cancer. 2010;116(3):544–73.
2. Armaghany T, Wilson JD, Chu Q, Mills G. Genetic alterations in colorectal
cancer. Gastrointest Cancer Res. 2012;5(1):19–27.
3. de Sousa EM, Wermeulen L, Richel D, Medema JP. Targeting Wnt signaling
in colon cancer stem cells. Clin Cancer Res. 2011;17(4):653–7.
4. Qian L, Wong B. Role of Notch signaling in colorectal cancer.
Carcinogenesis. 2009;30(12):1979–86.
Li and Mansmann BMC Cancer (2015) 15:472
5.
6.
7.
8.
9.
10.
11.
12.
13.
14.
15.
16.
17.
18.
19.
20.
21.
22.
23.
24.
25.
26.
27.
28.
29.
30.
31.
32.
33.
Gulino A, Ferretti E, De Smaele E. Hedgehog signaling in colon cancer and
stem cells. EMBO Mol Med. 2009;1(6–7):300–2.
Fang JY, Richardson BC. The MAPK signaling pathways and colorectal cancer.
Lancet Oncol. 2005;6(5):322–7.
Wang S, Liu Z, Wang L, Zhang X. NF-kappeB signaling pathway, inflammation
and colorectal cancer. Cell Mol Immunol. 2009;6(5):327–34.
Schetter AJ, Okayama H, Harris CC. The Role of microRNAs in Colorectal
Cancer. Cancer J. 2012;18(3):244–52.
Akao Y, Nakagawa Y, Naoe T. MicroRNA-143 and-145 in colon cancer. DNA
Cell Biol. 2007;26(5):311–20.
Asangani IA, Rasheed SA, Nikolova DA, Leupoid JH, Colburn NH, Post S,
et al. MicroRNA-21 (miR-21) post-transcriptionally downregulates tumor
suppressor Pdcd4 and stimulates invasion, intravasation and metastasis in
colorectal cancer. Oncogene. 2008;27(15):2128–36.
Chen X, Guo X, Zhang H, Xiang Y, Chen J, Yin Y, et al. Role of miR-143
targeting KRAS in colorectal tumorigenesis. Oncogene.
2009;28(10):1385–92.
Gregersen LH, Jacobsen AB, Frankel LB, Wen J, Krogh A, Lund A. MicroRNA145 targets YES and STAT1 in colon cancer cells. PLoS One. 2010;5(1), e8836.
Ng EK, Chong WW, Jin H, Lam EK, Shin VY, Yu J, et al. Differential expression
of microRNAs in plasma of patients with colorectal cancer: a potential
marker for colorectal cancer screening. Gut. 2009;58(10):1375–81.
Zhang J, Guo H, Zhang H, Wang H, Qian G, Fan X, et al. Putative tumor
suppressor miR-145 inhibits colon cancer cell growth by targeting oncogene
Friend leukemia virus integration 1 gene. Cancer. 2011;117(1):86–95.
Huang Z, Huang D, Ni S, Peng Z, Sheng W, Du X. Plasma microRNAs are
promising novel biomarkers for early detection of colorectal cancer. Int
J Cancer. 2010;127(1):118–26.
Cheng H, Zhang L, Cogdell D, Zheng H, Schetter A, Nykler M, et al. Circulating
plasma MiR-141 is a novel biomarker for metastatic colon cancer and predicts
poor prognosis. PLoS One. 2011;6(3), e17745.
Link A, Balaguer F, Shen Y, Nagasaka T, Lozano JJ, Boland CR, et al. Fecal
MicroRNAs as novel biomarkers for colon cancer screening. Cancer
Epidemiol Biomarkers Prev. 2010;19(7):1766–74.
Hotchi M, Shimada M, Kurita N, Iwata T, Sato H, Morimoto S, et al. microRNA
expression is able to predict response to chemoradiotherapy in rectal cancer.
Mol. Clin Oncol. 2013;1(1):137–42.
Kulda V, Pesta M, Topolcan O, Liska V, Treska V, Sutnar A, et al. Relevance of
miR-21 and miR-143 expression in tissue samples of colorectal carcinoma
and its liver metastases. Cancer Genet Cytogenet. 2010;200(2):154–60.
Nielsen BS, Jorgensen S, Fog JU, Sokilde R, Christensen IJ, Hansen U, et al. High
levels of microRNA-21 in the stroma of colorectal cancers predict short disease-free
survival in stage II colon cancer patients. Clin Exp Metastasis. 2011;28(1):27–38.
Shibuya H, Linuma H, Shimada R, Horiuchi A, Watanabe T. Clinicopathological
and prognostic value of microRNA-21 and microRNA-155 in colorectal cancer.
Oncology. 2010;79(3–4):313–20.
Melo SA, Kalluri R. Molecular Pathways: MicroRNAs as Cancer Therapeutics.
Clin Cancer Res. 2012;18:4234.
Robinson MD, Oshlack A. A scaling normalization method for differential
expression analysis of RNA-seq data. Genome Biol. 2010;11:R25.
NCI-60 RNA Expression Data Repository. />datasets.jsp
NCI-60 CellMiner. />Li J, Mansmann U. Modeling of Non-Steroidal Anti-Inflammatory Drug Effect
within Signaling Pathways and miRNA-Regulation Pathways. PLoS One.
2013;8(8), e72477.
Hanahan D, Weinberg R. Hallmarks of Cancer: The Next Generation. Cell.
2011;144:646–74.
Li J, Pandey V, Kessler T, Lehrach H, Wierling C. Modeling of miRNA and
drug action in the EGFR signaling pathway. PLoS One. 2012;7(1), e30140.
Nashan B. Review of the proliferation inhibitor everolimus. Expert Opin
Investig Drugs. 2002;11(12):1845–57.
Walker EH, Pacold ME, Perisic O, Stephens L, Tawkins PT, Wymann MP, et al.
Structural determinants of phosphoinositide 3-kinase inhibition by Wortmannin,
LY294002, Quercetin, Myricetin, and Staurosporine. Mol Cell. 2000;6:909–19.
Holbeck S, Collins JM, Doroshow JH. Analysis of food and drug administrationapproved anti-cancer agents in the NCI60 panel of human tumor cell lines.
Mol Cancer Ther. 2010;9:1451–60.
Bland JM, Altman DG. Calculationg correlation coefficients with repeated
observations: Part 1 – correlation within subjects. BMJ. 1995;310:446.
NSAID-miR model. ftp://138.245.80.137/NSAID_miR.xml
Page 12 of 12
34. Wang J, Lu M, Qiu C, Cui Q. TransmiR: a transcription factor-microRNA regulation
database. Nucleic Acids Res. 2010;38(Database issue):D119–22.
35. Karaman MW, Herrgard S, Treiber DK, Gallant P, Atteridge CE, Campbell BT,
et al. A quantitative analysis of kinase inhibitor selectivity. Nat Biotechnol.
2008;26(1):127–32.
36. Tejpar S, Bertagnolli M, Bosman F, Lenz HJ, Garraway L, Waldman F, et al.
Prognostic and predictive biomarkers in resected colon cancer: current
status and future perspectives for integrating genomics into biomarker
discovery. Oncologist. 2010;15(4):390–404.
37. Halling KC, French AJ, McDonnell SK, Burgart LJ, Schaid DJ, Peterson BJ,
et al. Microsatellite instability and 8p allelic imbalance in stage B2 and
C colorectal cancers. J Natl Cancer Inst. 1999;91(15):1295–303.
38. Gryfe R, Kim H, Hsieh ET, Aronson MD, Holowaty EJ, Bull SB, et al. Tumor
microsatellite instability and clinical outcome in young patients with
colorectal cancer. N Engl J Med. 2000;342(2):69–77.
39. Ribic CM, Sargent DJ, Moore MJ, Thibodeau SN, French AJ, Goldberg RM,
et al. Tumor microsatellite-instability status as a predictor of benefit from
fluorouracil-based adjuvant chemotherapy for colon cancer. N Engl J Med.
2003;349(3):247–57.
40. Lanza G, Gafa R, Santini A, Maestri I, Guerzoni L, Cavazzini L. Immunohistochemical
test for MLH1 and MSH2 expression predicts clinical outcome instage II
and III colorectal cancer patients. J Clin Oncol. 2006;24(15):2359–67.
41. Roth AD, Tejpar S, Delorenzi M, Yan P, Fiocca R, Klingbiel D, et al. Prognostic
role of KRAS and BRAF in stage II and III resected colon cancer: results of
the translational study on the PETACC-3, EORTC 40993, SAKK 60–00 trial.
J Clin Oncol. 2010;28(3):466–74.
42. Jernvall P, Maekinen MJ, Karttunen TJ, Maekelae J, Vihko P. Microsatellite
instability: impact on cancer progression in proximal and distal colorectal
cancers. Eur J Cancer. 1999;35(2):197–201.
43. Feeley KM, Fullard JF, Heneghan MA, Smith T, Maher M, Murphy RP, et al.
Microsatellite instability in sporadic colorectal carcinomas is not an indicator
of prognosis. J Pathol. 1999;188(1):14–7.
44. Salahshor S, Kressner U, Fischer H, Lindmark G, Glimelius B, Pahlman L, et al.
Microsatellite instability in sporadic colorectal cancer is not an independent
prognostic factor. Br J Cancer. 1999;81(2):190–3.
45. Gafa R, Maestri I, Matteuzzi M, Santini A, Ferretti S, Cavazzini L, et al.
Sporadic colorectal adenocarcinomas with high-frequency microsatellite
instability. Cancer. 2000;89(10):2025–37.
46. Cancer Genome Atlas.
47. Zhang J, Roberts TM, Shivdasani RA. Targeting PI3K signaling as a
therapeutic approach for colorectal cancer. Gastroenterology.
2011;141(1):50–61.
48. Thompson C, Leong S, Messersmith M. Promising targets and drugs in
development for colorectal cancer. Semin Oncol. 2011;38(4):588–97.
49. Tejpar S, Delorenzi R, Fiocca R, Yan P, Klingbiel D, Dietrich D, et al.
Microsatellite instability (MSI) in stage II and III colon cancer treated with
5FU-LV or 5FU-LV and irinotecan (PETACC 3-EORTC 40993-SAKK 60/00 trial). J
Clin Oncol. 2009;27:15s.
50. Ellwanger DC, Leonhardt JF, Mewes HW. Large-scale modeling of conditionspecific gene regulatory networks by information integration and inference.
Nucleic Acids Res. 2014;42:21.
Submit your next manuscript to BioMed Central
and take full advantage of:
• Convenient online submission
• Thorough peer review
• No space constraints or color figure charges
• Immediate publication on acceptance
• Inclusion in PubMed, CAS, Scopus and Google Scholar
• Research which is freely available for redistribution
Submit your manuscript at
www.biomedcentral.com/submit