Yield, quality parameters and economics of rice as influenced by phosphorus management in rice-groundnut sequence
Bạn đang xem bản rút gọn của tài liệu. Xem và tải ngay bản đầy đủ của tài liệu tại đây (476.02 KB, 12 trang )
Int.J.Curr.Microbiol.App.Sci (2020) 9(8): 367-378
International Journal of Current Microbiology and Applied Sciences
ISSN: 2319-7706 Volume 9 Number 8 (2020)
Journal homepage:
Original Research Article
/>
Yield, Quality Parameters and Economics of rice as influenced by
Phosphorus Management in Rice-Groundnut sequence
M. Venkata Lakshmi1*, CH. Pulla Rao1, P. V. N. Prasad1,
P. Prasuna Rani2 and Y. Ashoka rani3
1
Department of Agronomy, Agricultural College Farm, Bapatla, India
2
Geospatial Technology Centre Guntur, India
3
Department of Crop physiology, Agricultural College, Bapatlaa, Acharya N G Ranga
Agricultural University, Lam, Guntur, India
*Corresponding author
ABSTRACT
Keywords
Yield, Economics,
in-situ green
manuring,
Phosphorus
management and
Rice
Article Info
Accepted:
10 July 2020
Available Online:
10 August 2020
A field experiment was conducted during Kharif 2016-17 and 2017-18 respectively on
sandy loam soils of Agricultural College Farm Bapatla to study the yield, economics and
quality parameters as influenced by phosphorus management in rice-groundnut
sequence.The experiment was laid out in split plot design in Kharif rice and the treatments
were replicated thrice. The treatments consisted of four main plots sources of phosphorus
S1 : Inorganic fertilizer phosphorus through SSP, S2 : Green manuring in-situ with
dhaincha @ 25 kg seed ha-1, S3 : Biofertilizer (PSB) @ 750 ml ha-1, S4 : Green
manuring in-situ with dhaincha @ 25 kg seed ha-1 + Biofertilizer (PSB) @ 750 ml ha-1
and three subplots levels of phosphorus L1 : 50% Recommended dose of P, L2 : 100 %
Recommended dose of P and L3 : 150% Recommended dose of P. Results of the
experiment showed that application of in-situ green manuring + PSB along with inorganic
phosphorus through SSP showed superior performance in terms of yield, quality
parameters and economics over alone application of inorganic fertilizer phosphorus
through SSP. Among the levels of phosphorus 150 % RDP showed higher yield, quality
parameters and economics over 50 % RDP and however it was on par with 100 % RDP.
plant can produce good yield if it suffers from
P deficiency. It is involved in the supply and
transfer of energy for all biochemical
processes in plants and hence, it is called as
the "energy currency of living cells". It
stimulates
early
root
growth
and
development, encourages more active
tillering, drymatter accumulation and
promotes early flowering, maturity and good
Introduction
Rice (Oryza sativa L.) is one of the most
important cereal crop. In India, rice ranks first
among all the crops occupying 43.95 m ha
area and production of 106.54 mt with an
average productivity of 2424 kg/ha (CMIE,
2017-18). Among the fertilizer elements,
phosphorus is an essential nutrient and no
367
Int.J.Curr.Microbiol.App.Sci (2020) 9(8): 367-378
high in available potassium (483, 521 kg ha-1)
during 2016-17 and 2017-18 respectively.
The experiment was laid out in a split plot
design in Kharif rice and the treatments were
replicated thrice. The treatments consisted of
four main plots sources of phosphorus S1:
Inorganic fertilizer phosphorus through SSP,
S2: Green manuring in-situ with dhaincha @
25 kg seed ha-1, S3: Biofertilizer (PSB) @ 750
ml ha-1, S4: Green manuring in-situ with
dhaincha @ 25 kg seed ha-1 + Biofertilizer
(PSB) @ 750 ml ha-1 and three subplots levels
of phosphorus L1: 50% Recommended dose of
P, L2: 100% Recommended dose of P and L3:
150% Recommended dose of P. A very
popular variety, BPT 5204 (Samba Mahsuri)
was used for the study. The experimental field
was ploughed twice by a tractor drawn
cultivator, followed by a rotovator to obtain
required tilth. The levelled field was then
divided into the required number of main
plots as per the layout plans. Dhaincha seed
was broadcasted in the main plots namely S2
(Green manuring @ 25 kg ha-1) and S4 (Green
manuring in situ + biofertilizer (PSB) @ 750
ml ha-1) in all the three replications as per the
layout plans and the seeds were covered by
dragging a spike toothed harrow. These main
plots (Green manure plots) were divided into
sub plots after incorporation of green manure
by making strong bunds and irrigation was
given for better decomposition before
transplanting of rice crop during both the
years of experimentation.
grain development. Further, optimum
response to added nitrogen could be obtained
only when adequate amount of P is supplied.
Therefore, P availability from soils to the
plant is the key to sustain higher yields. Green
manures represent a promising approach to
maintain sustainable nutrient supply for crop
growth. The P in green manure could
potentially be delivered to the soil in a form
which is readily available to plants and soil
microorganisms. Plants utilize less amounts
of phosphatic fertilizers that are applied and
the remaining portion is rapidly converted in
to insoluble complexes in the soil. Slow
mobility of applied phosphorus and its
marked fixation results in low crop recoveries
in the order of 20-25%. Phosphate
solubilizing bacteria (PSB) solubilize
insoluble phosphorus and increase its
availability phosphorus in the soil and inturn
the overall phosphate use efficiency.
Integrated use of chemical fertilisers with
green manure crop and bio-fertilizer
is
important for sustainable rice production.
The increased prices of fertilizers also
intensified the problem by increasing cost of
inputs. so, trail was conducted with different
doses of phosphorus levels in combinaion
with in-situ green manur ing and psb then
reduce the higher use of chemical fertilizers .
The present study was, therefore, designed to
find out the response of rice to sources and
levels of phosphorus with regard to yield,
quality and economics of rice.
A common dose of nitrogen at 120 kg ha-1
was applied in the form of urea in three splits,
half at basal, one fourth at active tillering and
remaining at panicle initiation stage.
Phosphorus in the form of single super
phosphate was applied basal as per the
treatments. A common dose of 40 kg K2O ha-1
was applied as basal just before transplanting
through muriate of potash by taking the plot
size into consideration.
Materials and Methods
The experiment was conducted at the
Agricultural College Farm, Bapatla. Initial
soil sample analysis revealed that the
experimental soil was sandy loam in texture,
slightly alkaline in reaction (pH7.6, 7.8), low
in organic carbon (0.42, 0.43 %), low in
available nitrogen (226, 230 kg ha-1), low in
available phosphorus (18, 20 kg ha-1) and
368
Int.J.Curr.Microbiol.App.Sci (2020) 9(8): 367-378
Increase in volume after cooking (X-50)
Quality parameters
Volume Expansion =
Protein Content
Increase in volume before cooking (Y-15)
Grain nitrogen content (%) estimated by
microkjeldhal method (Jackson, 1973) was
multiplied by the factor 6.25 and expressed as
protein content (%) of the grain.
Five grams of rice sample was soaked in 15ml
of water for 5 minutes in a 50 ml graduated
centrifuge tube. The volume of water was
recorded after adding rice samples (Y-15).
Rice cooked for 20 minutes in water bath was
dipped in 100ml measuring cylinder (X)
containing 50ml water. The volume raised
was recorded (X-50) and was computed by
using the above formula.
Protein content (%) = Total N content (%) x
6.25
Amylose Content
Grain amylose content was estimated as per
the procedure as described by Sadasivam and
Manickam (1992) and expressed as
percentage.
The gross returns from each treatment were
worked out with the prevailing market prices.
The net returns from each treatment were
arrived at by deducting the cost of cultivation
with the existing prices of inputs and wages
of labour. Returns per rupee investment for all
the treatments was worked out on the basis of
net returns in terms of rupees after deducting
the cost of treatments from gross returns.
Procedure
Weigh 0.1 g of the rice powdered sample, and
add 1 ml of distilled ethanol. Then add 10 ml
of 1 N NaOH and leave it overnight. Make up
the volume to 100 ml. Take 2.5 ml extract,
add about 20 ml distilled water and then three
drops of phenolphthalein. Add 0.1 N HCl
drop by drop until the pink colour just
disappears. Add 1 ml of iodine reagent and
make up the volume to 50 ml and read the
colour at 590 nm. Take 0.2, 0.4, 0.6, 0.8 and 1
ml of the standard amylose solution and
develop the colour as in the case of sample.
Calculate the amount of amylose present in
the sample using the standard graph. Dilute 1
ml of iodine reagent to 50 ml with distilled
water for a blank.
Gross returns = Value of the product (Grain +
Straw)
Net returns
cultivation
= Gross returns - Total cost of
Net returns
Returns per rupee investment =
Cost of cultivation
The gross returns from each treatment were
worked out with the prevailing market prices.
The net returns from each treatment were
arrived at by deducting the cost of cultivation
with the existing prices of inputs and wages
of labour. Returns per rupee investment for all
the treatments was worked out on the basis of
net returns in terms of rupees after deducting
the cost of treatments from gross returns.
Volume Expansion Ratio
Volume expansion ratio was determined as
suggested by Verghese (1950) and modified
by Murthy (1965) by using the following
formula
369
Int.J.Curr.Microbiol.App.Sci (2020) 9(8): 367-378
Gross returns = Value of the product (Grain +
Straw)
Net returns
= Gross returns - Total cost of
cultivation
vegetative growth stage and its distribution to
yield attributes during reproductive stage
through a process of translocation from
source to sink and finally determines the
economic yield of the crop.
Net returns
Returns per rupee investment =
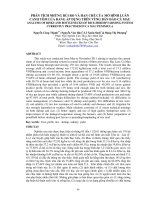
During both the years significantly higher
yields were recorded with the treatment that
received in combination with inorganic
fertilizer through SSP and
in-situ green
manuring + biofertilizer (PSB) i.e. 5656 kg
ha-1, 5896 kg ha-1 and 5776 kg ha-1 during 1st,
2nd years and pooled data respectively, which
was statistically on a par with in-situ green
manuring treatment (5520, 5730 and 5625 kg
ha-1) during 1st and 2nd years and pooled data
respectively but proved significantly superior
to alone inorganic fertilizer through SSP
(4620, 4649, 4635 kg ha-1) and biofertilizer
(PSB) alone treatment (5179, 5329 and 5254
kg ha-1) under test.
Present study results showed that in-situ green
manuring + biofertilizer (PSB) with inorganic
fertilizer through SSP significantly influenced
the grain yield of rice. Application of in-situ
green manuring + biofertilizer (PSB) along
with fertilizer was found to be superior in
realizing maximum grain yield. It might be
due to the fact that green manure biomass is a
potential source of major nutrients for
lowland rice and showed significant
improvement in growth, yield, net returns,
soil moisture retension, organic carbon and
nutrient status of soil and reduction in bulk
density of plough layer (Jyothi and Nallaiah
(2015) and Siva Jyothi et al., 2013). The yield
increase may be due to increase in growth
attributes like drymatter production and yield
attributes like panicle length, total number of
grains, more number of filled grains per
panicle. Similar findings were also reported
by Arivukkarasu and Kathiresan (2007) and
Deshpande and Devasenapathy (2010). Green
manure + Biofertilizer (PSB) promotes
improvement in leaf photosynthetic rate,
biomass production and sink formation,
which increased the grain yield of rice.
Besides P solubilisation activity, PSB
liberates growth harmone (IAA) that might
have influenced on root growth and yield. The
extensive root system might have increased
nutrient uptake from the surroundings which
boosted plant biomass and subsequently more
grain yield of rice. These results were alike
with the findings of Panhwar et al., (2010).
Total drymatter accumulation might have
reflected on the economic yield in view of the
fact that vegetative part of the plant serves as
the source, where as the spikelets are serve as
sink. Accumulation of drymatter during the
However, the lowest grain yield was recorded
with inorganic fertilizer through SSP (4620
kg ha-1, 4649 kg ha-1 and 4635 kg ha-1during
1st, 2nd year and pooled data of stu����������������������������������������������������������������������������������������������������������������������������������������������������������������������������������������������������������������������������������������������������������������������������������������������������������������������������������������������������������������������������������������������������������������������������������������������������������������������������������������������������������������������������������������������������������������������������������������������������������������������������������������������������������������������������������������������������������������������������������������������������������������������������������������������������������������������������������������������������������������������������������������������������������������������������������������������������������������������������������������������������������������������������������������������������������������������������������������������������������������������������������������������������������������������������������������������������������������������������������������������������������������������������������������������������������������������������������������������������������������������������������������������������������������������������������������������������������������������������������������������������������������������������������������������������������������������������������������������������������������������������������������������������������������������������������������������������������������������������������������������������������������������������������������������������������������������������������������������������������������������������������������������������������������������������������������������������������������������������������������������������������������������������������������������������������������������������������������������������������������������������������������������������������������������������������������������������������������������������������������������������������������������������������������������������������������������������������������������������������������������������������������������������������������������������������������������������������������������������������������������������������������������������������������������������������������������������������������������������������������������������������������������������������������������������������������������������������������������������������������������������������������������������������������������������������������������������������������������������������������������������������������������������������������������������������������������������������������������������������������������������������������������������������������������������������������������������������������������������������������������������������������������������������������������������������������������������������������������������������������������������������������������������������������������������������������������������������������������������������������������������������������������������������������������������������������������������������������������������������������������������������������������������������������������������������������������������������������������������������������������������������������������������������������������������������������������������������������������������������������������������������������������������������������������������������������������������������������������������������������������������������������������������������������������������������������������������������������������������������������������������������������������������������������������������������������������������������������������������������������������������������������������������������������������������������������������������������������������������������������������������������������ent practices
Treatments
Source of phosphorus
S1 - Inorganic phosphorus
S2- Green manuring
S3 - Soil application of PSB
S4- Green manuring + PSB
S.Em±
CD ( p = 0.05)
CV (%)
Levels of phosphorus
L1 - 50% RDP
L2 - 100% RDP
L3 - 150% RDP
S.Em±
CD ( p = 0.05)
CV (%)
Interaction
2016-17
2017-18
Pooled data
4620
5520
5179
5656
73.14
253.1
4.2
4649
5730
5329
5896
79.45
274.9
4.4
4635
5625
5254
5776
75.81
262.3
4.3
5024
5283
5425
55.92
167.7
3.7
s
5164
5456
5583
70.28
210.7
4.5
S
5094
5369
5504
57.21
171.5
3.7
S
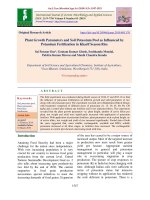
Table.2 Amylose content (%) ratio of Kharif rice as influenced by phosphorus management
practices
Treatments
Source of phosphorus
S1 - Inorganic phosphorus
S2- Green manuring
S3 - Soil application of PSB
S4- Green manuring + PSB
S.Em±
CD ( p = 0.05)
CV (%)
Levels of phosphorus
L1 - 50% RDP
L2 - 100% RDP
L3 - 150% RDP
S.Em±
CD ( p = 0.05)
CV (%)
Interaction
2016-17
2017-18
Pooled data
19.4
22.9
20.3
23.9
0.70
2.1
9.7
20.1
25.0
21.6
26.0
1.03
3.0
13.3
20
24
21
25
0.80
2.4
10.7
20.3
21.8
22.8
0.55
1.6
8.9
NS
21.8
23.4
24.4
0.52
1.5
7.8
NS
21
23
24
0.53
1.5
8.2
NS
372
Int.J.Curr.Microbiol.App.Sci (2020) 9(8): 367-378
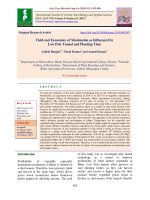
Table.3 Volume expansion ratio of Kharif rice as influenced
by phosphorus management practices
Treatments
Source of phosphorus
S1 - Inorganic phosphorus
S2- Green manuring
S3 - Soil application of PSB
S4- Green manuring + PSB
S.Em±
CD ( p = 0.05)
CV (%)
Levels of phosphorus
L1 - 50% RDP
L2 - 100% RDP
L3 - 150% RDP
S.Em±
CD ( p = 0.05)
CV (%)
Interaction
2016-17
2017-18
Pooled data
3.1
3.6
3.2
4.1
0.18
0.5
15.0
3.3
4.3
3.6
4.9
0.16
0.4
12.2
3.2
3.9
3.4
4.5
0.18
0.5
14.0
3.0
3.4
4.1
0.15
0.5
15.0
NS
3.5
34
4.6
0.15
0.5
12.8
NS
3.3
3.7
4.3
0.15
0.5
14.0
NS
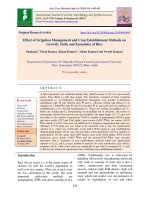
Table.4 Protein content (%) of Kharif rice as influenced by phosphorus management practices
Treatments
Source of phosphorus
S1 - Inorganic phosphorus
S2- Green manuring
S3 - Soil application of PSB
S4- Green manuring + PSB
S.Em±
CD ( p = 0.05)
CV (%)
Levels of phosphorus
L1 - 50% RDP
L2 - 100% RDP
L3 - 150% RDP
S.Em±
CD ( p = 0.05)
CV (%)
Interaction
2016-17
2017-18
Pooled data
6.4
7.9
7.2
8.4
0.16
0.5
6.3
6.5
8.1
7.3
8.6
0.16
0.5
6.1
6.4
8.0
7.2
8.5
0.16
0.5
6.2
7.2
7.4
7.8
0.25
NS
11.7
NS
7.3
7.6
8.0
0.25
NS
11.5
NS
7.3
7.5
7.9
0.25
NS
11.5
NS
373
Int.J.Curr.Microbiol.App.Sci (2020) 9(8): 367-378
Table.5 Cost of cultivation (Rs.), Gross returns (Rs.), Net returns (Rs.) and Returns per rupee investment
of Kharif rice as influenced by phosphorus management practices
Treatments
Cost of
cultivation
Source of phosphorus
S1 - Inorganic phosphorus
S2- Green manuring
S3 - Soil application of PSB
S4- Green manuring +
PSB
S.Em±
CD ( p = 0.05)
CV (%)
Levels of phosphorus
L1 - 50% RDP
L2 - 100% RDP
L3 - 150% RDP
S.Em±
CD ( p = 0.05)
CV (%)
Interaction
SXL
LXS
2016-17
Gross
Net
returns
returns
Returns
per rupee
investment
Cost of
cultivation
2017-18
Gross
Net
returns
returns
Returns
per rupee
investment
Cost of
cultivation
Pooled data
Gross
Net
returns returns
Returns per
rupee
investment
36750
40570
39720
40545
73250
89984
84373
92060
36500
49414
44652
51515
0.99
1.25
1.16
1.29
35516
40349
39472
40328
76000
93346
86822
95935
40484
52997
47350
55607
1.16
1.34
1.23
1.40
36133
40460
39596
40437
74625
91665
85598
93998
38492
51206
46001
53561
1.08
1.30
1.20
1.35
__
__
__
1211.5
4192
4.3
1212
4193
7.8
0.03
0.10
7.1
__
__
__
1330.0
4603
4.5
1330.0
4603
8.1
0.03
0.12
7.8
__
__
__
1261.1
4364
4.4
1261
4364
8
0.03
0.11
7.4
38530
41080
42550
__
__
__
77350
87530
89500
879.0
2635
3.6
38820
46450
46950
879.1
2636
6.6
1.02
1.13
1.10
0.02
0.06
6.1
37950
41200
43178
----__
__
77950
88840
91150
1130.3
3389
4.4
40000
47640
47972
1130.3
3389
8.0
1.05
1.15
1.11
0.03
0.09
7.8
38240
41140
42864
__
__
__
39410
47045
47461
977.2
2930
7.1
1.04
1.14
1.11
0.02
0.07
6.7
NS
NS
-
NS
NS
NS
NS
-
NS
NS
NS
NS
-
NS
NS
NS
NS
374
NS
NS
77650
88185
90325
977.2
2930
3.9
NS
NS
Int.J.Curr.Microbiol.App.Sci (2020) 9(8): 367-378
Among the levels of phosphorus, 150 % RDP
(7.8, 8.0 and 7.9 %) recorded higher protein
content followed by 100 % RDP (7.4, 7.6 and
7.5 %) and 50 % RDP (7.2, 7.3 and 7.3 %)
during both the years and pooled data of
study. This might be due to accumulation of
higher quantities of seed components like
calcium carbonate and increased lipid
metabolism which helps in increasing the
protein content in seed which in turn
increased nitrogen content in grain and also
increased phosphorus levels with inoculation
of PSB strains. Similar findings were also
reported by Roy and Singh (2006) and Aslam
et al., (2010).
phosphorus in both the years and pooled data
of study (Table 5).
The highest gross return (Rs.92060and Rs.
95935 ha-1 during 2016-17 and 2017-18,
respectively) were realized with the combined
application of in-situ green manuring +
biofertilizer (PSB) which was superior over
inorganic fertilizer through SSP and
Biofertilizer (PSB) alone. The lowest gross
return (Rs.73250 and Rs. 76000 ha-1 during
2016-17 and 2017-18, respectively) were
obtained with inorganic fertilizer through
SSP. Among the levels of phosphorus 150 %
RDP recorded significantly higher gross
return which was closely followed with 100
% RDP and was superior over 50 % RDP.
Economics
The results of the trial showed that sources
and levels of phosphorus but not their
interaction had a significant influence on
economics Kharif rice crop (Table 5 ). Gross
returns, net returns and return per rupee
invested were higher with in-situ green
manuring + biofertilizer (PSB) which was
closely followed by the treatment that
received in-situ green manuring. This is due
to lower cost of cultivation and higher grain
and straw yields obtained with these
treatments. Similar views were also expressed
by Mondal et al., (2004).
Gross return from rice in response to sources
and levels of phosphorus a distinctly
descending order of in-situ green manuring +
biofertilizer (PSB), in-situ green manuring,
Biofertilizer (PSB), inorganic fertilizer
through SSP during both the years of study.
Similar findings were reported by Mehla and
Panwar (2000).
Net Return (Rs.ha-1)
Among the sources and levels of phosphorus
to rice crop exhibited significant influence on
net returns from rice crop during both the
years of study (Table 5)
The lower gross returns and net returns were
obtained with inorganic fertilizer through SSP
alone and biofertilizer (PSB) alone
treatments. This is due to higher cost of
cultivation and low grain and straw yield
obtained with these treatments. These results
are in conformity with the findings of Yogesh
et al., (2013), Sharma et al., (2015) and
Nanda et al., (2016).
Net returns were the highest (Rs.51515 and
Rs. 55607 ha-1 during 2016-17 and 2017-18,
respectively) with in-situ green manuring +
biofertilizer (PSB), which was superior to
inorganic fertilizer through SSP. The lowest
net return (Rs.36500 and Rs.40484 ha-1
during 2016-17 and 2017-18, respectively)
were recorded with the application of
inorganic fertilizer through SSP. The trend of
net returns was similar during both the years
and pooled of investigation. Among the levels
of phosphorus 150 % RDP recorded
Gross Return (Rs.ha-1)
Gross returns from rice cultivation were
influenced by sources and levels of
375
Int.J.Curr.Microbiol.App.Sci (2020) 9(8): 367-378
significantly higher net return over 50 % RDP
which was closely followed with 100 % RDP.
Similar results were also reported by Kavitha
and Subramanian (2007) and Moola Ram et
al., (2011).
cropping system. Proceedings of the
21stasian Pacific weed science society
conference. 24-27.
Aslam,M., Ahmad, HK., Himayatullah,AM.,
Ahmad, E., Sagoo, AG., Hussain, A
and Manzoor, M. 2010. Nodulation,
grain yield and grain protein contents as
affected by rhizobium inoculation and
fertilizer placement in chickpea
cultivar. Journal of Agriculture.
26:467-474.
CMIE. 2016-17. Centre for Monitoring Indian
Economy,
.
Deshpande, H. H and Devasenapathy, P.
2010. Effect of green manuring and
organic manures on yield, quality and
economics of rice (Oryza sativa L.)
under low land condition. Karnataka
Journal of Agriculture Science. 23(2):
235-238.
Dixit, K.G and Gupta, B.R. 2000. Effect of
farm yard manure, chemical and
biofertilizers on yield and quality of
rice and soil properties. Journal of
Indian Society of Soil Science. 48(4):
773-780.
Dutta, R and Gogoi, P.K. 2009. Direct and
residual effect of phosphorus in winter
rice (Oryza sativa)-groundnut (Arachis
hypogaea L.) sequence. Research on
Crops 10 (3): 484-488.
Jackson, M.L. 1973. Soil Chemical Analysis.
Prentice Hall of India Private Limited,
New Delhi. 41.
Jyothi, J.R. and Nallaiah, S.D. 2015.
Influence of Integrated Nutrient
Management Practices on Yield and
Yield Attributes, and Economics of
Transplanted Rice (Oryza Sativa L.) in
South
Zone
of
Tamil
Nadu.
International Journal for Innovative
Research in Science & Technology,
1(11): 462-466.
Kavitha, R and Subramanian, P. 2007. Effect
of Municipal solid waste compost
Returns per rupee investment
Returns per rupee investment was altered by
sources and levels of phosphorus in both the
years and pooled data of study (Table 5).
Combined use of green manure in-situ and
PSB resulted in realizing the highest returns
per rupee investment (1.29), which was
superior to all other treatments. Supply of
inorganic fertilizer through SSP was inferior
to all other P sources, which resulted in the
lowest BCR in both the years and pooled of
study.
Among the sources of phosphorus,
application of green manure in-situ + PSB
attained significantly higher economic returns
(Gross returns, Net returns and returns per
rupee investment) during both the years
owing to higher grain yield and in turn higher
gross and net returns in this treatment. The
beneficial effect of green manure and PSB in
improving the net returns and returns per
rupee investment was also reported by Prasad
Rao and Bhupal Raj (2001) and Talathi et al.,
(2009).
Among the levels of phosphorus 150 % RDP
recorded significantly higher returns per rupee
investment (1.10) over 50 % RDP (1.02)
which was closely followed with 100 % RDP
(1.13). Similar findings were also reported by
Kumari et al., (2013) and Shahbaz et al.,
(2015).
References
Arivukkarasu and Kathiresan, R.M. 2007.
Weed management in rice based
376
Int.J.Curr.Microbiol.App.Sci (2020) 9(8): 367-378
application on growth, plant nutrient
uptake and yield of rice. Journal of
Agronomy. 6 (4): 586-592.
Kumari, Niru, Pal, S.K and Sheela. 2013.
Effect of organic nutrient management
on productivity and economics of
scented rice.Oryza.50 (3): 249-252.
Mehla, D.S and Panwar, D.V.S. 2000. Effect
of organic and inorganic fertility levels
on yield and yield components of
scented rice. Indian Journal of
Agricultural Sciences 7(3): 118 – 215.
Mondal, S.S., Acharya, D., Ghosh, A and
Thapa,
U.
2004.
Integrated
management of organic and inorganic
sources of nutrients to improve
productivity and qualitative characters
of rice and onion in rice-onion cropping
sequence. Environment and Ecology
22(1): 125-128.
Moola Ram, M.R. Davari and Sharma, S.N.
2011. Effect of organic manures and
biofertilizers on basmati rice (Oryza
Sativa L.) under organic farming of
rice-wheat
cropping
system.
Inernational Journal of Agriculture and
crop Sciences. 3(3):76-84.
Nanda, G., Sravan, U.S., Singh, A and Singh,
S.P. 2016. Effect of NPK Levels and
Bio-Organics on growth, yield and
Economics of Basmati Rice (Oryza
sativa L.) Cv HUBR 10-9. Environment
& Ecology 34(3): 1530-153
Nguyen,V.Q., Sharma, S.N and Gautam, R.C.
2002. Comparative study of organic
and traditional farming for sustainable
rice production. Omonrice, 10:74-78.
Panhwar, Q.A., Radziah, O., Rahman, Z.,
Sariah, M. and Razi, I.M. 2010. Role of
phosphate solubilizing bacteria on rock
phosphate solubility and growth of
aerobic rice. Journal of Environmental
Biology.32:607-612.
Prasad Rao and Bhupal Raj (2001). A text
book on guidelines for soil based
technologies
to
optimize
land
productivity in Andhrapradesh. Pp.56.
Priyadarsini, J. 2001. Yield and quality of rice
as affected by varieties of nitrogen
source. M.sc(Ag) Thesis submitted to
Acharya NG Ranga Agricultural
University, Hyderabad, India.
Ramesh Babu, P. V., Pulla Rao, Ch.,
Subbaiah, G., Veeraraghavaiah, R.,
Ashoka Rani, Y and Srininivas Rao, V.
2013. Effect of different levels of
nitrogen and phosphorus on growth and
yield of Kharif rice (Oryza sativa L.).
The Andhra Agricultural Journal. 60
(3): 755-759.
Roy, D.K and Singh, B.P (2006). Effect of
level and time of nitrogen application
with and without vermicompost on
yield, yield attributes and quality of
malt barley (Hordeum vulgare). Indian
Journal of Agronomy. 51: 40-42.
Sadasivam, S and Manickam, A. 1992.
Biochemical methods for Agricultural
Sciences. Wiley Eastern Limited. New
Delhi. 10-11.
Shahbaz, M., Rasul, F., Saghir, A., Junaid,
M.B., Mahaood, A and Ahmad.M.
2015. Bio-Economics and radiation use
efficiency of basmati, hybrid and coarse
grain (Oryza sativa). International
Journal of Agricultural Science 89(4):
150-158.
Sharma, G. D., Thakur, R. K., Chouhan, N.,
Sharma, B. L and Tiwari, D. K. 2015.
Effect of INM on yield, nutrient uptake,
protein
content
&
economic
performance of rice (Oryza sativa) and
soil fertility in a vertisol. Green
Farming 6(1): 50-54.
Siva Jyothi, V., Giridhara Krishna,T.,
Kavitha, P and Srinivasa Reddy. 2013.
Influence of levels of phosphorus, FYM
and Green manures on rice yield and
economics in a phosphorus rich
vertisol. The Andhra Agricultural
Journal. 60 (4): 828-831.
Talathi, M.S., Pinjari, S.S., Ranshur, N.J.,
377
Int.J.Curr.Microbiol.App.Sci (2020) 9(8): 367-378
Bhondave, T.S and Suryawanshi, J.S.
2009. Prouctivity an economics of rice
groundnut cropping system under
integrated
nutrient
management.
International Journal of Agricultural
Sciences. 5(2): 472-476.
Verghese, E.J. 1950. Standard procedure for
cooking rice for experimental purposes.
Madras Agricultural Journal.36 (6):
217-221.
Vijayan, R and Krishnasamy, V. 2014. Impact
of organic technics of seed crop
management on seed yield and quality
of Rice ADT 43. Academic journals, 9
(13): 611-618.
Yajie, Z., Jing-jing, H., Ya-chao, L.,
Yingying, C. and Jian-chang, Y. 2012.
Effect of phosphorus on grain quality of
upland and paddy rice under different
cultivation. Rice Science, 19 (2): 135142.
Yogesh,
TC.,
Viswanath,
AP.,
Themmegowda, P.(2013). Yield and
economics of aerobic paddy with
application of zinc, iron and microbial
inoculants. Journal of Environmental
Science and Technology 2:100-104.
How to cite this article:
Venkata Lakshmi, M., CH. Pulla Rao, P. V. N. Prasad, P. Prasuna Rani and Ashoka rani, Y.
2020. Yield, Quality Parameters and Economics
of rice as Influenced by Phosphorus
Management in Rice-Groundnut sequence. Int.J.Curr.Microbiol.App.Sci. 9(08): 367-378.
doi: />
378