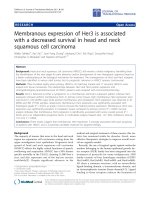
Proteoglycan-based diversification of disease outcome in head and neck cancer patients identifies NG2/CSPG4 and syndecan-2 as unique relapse and overall survival predicting factors
Bạn đang xem bản rút gọn của tài liệu. Xem và tải ngay bản đầy đủ của tài liệu tại đây (3.02 MB, 19 trang )
Farnedi et al. BMC Cancer (2015) 15:352
DOI 10.1186/s12885-015-1336-4
RESEARCH ARTICLE
Open Access
Proteoglycan-based diversification of disease
outcome in head and neck cancer patients
identifies NG2/CSPG4 and syndecan-2 as unique
relapse and overall survival predicting factors
Anna Farnedi1†, Silvia Rossi2†, Nicoletta Bertani2, Mariolina Gulli3, Enrico Maria Silini2,4, Maria Teresa Mucignat5,
Tito Poli6, Enrico Sesenna6, Davide Lanfranco6, Lucio Montebugnoli7, Elisa Leonardi1, Claudio Marchetti8,
Renato Cocchi9,10, Andrea Ambrosini-Spaltro1, Maria Pia Foschini1 and Roberto Perris2,5*
Abstract
Background: Tumour relapse is recognized to be the prime fatal burden in patients affected by head and neck
squamous cell carcinoma (HNSCC), but no discrete molecular trait has yet been identified to make reliable early
predictions of tumour recurrence. Expression of cell surface proteoglycans (PGs) is frequently altered in carcinomas
and several of them are gradually emerging as key prognostic factors.
Methods: A PG expression analysis at both mRNA and protein level, was pursued on primary lesions derived from
173 HNSCC patients from whom full clinical history and 2 years post-surgical follow-up was accessible. Gene and
protein expression data were correlated with clinical traits and previously proposed tumour relapse markers to stratify
high-risk patient subgroups.
Results: HNSCC lesions were indeed found to exhibit a widely aberrant PG expression pattern characterized by a
variable expression of all PGs and a characteristic de novo transcription/translation of GPC2, GPC5 and NG2/
CSPG4 respectively in 36%, 72% and 71% on 119 cases. Importantly, expression of NG2/CSPG4, on neoplastic cells
and in the intralesional stroma (Hazard Ratio [HR], 6.76, p = 0.017) was strongly associated with loco-regional
relapse, whereas stromal enrichment of SDC2 (HR, 7.652, p = 0.007) was independently tied to lymphnodal infiltration
and disease-related death. Conversely, down-regulated SDC1 transcript (HR, 0.232, p = 0.013) uniquely correlated with
formation of distant metastases. Altered expression of PGs significantly correlated with the above disease outcomes
when either considered alone or in association with well-established predictors of poor prognosis (i.e. T classification,
previous occurrence of precancerous lesions and lymphnodal metastasis). Combined alteration of all three PGs was
found to be a reliable predictor of shorter survival.
Conclusions: An unprecedented PG-based prognostic portrait is unveiled that incisively diversifies disease course in
HNSCC patients beyond the currently known clinical and molecular biomarkers.
Keywords: Proteoglycans, Squamous cell carcinoma, Biomarker, NG2/CSPG4, Tumour relapse
* Correspondence:
†
Equal contributors
2
COMT – Centre for Molecular Translational Oncology & Department of Life
Sciences, University of Parma, Parma, Italy
5
S.O.C. of Experimental Oncology 2, The National Tumour Institute Aviano CRO-IRCCS, Aviano, Pordenone, Italy
Full list of author information is available at the end of the article
© 2015 Farnedi et al.; licensee BioMed Central. This is an Open Access article distributed under the terms of the Creative
Commons Attribution License ( which permits unrestricted use, distribution, and
reproduction in any medium, provided the original work is properly credited. The Creative Commons Public Domain
Dedication waiver ( applies to the data made available in this article,
unless otherwise stated.
Farnedi et al. BMC Cancer (2015) 15:352
Background
Head and neck squamous cell carcinomas (HNSCC)
have an estimated frequency of 38,160 new cases in the
US (updated to August, 2014) [1] and an estimated occurrence of more than 442,000 new cases worldwide according to GLOBOCAN 2012 [2,3], thereby representing
the primary lethal cancer entity in patients with head
and neck tumours. Loco-regional relapsing is the most
severe clinical problem encountered in these tumours,
while the pre-operative presence of lymphnodal infiltration is a recognized prognostic factor [4,5]. Especially in
patients presenting smaller primary lesions, occult secondary lesions in lymphnodes significantly complicate
the clinical management of these individuals [6-13]. The
currently adopted methods to predict disease recurrence,
such as staging and grading, are too arbitrary and do not
allow for a sufficiently accurate clinical stratification of
the patients [14,15]. This deficit calls upon the need to
identify distinct molecular markers that more reliably
would predict disease progression, recurrence and metastasis formation, and many such have been proposed
over the last decade (Table 1). Thus far, however, only
three such markers have been considered as meaningful,
i.e. HPV infection, TP53 mutation status and overexpression of EGFR [16-20], but their full independence
from clinical parameters is still dubious.
One class of molecules with the potential of acting as
clinically relevant factors in HNSCC, especially for oral
cavity and oropharynx cancer, is that comprising cell
surface-associated proteoglycans (PGs). In fact, changes in
their relative expression are progressively being associated
with neoplastic transformation, propagation of local
tumour masses, and formation of distant metastases. This
not only in HNSCC, but also in numerous epithelial and
non-epithelial tumour types. Both PGs produced by the
HNSCC cells themselves and PGs associated with the
intra-lesional tumour stroma may play critical roles in the
control of HNSCC growth, dissemination and therapeutic
refraction, and may therefore be contemplated as putative
biomarkers as well as therapeutic targets. There are currently 15 cell surface PGs known in the human genome
with the most representative ones belonging to either the
transmembrane syndecan group, i.e. syndecan-1-4 (SDC1SDC4) [21-25], or the GPI-anchored glypican group, i.e.
glypican-1-6 (GPC1-GPC6) [23,26-28]. The unique structural traits of cell surface PGs enable them to modulate
directly and/or indirectly several facets of the tumour cell
phenotype and behavior, including growth kinetics, invasiveness and metastatic ability.
Previously documented, representative examples of the
implication of diverse PGs expressions for disease outcome are afforded by the recently consolidated tumoursuppressing effect of GPC5 in lung carcinomas arising in
“never smokers” [29-31], as well as by the well-established
Page 2 of 19
prognostic/predictive up-regulation of GPC1 in pancreatic
cancer [32,33]. As a corollary, GPC3 is a recognized
prognostic/predictive factor and therapeutic target in
hepatocellular carcinoma [34-37]. SDC1, the only PG for
which there is some documentation in oral squamous cell
carcinoma, seems to be associated with the differentiation
status of the tumour cells [38-40]. Clinical correlation of
SDC1 expression with disease status specifically refers to
its modulation in epithelial neoplastic cells [41-47] and
tumour stroma [48], while the PG has been proposed to
influence migration and invasion of oral squamous cell
carcinoma cells in vitro by interacting with the β1 integrin
subunit and the laminin β1 chain [48].
NG2/CSPG4 has been proposed to impact on tumourigenesis and evidence has been accrued suggesting that
NG2/CSPG4 alone is able to confer metastatic potential
to cancer cells by serving as a multivalent mediator of
the cancer cell-host microenvironment interactions and
by enhancing drug resistance and protecting cells from
stress-induced programmed cell death [49,50]. In an
increasing number of tumours, prognostic implications
of NG2/CSPG4 are being unveiled and these discoveries
accentuate the potential of the PG as a therapeutic target.
Recently, a direct link between methylation and CSPG4
expression in HNSCC HPV-negative/stage IVa subgroup
were proved, where high protein expression and low promoter methylation were significantly associated with an
adverse progression-free and overall survival [51].
Based upon previously accrued information about the
role of PGs in cancer and the currently available experimental evidences along this line, we have addressed the
possibility that the pattern of expression of individual
PGs, or groups of PGs, may act as either pro- or antitumourigenic and thereby be predictive, or indicative,
of a discrete disease course in oral cavity HNSCC disease course.
Methods
Patients
Patients from whom surgical specimens were evaluated
were treated surgically at the S. Orsola-Malpighi Hospital,
at the Bellaria University Hospital in Bologna and at
the Maxillo-Facial Surgery Division, Department of
Head and Neck Surgery of the University of Parma. A
total of 173 surgical specimens of primary oral cavity
HNSCC were collected after informed consent obtained from each enrolled patients, all of them in
adulthood (Additional file 1: Table S1; Additional file 2:
Figure S1). Patients were referred to adjuvant radiation
therapeutic treatment according to the guidelines defined
by the National Comprehensive Cancer Network (NCCN)
Clinical Practice (Version 2.2014; www.nccn.org). Clinical
data were collected within the 2 years-post surgical
follow-up every 6 months (Additional file 3; Additional file
Farnedi et al. BMC Cancer (2015) 15:352
Page 3 of 19
Table 1 Previously proposed prognostic biomarkers in HNSCC1
Biomarker2 Clinical outcome
Method of
detection
N. of cases/%/type of
modulation
Annotation
ADAM17
Lymph nodal metastasis/Loco-regional
relapse
IHC/WB
50/46/Up
None
CD44
OS/DFS
IHC
138/59/Down
None
E-cadherin
Recurrence/OS
IHC
50/20/Up 112/59/Down
None
EGFR
OS
IHC
109/73/Up 59/58/Up
None
EstrogenR2
OS
IHC/nPCR +
sequencing
67/51/Up
Laryngeal/hypopharingeal cancer
FHIT
OS/DFS
IHC
53/61/Down
None
GLUT1
OS
IHC
40/26/up
Poor radiation response
HIF1A
OS/DFS
IHC
85/63/Down
None
Keratin-18
OS
IHC
308/54/Up
None
Keratin-8
OS
IHC
308/54/Up
None
Laminin γ2 DSS
DNA Microarray
119/NS/Up
None
MCM5
OS
IHC
97/61/Up
None
MET
OS
IHC
69/82/Up
None
Moesin
OS
IHC
103/NS/Up
Cytoplasmic expression pattern
Mucin-1
OS/DFS/Lymphnodal metastasis
IHC
206/39/Up
Within 5-years follow-up
Mucin-4
OS/DFS/Lymphnodal metastasis/Locoregional relapse
IHC
150/41/Up
Within 5-years follow-up
p21
OS
IHC
192/71/Down
None
p27
DFS
IHC
192/80/Down
Only in patients with lymphnodal
infiltration
p57
OS
IHC
67/87/Down
None
p63
OS
IHC
62/NS/Up
None
P-cadherin
Disease recurrence/Loco-regional relapse/
OS
IHC
50/20/Down 67/45/Down 108/
16/Down
None
Podoplanin DSS
IHC
35/56/Up
None
Rb
DFS
IHC
220/49/Down
Only in p53+/pRb− patients
RUNX3
OS
IHC/WB
108/46/Down
None
S100A2
DFS/Cervical metastasis
RT-PCR + seq/IHC
135/26/Down 52/NS/Down
Nuclear expression pattern
SPARC
OS/DFI
DNA Microarray/
IHC
62/NS/Up
None
STAT1
OS
IHC
89/NS/Up
None
Survivin 3α OS
RT-PCR
97/NS/Up
Only in lymphnodes
TERT
OS
IHC
62/NS/Up
None
Ezrin
OS
IHC
47/85/Up
Cytoplasmic expression pattern
1
Specifically referred to oral and oropharyngeal squamous cell carcinoma;
Alterations of TP53, CCND1 and FGFR4 genes are not included;
Abbreviations: OS, Overall Survival; DFS, Disease Free-Survival; DSS, Disease Specific-Survival; DFI, Disease Free-Interval; IHC, Immunohistochemistry; WB, Western
Blotting; nPCR, nested Polymerase Chain Reaction; NS, Not Specified.
2
2: Figure S1). The present study has been approved by the
local ethics committees (Comitato Etico Provinciale di
Parma –Parma University Hospital e Comitato Etico
Provinciale di Bologna-Bologna University Hospital)
and was conducted in compliance with the Helsinki
Declaration’s Ethical Principles for Medical Research
Involving Human Subjects.
RNA extraction and qPCR
Total RNA from healthy specimens and 119 neoplastic
specimens were extracted using Trizol® according to the
manufacturer’s instructions and in combination with
Qiagen RNAeasy Mini Kit (Qiagen). Total RNA (1 μg)
was reverse-transcribed with the QuantiTect® Reverse
Transcription Kit (Qiagen). Each TaqMan Low Density
Farnedi et al. BMC Cancer (2015) 15:352
Array was designed for quantification of the human
PGs. The assays were chosen among the TaqMan Gene
Expression Assay library (Additional file 3) and the cards
were run on ABI PRISM 7900 HT Fast Real-Time PCR
System (Applied Biosystems Inc., Foster City, CA, USA).
Changes in gene expression levels were calculated using
the “relative quantification method”. Relative gene expression fold-change were expressed as Log_2(2^-ΔΔCt) and to
visualize the obtained expression profiles we used heatmap
graphing by EPCLUST – Expression Profile data CLUSTering and analysis software (www.bioinf.ebc.ee/EP/EP/
EPCLUST/) [52]. The data presented herein have been deposited in NCBI’s Gene Expression Omnibus [53] and are
accessible through GEO Series accession number
GSE33788 ( />acc=GSE33788) (Additional file 3).
Tissue microarray (TMA) construction
Tissue specimens form a total of 163 patients, which
were independently assured to contain representative
areas of the neoplastic lesions, were selected for TMA
construction according to a previously described procedure [54,55]. Cases were considered representative when at
least 50% of the section was composed of neoplastic cells.
For each case, the core portion of the section with the
highest percentage of tumour cells was used for analysis
(Additional file 3).
Immunohistochemistry
Details on the antibodies used, characteristics of control tissues and experimental procedures are reported
in Additional file 3. Relative antigen expression was
assessed semi-quantitatively according to the arbitrary
scoring: “-” = no positive cells were detected, “+” <10%
of cells were positive, ≥10% “++” <50% of cells were
positive, ≥50% “+++” <90% of cells were positive, and
“++++” ≥90% of cells were positive.
Statistical and bioinformatic analyses
Demographic data, presence of recognized risk factors for
development of HNSCC, clinical diagnostic parameters,
gene expression and protein distribution patterns for
the PGs GPC1-6, SDC1-4 and NG2/CSPG4 were comparatively evaluated for their potential correlation with
the following disease outcomes: loco-regional recurrence,
lymphnodal metastasis, distant metastasis, disease-related
deaths and probability of incurring into one or more of
these clinical outcomes. Estimation of influence of each
variable considered for the above disease outcomes was
analyzed independently with both the Log-rank and
Wilcoxon’s rank test. Survival rate was estimated using
the Kaplan-Meier method from the time of surgery to the
end of the follow-up. Cox’s multivariate proportional hazards regression method was used to extract a parsimonious
Page 4 of 19
set of independent variables. All analyses were performed
using the Statgraphics Centurion XVI software (StatPoint
Technologies, Inc, Virginia, USA). P values <0.05 were considered to be significant (Additional file 3).
Results
Transcriptional profiles of PGs in primary oral cavity
HNSCC lesions
Analyses of the relative mRNA expression levels of the
eleven prevalent cell surface-associated PGs conducted
on a total of 119 primary oral cavity HNSCC lesions revealed that 3 of the PGs, including NG2/CSPG4, GPC2
and GPC5, were de novo expressed in neoplastic cells,
i.e. were not detectable in the healthy control tissues, but
were detectable in cancer cells. These were transcribed
in 71% (NG2/CSPG4), 36% (GPC2) and 72% (GPC5) of
the lesions, respectively. The remaining 8 PGs, for
which transcripts were expressed at a frequency of 84%
(GPC1), 86% (GPC3), 88% (GPC4), 70% (GPC6), 100%
(SDC1), 94% (SDC2), 93% (SDC3) and 95% (SDC4) of
the tumour cases, respectively, were found to be differently modulated. Thus, SDC2, SDC3 and SDC4 were
up-regulated in 79-84% of the patients, whereas GPC4
was enhanced in 11% and GPC3 in 57% of the specimens. However, GPCs were more frequently downregulated (GPC3, 22%; GPC4, 21%; GPC1, 24%; and
GPC6 30%) than SDCs (SDC1, 8%; SDC2, 8%; SDC3, 11%;
and SDC4, 7%; Figure 1a; Additional file 4: Table S2).
We next compared the PG expression patterns exhibited by discrete groups of patients differentiated by
tumour staging, i.e. T1-T2/N- versus T1-T2/N+ and T3T4/N- versus T3-T4/N+. GPC2 was expressed in a mere
19% of the T3-T4/N- classified lesions, whereas it was a
two-fold more frequently transcribed in patients belonging to the other three classes (T1-T2/N-, 36%, T1-T2/N
+, 40% and T3-T4/N+, 42%). GPC5 and NG2/CSPG4
were detectable in samples of a large proportion of patients, ranging from 62% in T3-T4/N- to 80% in T1-T2/
N-, but their relative expression levels did not discriminate between the above patient subsets (Figure 1b). GPC1
was similarly differently expressed in the distinct groups
of patients with a 1.5-fold higher frequency in the T3T4/N- patients compared to the other patient subsets.
GPC4 was down-regulated in about 27% of the T1-T2/
N- and T3-T4/N+ subgroups, and <13% in the T1-T2/N
+ and T3-T4/N- patient subgroups (Figure 1b). Syndecans were generally up-regulated in most of the lesions
(Figure 1b), with SDC4 showing enhanced expression in
100% of T1-T2/N+ patients.
Immunolocalization of PGs in oral cavity HNSCC lesions
Intralesional distribution of PGs was further examined in
oral cavity HNSCC lesions and control healthy tissue
using empirically validated, pre-selected antibodies against
Farnedi et al. BMC Cancer (2015) 15:352
Page 5 of 19
Figure 1 Cell surface-associated PGs are differentially expressed in primary lesions of oral cavity HNSCC patients. (a) Heat map and hierarchical
clustering of the relative expression levels (columns) of the 8 most modulated cell surface-associated PGs in primary lesions of 119 oral cavity
HNSCC patients (rows): red, up-regulation; green, down-regulation, black: no change in comparison to the healthy epithelial tissue. Distance between
clusters was calculated as reported in Additional file 3. (b) PG expression profiles in oral cavity HNSCC specimens derived from T1-T2-N-, T1-T2-N+, T3T4-N- and T3-T4-N+ graded tumours. SDC1-4, syndecans 1–4; GPC1-6, glypicans 1–6.
each of the PGs (Figure 2; Figure 3; Additional file 5:
Figure S2). The percentage of cases in which GPCs
could be disclosed on the epithelial neoplastic cells varied from 18% (30 out of 163 cases) for GPC3 to 72%
for GPC1 (118 out of 163 cases; Table 2). Relative frequency of expression was in the order: GPC1 > GPC4
(41%; 67 out of 163 cases) > GPC6 (37%; 61 out of 163
cases) > GPC3. GPCs were often detected within the
cytoplasm as well as on the cell membrane, consistent
with their thoroughly described internalization and
recycling patterns. The hybrid cell membrane/cytoplasmic
distribution of these PGs was characteristically observed
for GPC1, GPC3 and GPC4, with GPC1 being most
strongly associated with these two cellular compartments
Farnedi et al. BMC Cancer (2015) 15:352
Page 6 of 19
Figure 2 In situ immunolocalization of GPCs and NG2/CSPG4 in oral cavity HNSCC primary lesions. Representative patterns of GPC and NG2/
CSPG4 distribution in oral cavity HNSCC lesions. (a, b) representative views of GPC1 expression in lesions with different degrees of keratinizing
neoplastic cells. (c, d) representative images of GPC1 expression in stromal cells of pre-malignant lesions (c) and lack of expression in the stromal
cells of HNSCC tissue (d). GPC3 was detected in neoplastic cells (e), but not stromal fibroblasts (f), whereas GPC4 (g) and GPC6 (h) were primarily
found to be associated with the neoplastic cells. (i) Shows the lack of expression of GPC6 in the intralesional stroma. NG2/CSPG4 was found to
be abundantly expressed in both well- (k) and moderately-differentiated (l) oral cavity HNSCC lesions, whereas it was similarly absent from potentially pre-malignant lesions (j).
in keratinizing neoplastic cells (Additional file 5: Figure
S2). GPC3 was entirely absent in healthy tissue, while
GPC4 showed a widespread distribution both on normal
epithelial cells and in the intralesional stromal compartment (Additional file 5: Figure S2). GPC6 appeared to be
preferentially retained within intracellular vesicles (Figure 2),
as deduced by the appearance of GPC6-positive granules
throughout the cytoplasm of neoplastic cells. This seemed
rather specific for tumour cells since it was not observed in
healthy epithelial cells (Additional file 5: Figure S2). GPC1
and GPC6 were rarely seen in the intralesional stroma of
oral cavity HNSCC lesions (13 out of 163 and 16 out of 163
of the cases, respectively), whereas GPC3 was consistently
absent from this compartment and GPC4 showed a somewhat more frequent expression in stromal cells (19%; 31
out of 163 of the cases; Table 2; Figure 2).
Farnedi et al. BMC Cancer (2015) 15:352
Page 7 of 19
Figure 3 Immunodetection of SDCs in oral cavity HNSCC primary lesions. Representative view of the SDC1 expression pattern, inversely correlating with
the overall differentiation status of the tumour (a, displatyc tissue; b, c, well-differentiated; d, poorly differentiated), while being particularly abundant in the
center of neoplastic nests (p) and in the stromal compartment (e-f). SDC2 was seen strongly associated with tumour vessels (g, n, o) and was the only PG
to be widely expressed in the different degree of dysplastic tissue (h-j). SDC3 (k) and SDC4 (m) immunolocalized in the epithelial tumour cells, but not in
the stromal compartment (l, SDC3; m, SDC4).
HNSCC lesions showed variable expression of SDCs
with a relative frequency of positive cases decreasing in
the order: SDC1 > SDC3 > SDC4 > SDC2 (Table 2). In
fact, a total of 149 cases out of 163 lesions that were
evaluated for the in situ expression of the SDC1/CD138
protein had epithelial neoplastic cells presenting the PG
on the cell surface, or in intracellular locations (Figure 3).
In contrast, a mere 57 (35%), 32 (19.6%), and 19 (12%)
out of 163 examined lesions had epithelial neoplastic
cells staining positively for respectively SCD2, SDC3 and
SDC4 (Table 2). The relative number of cancer cells that
expressed these PGs in each lesion markedly differed
and a similar divergence was seen in terms of subcellular
localization of the molecules. Thus, neoplastic cells with
plasma membrane-associated SDC1 were mainly keratinizing cells located at the center of the neoplastic nests
Farnedi et al. BMC Cancer (2015) 15:352
Page 8 of 19
Table 2 Patterns of the in situ distribution of PGs in HNSCC lesions (% of cases)
PG
GPC1
GPC3
GPC4
GPC6
SDC1
SDC2
SDC3
SDC4
NG2/CSPG4
Tumor cell positivity1
Overall staining intensity2
-
(27.5)
Subcellular localization3
-
(27.6)
Membrane
Stromal expression
-
-
(92.0)
+
(29.2)
+
(33.1)
Cytoplasmic
-
+
(6.7)
++
(33.1)
++
(30.1)
Both
(72.4)
++
(0.6)
+++
(7.4)
+++
(6.7)
+++
(0.6)
++++
(2.5)
++++
(2.5)
++++
-
-
(81.6)
-
(81.6)
Membrane
-
-
(100.0)
+
(14.1)
+
(14.1)
Cytoplasmic
-
+
-
Both
(18.4)
++
(3.1)
++
(4.3)
+++
(1.2)
+++
-
++++
-
++++
-
-
(58.9)
-
(59.5)
Membrane
-
++
-
+++
-
++++
-
-
(81.0)
+
(20.9)
+
(14.1)
Cytoplasmic
(40.5)
+
(5.5)
++
(19.0)
++
(25.8)
Both
-
++
(12.9)
+++
(1.2)
+++
(0.6)
+++
(0.6)
++++
-
++++
-
++++
-
-
(62.2)
-
(62.6)
Membrane
-
-
(90.2)
+
(30.1)
+
(31.9)
Cytoplasmic
(37.4)
+
(9.8)
++
(7.4)
++
(5.5)
Both
-
+++
-
+++
-
++++
-
++++
-
-
(8.6)
-
(8.6)
Membrane
(42.9)
++
-
+++
-
++++
-
-
(79.1)
+
(31.3)
+
(25.8)
Cytoplasmic
(37.4)
+
(9.2)
++
(33.7)
++
(50.3)
Both
(10.4)
++
(10.4)
+++
(22.1)
+++
(10.4)
+++
(1.2)
++++
(4.3)
++++
(4.9)
++++
-
-
(88.3)
-
(88.3)
Membrane
(1.8)
-
(26.4)
+
(6.7)
+
(8.0)
Cytoplasmic
(8.6)
+
(20.2)
Both
-
++
(25.8)
+++
(21.5)
++
(4.3)
++
(3.1)
+++
(0.6)
+++
(0.6)
++++
-
++++
-
-
(65.0)
-
(65.0)
Membrane
-
++++
(6.1)
-
(100.0)
+
(27.0)
+
(28.2)
Cytoplasmic
-
+
-
++
(6.1)
++
(6.7)
Both
(34.4)
++
-
+++
(1.8)
+++
-
+++
-
++++
-
++++
-
++++
-
-
(80.4)
-
(80.4)
Membrane
-
-
(100.0)
+
(16.0)
+
(19.6)
Cytoplasmic
-
+
-
++
(3.7)
++
-
Both
(17.8)
+++
-
+++
-
++++
-
++++
-
-
(34.2)
-
(34.2)
Membrane
(62.6)
++
-
+++
-
++++
-
-
(96.7)
+
(38.8)
+
(36.8)
Cytoplasmic
-
+
(3.3)
++
(21.7)
++
(19.7)
Both
-
++
-
+++
(2.6)
+++
(7.2)
+++
-
Farnedi et al. BMC Cancer (2015) 15:352
Page 9 of 19
Table 2 Patterns of the in situ distribution of PGs in HNSCC lesions (% of cases) (Continued)
++++
(2.6)
++++
(2.0)
++++
-
PG expression was assessed semi-quantitatively according to the arbitrary scoring: “-”, no positively staining cells were detected; “+”, <10% of cells were positive;
“++”, ≥10% and <50% of positive cells; “+++”, ≥50% and <90% of positive cells; “++++”, ≥90% of positive cells;
2
Refers to the average staining intensity within the examined lesion, according to the arbitrary scoring: “-” = absent; “+”, faint; “++”, weak; “+++”, moderate;
“++++”, strong;
3
Immunostaining was prevalently cell membrane-associated (“Membrane”) or diffuse cytoplasmatic (“Cytoplasmic”).
1
(Figure 3). Fibroblasts of the tumour stroma that surrounded the neoplastic nests were positive for SDC1 in
34 out of 163 (21%) of the tumours. In 14 out of 163 of
the lesions (8.6%), SDC2 was immunolocalized within
the cytoplasm of neoplastic cells, while it appeared widespread in the stromal cells of the majority of the lesions
(73.6%, 120 out of 163 of the cases; Figure 3) and was
particularly enriched in lesions containing desmoplastic
stroma. Intriguing was the fact that in 100% of the
lesions, SDC2 could be observed in the wall of both normal and intra-lesional blood vessels, suggesting that it
was associated with both endothelial and neovascular
pericytes (Figure 3). In contrast to SDC1 and SDC2,
both SDC3 and SDC4 were undetectable in the healthy
epithelium, or the tumour stroma, but could be immunolocalized both subcellularly and on defined portions
of the cell surface of neoplastic cells, with a particular
concentration in focal plaque-like structures (Figure 3;
Additional file 5: Figure S2). Finally, the diversity of
SDCs expressions in oral cavity HNSCC lesions was
even more remarkable when considering the relative
distribution of these PGs in the stromal compartment.
In this case, the frequency of occurrence of the PGs was
largely reversed with respect to that seen in the cancer
cells and decreased in the order: SDC2 > SDC1 > SDC3 =
SDC4 (Table 2). Deviating from the pronounced intracellular distribution of SDC3 and SDC4 was that of NG2/
CSPG4 which showed an exclusive cell membrane
localization in all samples in which the PG could be disclosed (63%). NG2/CSPG4 was rarely detected in the stromal compartment (5 out of 163; Table 2; Figure 2), where,
if occurring, was concentrated on the membrane of basal
cells (Additional file 5: Figure S2).
Altered expression of discrete PGs correlates with disease
outcome
All demographic and clinical-pathological traits of the
patients were initially compared by univariate analysis of
the cumulative PG expression data, except for patient categories comprised of less than 13 patients (independently
defined as a cut-off level of “statistical” exclusion). In these
correlation analyses we considered five primary disease
outcomes, including loco-regional tumour recurrence,
lymphnodal metastasis, distant metastases, disease-related
death and a situation in which at least one of the former
disease outcomes was manifested (Table 3).
In order to test whether there is a relationship between
PGs transcript and protein expressions and clinicopathological parameters, a Chi-Square test was applied and just
three such correlation resulted statistically significant: N
classification and SDC2 stromal positivity, p = 0.002; alcohol consumption and SDC1 mRNA up-regulation, p =
0.021, and presence of precancerous lesion and SDC1
mRNA up-regulation, p = 0.016.
Although radiation therapy and excessive alcohol consumption independently correlated with one or more of
the above clinical outcomes (Table 3), these parameters
were not considered in the multivariate logistic regression
analyses because of being potentially confounding indicators. The first because almost all patients presenting
lymphnodal infiltrations had been routinely subjected to
radiation therapy, the second because, despite of its wellrecognized importance as a risk factor in HNSCC, the
admission of this habit was measured by a self-provided
questionnaire and no details were available on the accuracy of the information provided by the patients. A further
consideration is that self-reported excessive alcohol intake
is often denied, causing underestimation of the cohort of
patient that may fall under this “risk category”.
Advanced T classification (p = 0.007), T3-T4 grouping
(p = 0.001; Figure 4), positive NG2/CSPG4 transcript
expression (p = 0.029; Figure 4), or GPC1 positivity in
stromal cells (p = 0.007) were all conditions strongly associated with a high loco-regional tumour relapse rate
(Table 3). Stromal GPC6 expression could, however,
not be included as a parameter in the multivariate
logistic regression model due to the low number of
cases contained within this category and the borderline
statistical significance in univariate analyses (p = 0.058).
Application of the Cox proportional hazard model
revealed that T3-T4 classification of the tumour (HR,
6.36, p = 0.001) and de novo expression of NG2/CSPG4
mRNA (HR, 6.76, p = 0.017) were independent, robust
prognostic factors for local tumour recurrence (Table 4;
Figure 5). If combining T-grouping and mRNA expression of NG2/CSPG4, the probability to develop a secondary loco-regional lesion was further increased (p < 0.001;
Table 3; Figure 4).
Significant correlations with post-surgical lymphnodal
metastases were further disclosed between gender (p =
0.043), the presence of precancerous lesions (p = 0.003;
Figure 4), the occurrence of lymphnodal infiltration at
time of surgery (p = 0.001), stromal expression of SDC2
Farnedi et al. BMC Cancer (2015) 15:352
Page 10 of 19
Table 3 Univariate analysis of PG expression in relation to known prognostic indicators
Clinical outcomes
Loco-regional
N. of
recurrence
cases
%
p
cases value
Prognostic indicator/PG
Lymphnodal
metastasis
Distant
metastasis
Diseaserelated death
Any of the
clinical outcomes1
%
cases
%
cases
%
cases
% cases
p
value
p
value
p
value
p value
Prognostic indicator
Sex
Age
Smoking
Alcohol2
Familial cancer history
Precancerous lesions
Tumor site
T classification
N classification
Differentiation Degree
Radiotherapy
Male
99
14.1
Female
74
7.0
≤45 yrs
17
11.8
>45 yrs
156
12.2
No
66
13.6
Yes
105
11.4
No
83
10.8
Yes
88
13.6
No
144
12.5
Yes
27
11.1
0.342
15.2
0.043
5.4
0.689
11.8
9.1
0.964
8.4
0.466
10.4
0.231
5.8
9.1
4.8
0.615
9.7
0.718
0.146
12.1
0.026
0.109
6.0 <0.001
18.8
0.876
31.3 0.994
33.3
No
121
12.4
51
11.8
OC
156
12.2
OP
14
7.1
OC+OP
3
33.3
T1
51
3.9
T2
60
8.3
8.3
16.7
21.7
30.0
T3
17
23.5
17.6
5.9
23.5
47.1
T4
45
22.2
T1-T2
111
6.3
0.530
11.5
9.8
0.204
0.0
7.8
15.6
0.001
8.1
0.776
2.0
9.9
0.001
5.2
5.9
66.7
0.038
26.7
0.957
17.6 0.018
42.2
0.043
62
22.6
97
9.3
Positive
76
15.8
Well
20
15.0
Moderate
50
16.0
12.0
14.0
18.0
36.0
Poor
78
7.7
12.8
7.7
16.7
30.8
No
83
8.4
90
15.6
SDC1
↓/=
61
11.5
↑
58
13.8
SDC2
↓/=
19
5.3
↑
100
14.0
SDC3
↓/=
24
8.3
↑
95
13.7
SDC4
↓/=
19
5.3
↑
100
14.0
GPC1
=
62
12.9
↓/↑
57
12.3
=
76
10.5
5.2
18.4
0.441
0.082
0.0
4.8
25.8
24.3 0.005
T3-T4
0.079
9.7
14.4
31.4 0.399
21.4
Negative
Yes
16.1
0.858
33.3
0.073
11.1
0.065
17.9
28.1 0.305
37.3
21.4
0.0
0.326
0.869
19.6
7.1
33.3
0.007
10.3
18.2
21.7 0.012
39.8
18.5
0.970
25.8 0.253
34.3
29.5
0.880
17.6 0.184
32.7
Yes
21.6
9.9
5.9
36.4 0.094
24.3
21.9
11.1
0.003
0.155
19.9
14.8
14.8
0.869
-
10.5
13.6
0.732
0.0
22.2
13.5
10.9
12.4
0.521
0.847
9.5
10.9
0.689
10.1
0.016
15.8
0.223
0.005
16.7
5.0
3.6
43.5
9.3 <0.001
30.3
0.392
0.007
15.6
15.0
19.6 <0.001
46.1
0.952
8.4 <0.001
27.8
20.0 0.44
20.5 0.002
41.1
3
PG (mRNA)
GPC2
0.553
6.6
0.396
10.3
0.253
5.3
8.3
5.3
6.5
6.6
5.3
12.9
10.5
10.5
20.8
15.8
17.7
21.1
25.0 0.352
32.6
0.780
26.3 0.601
32.0
0.940
19.3
0.596
15.8 0.104
34.0
0.855
19.0
0.668
21.3 0.013
41.4
0.314
17.9
0.329
10.5
0.363
0.036
20.0
0.193
13.0
0.502
10.5
0.393
4.2
11.5
25.9
0.329
13.7
0.519
9.0
0.803
5.3
13.0
0.896
8.4
0.253
0.016
19.0
0.519
9.0
0.405
4.9
32.3 0.625
29.8
0.335
27.6 0.307
Farnedi et al. BMC Cancer (2015) 15:352
Page 11 of 19
Table 3 Univariate analysis of PG expression in relation to known prognostic indicators (Continued)
GPC3
GPC4
GPC5
GPC6
NG2/CSPG4
De novo
43
16.3
↓
26
7.7
11.6
0.437
0.0
14.0
0.219
11.5
14.0
0.378
11.5
37.2
0.303
23.1 0.624
=
25
20.0
12.0
4.0
12.0
32.0
↑
68
11.8
10.3
14.7
23.5
33.8
=
81
11.1
↓/↑
38
15.8
=
33
12.1
De novo
86
12.8
↓
36
19.4
=
24
8.3
↑
59
10.2
=
34
2.9
De novo
85
16.5
0.598
7.4
0.647
10.5
0.995
9.1
8.3
0.851
0.994
0.241
8.3
0.495
8.2
8.8
15.2
16.7
0.609
12.9
14.7
30.3 0.986
31.4
0.838
36.1 0.824
29.2
20.3
0.487
33.3 0.348
26.3
16.7
15.3
0.914
0.308
19.8
8.3
8.5
8.8
6.1
21.0
13.2
14.0
8.3
0.029
0.365
7.9
8.1
0.351
13.6
28.8
0.401
20.0
20.6 0.077
35.3
PG (Protein)4
SDC1 Tumor cells
Stroma
SDC2 Tumor cells
Stroma
SDC3 Tumor cells
SDC4 Tumor cells
GPC1 Tumor cells
Stroma
GPC3 Tumor cells
GPC4 Tumor cells
Stroma
GPC6 Tumor cells
Stroma
NG2/CSPG4 Tumor cells
T group/NG2/CSPG4 mRNA5
Negative
14
7.1
Positive
149
13.4
Negative
129
13.2
Positive
34
11.8
Negative
143
13.3
Positive
19
10.5
Negative
43
9.3
Positive
120
14.2
Negative
106
13.2
Positive
56
12.5
Negative
131
15.3
Positive
32
3.1
Negative
44
11.4
Positive
108
13.6
Negative
149
11.4
Positive
13
30.8
Negative
133
12.8
Positive
30
13.3
Negative
96
13.5
Positive
66
12.1
Negative
131
13.0
Positive
31
12.9
Negative
101
12.9
Positive
61
13.1
Negative
146
11.6
Positive
16
25.0
Negative
52
15.4
Positive
100
12.0
T1-T2/=
21
T1-T2 / De
novo
49
0.447
0.962
0.312
11.6
0.783
11.9
0.812
2.3
0.875
12.3
0.015
13.0
0.793
15.9
0.329
12.1
0.340
12.0
0.884
10.2
0.841
11.5
0.493
6.9
0.692
12.3
0.010
9.6
14.0
0.957
4.4
8.4
9.6
9.2
9.2
5.9
0.599
10.3
0.214
9.6
10.0
2.3
17.9
17.6
15.6
0.319
16.8
0.001
18.4
0.758
17.3
0.588
18.3
0.602
15.8
0.012
18.5
0.834
17.3
21.0
33.1 0.605
26.7
0.716
33.3 0.794
30.3
0.771
32.8 0.810
29.0
0.222
27.7 0.102
39.3
0.844
18.8
0.923
30.9 0.104
46.2
23.0
-
31.8 0.825
32.2
19.4
0.052
32.8 0.649
28.1
18.8
0.900
30.2 0.575
35.7
15.6
0.928
14.0 0.002
38.3
38.5
0.584
30.8 0.385
42.1
18.9
0.0
0.406
0.792
21.9
14.8
6.3
0.665
9.2
18.9
31.0 0.429
35.3
19.6
9.7
19.7
0.058
0.655
8.7
12.9
0.860
8.5
0.294
24.2
6.3
13.0
0.860
0.062
15.4
10.0
0.969
2.3
17.1
35.7 0.947
31.5
15.8
10.7
7.7
0.805
0.303
9.4
10.2
0.007
8.4
0.269
23.5
10.7
6.3
0.653
0.998
11.7
10.7
0.071
9.3
7.1
19.5
15.8
15.0
0.923
0.769
8.8
10.5
0.277
7.1
9.4
11.8
0 <0.001
6.1
21.4
10.7
32.2 0.828
31.3
0.563
34.6 0.967
33.0
Farnedi et al. BMC Cancer (2015) 15:352
Page 12 of 19
Table 3 Univariate analysis of PG expression in relation to known prognostic indicators (Continued)
Precancerous lesions/
SDC2 stroma
N status6/SDC1 mRNA
N status/SDC2 stroma
N status/SDC1 mRNA
T3-T4/=
13
7.7
T3-T4/De
novo
36
30.6
-/-
29
0
-/+
84
8.3
0.001
+/-
14
7.1
+/+
35
28.6
Negative/
↓/=
31
0
0.004
Negative/↑
30
10.0
Positive/↓/=
30
10.0
Positive/↑
28
28.6
-/-
33
-/+
57
14.0
+/-
10
10.0
33.3
0 <0.001
+/+
63
Negative/
↓/=
31
3.2
<0.001
Negative/↑
57
33.3
Positive/↓/=
10
40.0
Positive/↑
63
50.0
Yes
36
16.7
No
73
12.3
PGs pattern
SDC1 mRNA ↑ NG2/CSPG4 mRNA
de novo + SDC2
stroma
0.271
11.1
8.2
0.405
25 <0.001
4.1
33.3
11
0.002
50 <0.001
23.3
1
This refers to the situation in which patients manifested at least one of the four adopted clinical outcomes within the follow-up period;
Excessive alcohol consumption was based upon self-provided information;
PG transcript expression was defined as “↓”, down-regulated; “↑”, up-regulated; “=”, not changed; and “De novo”, de novo expressed, when compared to a healthy
mucosal tissues pool that was used as sample calibrator;
4
Protein expression data are reported as detectable or non-detectable by indirect immunohistochemistry;
5
Univariate analyses combining the prognostic indicators that were deemed to be independent poor predictors of each of the five clinical outcomes as
accomplished through the Cox proportional hazard model;
6
N status positive or negative is according to N classification AJCC staging system;
p values <0,05 were considered to be significant (in bold); p values within ≥ 0,05 and <0,06 were considered borderline and were included in the following
multivariate regression model; p value was not calculated where a monotone likelihood was established.
Abbreviations: OC, oral cavity; OP, oropharynx.
2
3
(p = 0.015; Figure 4) and altered GPC6 protein expression
in tumour cells (p = 0.01; Table 3). As predictable, “sentinel lymphnodes” at diagnosis significantly influenced the
later appearance of more prominent lymphnodal lesions,
but this factor was not considered in the multivariate logistic regression model because of its unuttered prognostic
implication. Multivariate analysis corroborated that the
occurrence of precancerous lesions (HR, 3.773, p = 0.005),
and more incisively the presence of SDC2 in the stromal
compartment (HR, 7.652, p = 0.007), but not GPC6
expression or gender of the patient, were independent
prognostic markers for post-surgery secondary infiltrations of lymphnodes (Table 4; Figure 5). If we then
accounted for both a history of precancerous lesions and
SDC2 stromal expression, the probability to develop post-
surgical lymphnodal infiltration was significantly increased
(p = 0.001; Table 3; Figure 4).
Contrary to the above associations, univariate logistic
analyses revealed that the N classification , at time of surgical removal of the primary tumour mass, and up-regulated
transcription of SDC1 (Figure 4) were significantly associated with the formation of distant metastases ( p = 0.016 for
both correlations; Table 3). The frequency of GPC6 expression in neoplastic cells did not satisfy the limit of significance (p = 0.052), but could be a potentially interesting
indicator to take into account in future investigations on
larger cohorts of patients. Conversely, multivariate analyses
reinforced the impact of N classification (HR, 4.38, p =
0.012) and down-regulated or unaltered SDC1 expression
(HR, 0.232, p = 0.013) as independent factors predicting the
Farnedi et al. BMC Cancer (2015) 15:352
Figure 4 (See legend on next page.)
Page 13 of 19
Farnedi et al. BMC Cancer (2015) 15:352
Page 14 of 19
(See figure on previous page.)
Figure 4 Differential PG expression correlates with clinical outcome. Survival and probability curves for the following correlations: (a) loco-regional
relapse vs de novo expression of NG2/CSPG4, (b) loco-regional relapse vs T group classification; (c) loco-regional relapse vs coincident NG2/CSPG4
expression and advanced T classification; (d) lymphnodal metastases vs enhanced SDC2 expression in stromal cells; (e) lymphnodal metastases
vs manifestation of precancerous lesions; (f) lymphnodal metastases vs the combination of both previous prognostic indicators; (g) distant
metastases vs up-regulated SDC1 expression; (h) distant metastases vs infiltration of cervical lymph nodes; (i) distant metastases vs the combination of
both previous prognostic indicators; (j) overall survival vs enhanced SDC2 expression in the stromal compartment; (k) overall survival vs N classification;
(l) overall survival vs the coincidence of both previously indicated events; (m) the occurrence of any of the clinical outcomes vs up-regulated SDC1
expression; (n) the occurrence of any of the clinical outcomes vs N classification; (o) the occurrence of any of the clinical outcomes vs the combination
of both above listed events; (p) overall survival, (q) distant metastases and (r) the occurrence of any of the clinical outcomes vs the combination of
SDC1 up-regulation, de novo expression of NG2/CSPG4 and stromal enhancement of SDC2 positivity. Abbreviations: LRFS, loco-regional relapse-free
survival; LMFS, lymphnodal metastasis-free survival; DMFS, distant metastasis-free survival; OS, overall survival, COsFS, clinical outcomes-free survival.
formation of distant metastases, albeit with opposite trends,
(Table 4; Figure 5). When we next considered the combination of the unfavourable conditions represented by lymphnodal infiltration and up-regulation of SDC1 transcription,
we unfolded a significantly increased probability to develop
distant metastases (p = 0.004; Table 3; Figure 4). Noteworthy was also the fact that 91% of patients with upregulated SDC1 transcription that developed distant
metastases within the follow-up period invariably succumbed the disease.
Advanced T classification (p = 0.038), T3-T4 grouping
(p = 0.043), positive N classification (p < 0.001; Figure 4),
up-regulation of SDC1 transcription (p = 0.036) and stromal expression of SDC2 or GPC1 (p = 0.001 and p = 0.012
respectively; Table 3, Figure 4) were also found to be
strongly associated with disease-related death. Cervical
lymphnodal involvement (HR, 2.971, p = 0.005) and, more
markedly, synthesis of SDC2 in the stromal cells (HR,
8.671, p = 0.003), established two independent predictors
of survival (Table 4; Figure 5). The combination of these
two conditions further decreased the survival probability
of the patients (p < 0.001, Table 3; Figure 4).
In the evaluation of situations in which patients presented at any of the mentioned clinical outcomes, we
similarly found a tight correlation between advanced T
classification (p = 0.018), T3-T4 grouping (p = 0.005),
positive N classification (p < 0.001; Figure 4), up-regulation
of SDC1 mRNA (p = 0.013; Figure 4) and SDC2 stromal
reactivity (p = 0.002). Finally, in multivariate analyses, N
involvement (HR, 3.203, p < 0.001) and down-regulation or
unaltered SDC1 expression (HR, 0.429, p = 0.012), but not
T classification or SDC2 detection in stromal cells, were
independent factors with opposite trends for the prediction
of poor prognosis (Table 4; Figure 5). Even in this case the
combination of positive N classification and up-regulation
of SDC1 mRNA expression significantly increased the
probability of the patients to incur into a dismal disease
course (p < 0.001;Table 3; Figure 4).
We finally evaluated the disease course in patients
scoring positively for the 3 dismal prognostic indicators,
i.e. de novo expression of NG2/CSPG4, stromal
abundance of SDC2 and up-regulation of SDC1 mRNA,
which, in an independent manner, associated with one
or more of the adverse clinical outcomes. This conditions was found in 36 of the 173 patients (21%) and
within this patient subgroup 17% and 25%, respectively,
developed loco-regional secondary lesions or distant
metastases. Lymphnodal metastasis was observed in 11%
of the patients, whereas 33% of them succumbed to the
disease. Survival analyses revealed a strong association
between the PG pattern analyzed and the presence of
distant metastases (p < 0.002), disease-related deaths
(p = 0.004) and a cumulative bad prognosis (p < 0.004).
The Cox regression model ascertained that patients
not expressing simultaneously the three bad independent disease course markers resulted to have a best
prognosis in terms of putative development of distant
metastases (HR, 0.146, p = 0.002), for survival (HR,
0.272, p = 0.004) and for incurring into any of the unfavourable clinical events under consideration (HR,
0.363, p = 0.003) (Table 4; Figure 5).
Discussion
Despite the relatively high incidence of oral cavity
HNSCC, very few reliable prognostic and/or predictive
molecular markers are currently available for the routine
clinical management of the patients. In light of this deficiency, we have explored the possibility that variation in
the expression of cell surface PGs, widely recognized to
be key factors in the control of tumour progression
[33,56-59], could afford more effective means of prognosticating patients affected by these tumours. Indeed,
we find that, upon neoplastic transformation, epithelial
cells of the oral cavity and oropharynx modify their transcriptional/translational rates of virtually all currently
known cell surface PGs. This led us to conclude that
transformation-dependent modulation of PG synthesis
may be part of the globally altered pattern of gene expression in these cells, as well as contribute to the cancer cell’s acquisition of a defined repertoire a cell surface
molecules capable of dictating their malignant behavior.
Farnedi et al. BMC Cancer (2015) 15:352
Page 15 of 19
Table 4 Multivariate analyses of the prognostic implication of altered PG expression for the different clinical
outcomes1Estimated regression coefficient and confidence interval;
Estimate1 (95% CI)
SE2
p value3
HR4
Clinical outcome
T25
0.359 (0.153/0.565)
0.105
0,012
1.432
Loco-regional relapse
T3
1.857 (1.556/2.158)
0.153
6.404
T4
2.160 (1.956/2.364)
0.104
8.671
T3-T4 vs T1-T2
1.850 (1.691/2.009)
0.081
0.001
6.360
Loco-regional relapse
De novo expression vs
no expression
1.911 (1.735/2.087)
0.090
0.017
6.760
Loco-regional relapse
Presence vs Absence
1.328 (1.184/1.471)
0.073
0.005
3.773
Lymphnodal metastases
Positive vs Negative
2.035 (1.885/2.184)
0.076
0.007
7.652
Lymphnodal metastases
Positive vs Negative
2.160 (2.022/2.298)
0.070
0.003
8.671
Disease-related deaths
Positive vs Negative
1.477 (1.326/1.628)
0.077
0.012
4.380
Distant metastasis
Positive vs Negative
1.089 (0.967/1.211)
0.062
0.005
2.971
Disease-related deaths
Positive vs Negative
1.164 (1.003/1.325)
0.082
<0.001
3.203
Any of the clinical outcomes7
↓ /= vs ↑
−1.460 (−1.612/-1.309)
0.077
0.013
0.232
Distant metastasis
↓ /= vs ↑
−0.845 (−1.007/-0.684)
0.082
0.012
0.429
Any of the clinical outcomes
Single condition vs combination of all 3 conditions8
−1.924 (−2.088/-1.760)
0.084
0.002
0.146
Distant metastasis
−1.302 (−1.459/-1.146)
0.080
0.004
0.272
Disease-related deaths
−1.014 (−1.194/-0.833)
0.092
0.003
0.363
Any of the clinical outcomes
Prognostic indicator/PG
T classification
NG2/CSPG4 mRNA6
Precancerous lesions
SDC2 stroma
SDC2 stroma
N classification
N classification
N classification
SDC1 mRNA
SDC1 mRNA
SDC1 mRNA up-regulation +
NG2/CSPG4 mRNA de novo
expression + SDC2 stroma
1
Estimated regression coefficient and confidence interval;
2
Standard error of estimated regression coefficient;
3
p value <0,05 were considered to be significant;
4
Hazard Ratio estimated from Cox proportional hazard regression model;
5
Compared to T1 stage;
6
PG transcript expression (↓, down-regulated; ↑, up-regulated; =, not changed; De novo expression, de novo expressed in comparison to a healthy mucosal tissues
pool that was used as sample calibrator) could be grouped according to the trend of each PG gene in relation to the clinical outcomes;
7
Is referred to a patient that had at least one of the other outcomes within the follow-up;
8
Refers to the comparison between a situation in which all three indicated conditions were manifested (“combination of all 3 conditions”) versus either condition
alone or the combination of any two conditions;
Abbreviations: CI, Confidence Interval; HR, Hazard Ratio; SE, standard error.
SDCs are widely recognized to undergo malignancyassociated changes in their expressions in several types
of carcinomas, including those of thyroid, breast, colon,
skin, stomach and urogenital tract, and SDC1 is recognized to be the best documented prognostic biomarker
[39,41,43,40,46,60-64]. Its expression pattern frequently
correlates with the differentiation status of the cells and
thereby with their malignancy degree [47,54,65-68]. This
characterizing trait of the SDC1 tumour-associated
expression was corroborated here, along with its widespread distribution in neoplastic HNSCC lesions.
Although much less studied, SDC2 has also been reported to be associated with malignant carcinoma lesions
in various anatomical sites/organs including head and
neck [63,69,70]. In this study, transcription/translation of
SDC2 was found to be more prominent in the
Farnedi et al. BMC Cancer (2015) 15:352
Page 16 of 19
Figure 5 Cox proportional hazard analysis. Plot overview of Cox proportional hazard estimated regression coefficients of the resulting independent
prognostic factors for loco-regional recurrence, lymphnodal metastases, distant metastases, disease-related death and the occurrence of any of the
clinical outcomes.
intralesional stroma than in the neoplastic cells and,
hence, the PG showed an expression pattern that was
complementary to SDC1. Notably, SDC2 was also observed to be strongly enriched in neovascular structures, where it appeared to be associated with both
endothelial cells and pericytes. Our present mapping
study is the first to reveal a de novo expression of
SDC3 and SDC4 in oral cavity HNSCC and the accumulation of SDC4 in areas of cell-cell contact
[22,24,25] within such lesions. Intracellular abundance
of SDCs in HNSCC cells may reflect the incapacity of
the cells to complete the post-translational processing
of these PGs and/or their transport and intercalation
into the cell membrane, or an accentuated internalization and intracellular recycling process.
Several GPCs were also found to be misexpressed in
oral cavity HNSCC lesions, albeit with frequencies that
were generally lower than those seen for SDCs. GPC1,
known to be highly expressed in pancreatic and breast
carcinomas [32,33], was found to be the prevalent GPC of
these lesions, alongside with GPC3, which has independently been reported to be up-regulated in several other
tumour types and has a recognized value as prognostic
factor and putative therapeutic target in hepatocellular
carcinomas [34,35,37]. In this context, it is, however,
worth noting that GPC3 has also been proposed to act as
a potential tumour suppressor in certain neoplasia, showing a putative transformation-dependent silencing of the
glypican [30,71-73].
When we applied univariate and multivariate metaanalytical methods to correlate the observed PG expression patterns with clinically relevant disease outcomes
we unveiled striking associations. Appearance of NG2/
CSPG4, a PG with a precedent prognostic impact in
numerous solid tumours [74-82], was found to tightly
correlate with loco-regional tumour recurrence and,
hence, was disclosed to be the first ever to be described
molecular relapse predictor in oral cavity HNSCC. Enhanced expression of GPC1 in the stromal compartment
of these lesions also closely correlated with tumour
recurrence and paralleled the more predictable prognostic
implication of tumour staging. Beside its prognostic role
in pancreatic cancer, there is currently no other indication
that altered expression of GPC1 may influence the course
of any tumour type. Another crucial finding of this study
was the close association betweenSDC2 up-regulation in
Farnedi et al. BMC Cancer (2015) 15:352
the intralesional stromal compartment and the overall
survival of the patients carrying such SDC2-rich primary
lesions. Even in this case, the present study provides the
first evidence for such a prognostic relationship in any
cancer type and, similarly to the potential of NG2/CSPG4,
emphasizes that SDC2 may serve as a putative target
for prevention and/or treatment of relapsing oral cavity
HNSCC.
Conclusion
The present study provides the first evidence that altered
expression of cell surface-bound PGs is strongly links to
the formation and progression of oral cavity HNSCC.
Elective modulation of PG expression in primary oral
cavity HNSCC lesions correlates, in a predictive manner,
with several clinical outcomes and may therefore serve
as an adjunct in the molecular diagnosis of these tumours. More specifically, enhanced expression of SDC2
in the tumour stroma significantly correlates with overall
survival and is indicative of lymphonodal metastasis,
whereas aberrant increased of SDC1 transcription is indicative of the presence of distant metastases. Strikingly,
up-regulation of NG2/CSPG4 is tightly linked to locoregional recurrence of the tumour, underscoring the potential of this biomarker to forcefully predict the clinical
course of oral cavity HNSCC patients.
Additional files
Additional file 1: Table S1. Patient demographic and clinic-pathological
features.
Additional file 2: Figure S1. Overview of the distribution of clinical
outcomes manifested by oral cavity HNSCC patients during the entire
follow-up period subdivided in 6-months time intervals.
Additional file 3. Supplemental and detailed Materials and methods.
Additional file 4: Table S2. Listing of the individual relative PG
expression data.
Additional file 5: Figure S2. Representative immunostaining on
healthy control tissue sections: GPC1 (a), GPC3 (b), GPC4 (c), GPC6 (d),
NG2/CSPG4 (e), SDC1 (f), SDC2 (g), SDC3 (h) and SDC4 (i).
Competing interests
The authors declare that they have no competing interests.
Authors’ contributions
Conception and design: AF, SR, NB and RP. Development of methodology:
EMS, TP, ES, CM, RC, MPF and RP. Acquisition of data: AF, RS, NB, MG, DL,
MTM, EL and AAS. Analysis and interpretation of data: AF, RS, NB, MG, LM, EL,
MPF and RP. Writing, review and/or revision of the manuscript: AF, SR, NB
and RP. Administrative, technical, or material support: all co-author. Study
supervision: TP, ES, MPF and RP. All authors read and approved the final
version of the manuscript.
Acknowledgements
We are indebted to Dr. Alice Dallatomasina and Dr. Mirca Lazzaretti for technical
assistance and to Prof. S.A. Pileri, University of Bologna, for assistance in the
preparation of TMAs. The work was supported by grants from RER (Programma
di ricerca Regione-Università 2007–2009; Area La Ricerca Innovativa to MPF, ES
and RP); AIRC, Associazione Italiana per la Ricerca sul Cancro (IG 2009 to RP), the
Page 17 of 19
Italian Ministry of University, Education and Research, MIUR (PRIN 2008 to RP)
and by Asse POR-FESR “Creazione Tecnopoli” (Regione Emilia-Romagna).
Author details
1
Department of Biomedical and Neuromotor Sciences, Section of Anatomic
Pathology, University of Bologna, Bellaria Hospital, Bologna, Italy. 2COMT –
Centre for Molecular Translational Oncology & Department of Life Sciences,
University of Parma, Parma, Italy. 3Department of Life Sciences, Division of
Genetics and Environmental Biotechnology, University of Parma, Parma, Italy.
4
Department of Pathology and Laboratory Medicine, University of Parma,
Parma, Italy. 5S.O.C. of Experimental Oncology 2, The National Tumour
Institute Aviano - CRO-IRCCS, Aviano, Pordenone, Italy. 6Maxillofacial Surgery
Section, Head and Neck Department, University of Parma, Parma, Italy. 7Unit
of Maxillo-Facial Surgery, Department of Oral Sciences, University of Bologna,
Bellaria Hospital, Bologna, Italy. 8Department of Biomedical and Neuromotor
Sciences, Unit of Maxillo-Facial Surgery, University of Bologna, S. Orsola
Hospital, Bologna, Italy. 9Unit of Maxillo-facial Surgery at Bellaria Hospital, Bologna, Italy. 10Unit of Maxillo-facial Surgery, “Casa Sollievo della Sofferenza”,
San Giovanni in Rotondo, Italy.
Received: 10 November 2014 Accepted: 22 April 2015
References
1. DeSantis C, Lin C, Mariotto A, Siegel R, Stein K, Kramer J, et al. Cancer
treatment and survivorship statistics, 2014. CA Cancer J Clin. 2014;64:252–71.
2. Ferlay J, Soerjomataran I, Dikshit R, Eser S, Mathers C, Rebelo M, et al. Cancer
incidence and mortality worldwide: Sources, methods and major patterns in
GLOBOCAN 2012. Int J Cancer. 2015;136:E359–86.
3. Bray F, Ren JS, Masuyer E, Ferlay J. Global estimates of cancer prevalence for
27 sites in the adult population in 2008. Int J Cancer. 2013;132:1133–45.
4. Dragovic AF, Caudell JJ, Spencer SA, Carroll WR, Nabell LA, Bonner JA.
Locoregional failure and the risk of distant metastasis after modern
radiotherapy for head and neck cancer. Head Neck. 2013;35:381–7.
5. Kang CJ, Liao CT, Hsueh C, Lee LY, Lin CY, Fan KH, et al. Outcome analysis
of patients with well-differentiated oral cavity squamous cell carcinoma. Oral
Oncol. 2011;47:1085–91.
6. Reibel J. Prognosis of oral pre-malignant lesions: significance of clinical,
histopathological, and molecular biological characteristics. Crit Rev Oral Biol
Med. 2003;14:47–62.
7. Brinkman BM, Wong DT. Disease mechanism and biomarkers of oral
squamous cell carcinoma. Curr Opin Oncol. 2006;18:228–33.
8. Brennan M, Migliorati CA, Lockhart PB, Wray D, Al-Hashimi I, Axéll T, et al.
Management of oral epithelial dysplasia: a review. Oral Surg Oral Med Oral
Pathol Oral Radiol Endod. 2007;103:S19.e1–S19.e12.
9. Hu S, Wong DT. Oral cancer proteomics. Curr Opin Mol Ther. 2007;9:467–76.
10. Scully C, Bagan JV. Recent advances in oral oncology 2008; squamous cell
carcinoma imaging, treatment, prognostication and treatment outcomes.
Oral Oncol. 2009;45:e25–30.
11. Coughlin A, Resto VA. Oral cavity squamous cell carcinoma and the
clinically n0 neck: the past, present, and future of sentinel lymph node
biopsy. Curr Oncol Rep. 2010;12:129–35.
12. El-Naaj IA, Leiser Y, Shveis M, Sabo E, Peled M. Incidence of oral cancer
occult metastasis and survival of T1-T2N0 oral cancer patients. J Oral Maxillofac
Surg. 2011;69:2674–9.
13. Woolgar JA. Pathology of the N0 neck. Br J Oral Maxillofac Surg. 1999;37:205–9.
14. Søland TM, Brusevold IJ. Prognostic molecular markers in cancer - quo
vadis? Histopathology. 2013;63:297–308.
15. Oliveira LR, Ribeiro-Silva A. Prognostic significance of immunohistochemical
biomarkers in oral squamous cell carcinoma. Int J Oral Maxillofac Surg.
2011;40:298–307.
16. Ang KK, Harris J, Wheeler R, Weber R, Rosenthal DI, Nguyen-Tân PF, et al.
Human papillomavirus and survival of patients with oropharyngeal cancer.
N Engl J Med. 2010;363:24–35.
17. Licitra L, Perrone F, Tamborini E, Bertola L, Ghirelli C, Negri T, et al. Role of
EGFR family receptors in proliferation of squamous carcinoma cells induced
by wound healing fluids of head and neck cancer patients. Ann Oncol.
2011;22:1886–93.
18. Leemans CR, Braakhuis BJ, Brakenhoff RH. The molecular biology of head
and neck cancer. Nat Rev Cancer. 2011;11:9–22.
Farnedi et al. BMC Cancer (2015) 15:352
19. Granata R, Miceli R, Orlandi E, Perrone F, Cortelazzi B, Franceschini M, et al.
Tumour stage, human papillomavirus and smoking status affect the survival
of patients with oropharyngeal cancer: an Italian validation study. Ann
Oncol. 2012;23:1832–7.
20. Wittekindt C, Wagner S, Mayer CS, Klussmann JP. Basics of tumour development
and importance of human papilloma virus (HPV) for head and neck cancer. GMS
Curr Top Otorhinolaryngol Head Neck Surg. 2012;11:Doc09.
21. Kirn-Safran C, Farach-Carson MC, Carson DD. Multifunctionality of extracellular
and cell surface heparan sulfate proteoglycans. Cell Mol Life Sci. 2009;66:3421–34.
22. Lambaerts K, Wilcox-Adelman SA, Zimmermann P. The signaling mechanisms
of syndecan heparan sulfate proteoglycans. Curr Opin Cell Biol. 2009;21:662–9.
23. Bishop JR, Schuksz M, Esko JD. Heparan sulphate proteoglycans fine-tune
mammalian physiology. Nature. 2007;446:1030–7.
24. Xian X, Gopal S, Couchman JR. Syndecans as receptors and organizers of
the extracellular matrix. Cell Tissue Res. 2010;339:31–46.
25. Choi Y, Chung H, Jung H, Couchman JR, Oh ES. Syndecans as cell surface
receptors: Unique structure equates with functional diversity. Matrix Biol.
2011;30:93–9.
26. Filmus J, Selleck SB. Glypicans: proteoglycans with a surprise. J Clin Invest.
2001;108:497–501.
27. Veugelers M, De Cat B, Ceulemans H, Bruystens AM, Coomans C, Dürr J,
et al. Glypican-6, a New Member of the Glypican Family of Cell Surface
Heparan Sulfate Proteoglycans. J Biol Chem. 1999;274:26968–77.
28. Filmus J, Capurro M, Rast J. Glypicans. Genome Biol. 2008;9:224.
29. Powell CA, Xu G, Filmus J, Busch S, Brody JS, Rothman PB. Oligonucleotide
microarray analysis of lung adenocarcinoma in smokers and nonsmokers
identifies GPC3 as a potential lung tumour suppressor. Chest. 2002;121:6S–7.
30. Kim H, Xu GL, Borczuk AC, Busch S, Filmus J, Capurro M, et al. The heparan
sulfate proteoglycan GPC3 is a potential lung tumour suppressor. Am J
Respir Cell Mol Biol. 2003;29:694–701.
31. Li Y, Sheu CC, Ye Y, De Andrade M, Wang L, Chang SC, et al. Genetic
variants and risk of lung cancer in never smokers: a genome-wide association
study. Lancet Oncol. 2010;11:321–30.
32. Kleeff J, Ishiwata T, Kumbasar A, Friess H, Büchler MW, Lander AD, et al. The
cell-surface heparan sulfate proteoglycan glypican-1 regulates growth factor
action in pancreatic carcinoma cells and is overexpressed in human pancreatic
cancer. J Clin Invest. 1998;102:1662–73.
33. Matsuda K, Maruyama H, Guo F, Kleeff J, Itakura J, Matsumoto Y, et al.
Glypican-1 is overexpressed in human breast cancer and modulates the
mitogenic effects of multiple heparin-binding growth factors in breast
cancer cells. Cancer Res. 2001;61:5562–9.
34. Zhu ZW, Friess H, Wang L, Abou-Shady M, Zimmermann A, Lander AD, et al.
Enhanced glypican-3 expression differentiates the majority of hepatocellular
carcinomas from benign hepatic disorders. Gut. 2001;48:558–64.
35. Nakatsura T, Yoshitake Y, Senju S, Monji M, Komori H, Motomura Y, et al.
Glypican-3, overexpressed specifically in human hepatocellular carcinoma, is
a novel tumour marker. Biochem Biophys Res Commun. 2003;306:16–25.
36. Hippo Y, Watanabe K, Watanabe A, Midorikawa Y, Yamamoto S, Ihara S, et al.
Identification of soluble NH2-terminal fragment of glypican-3 as a serological
marker for early-stage hepatocellular carcinoma. Cancer Res. 2004;64:2418–23.
37. Shirakawa H, Suzuki H, Shimomura M, Kojima M, Gotohda N, Takahashi S,
et al. Glypican-3 expression is correlated with poor prognosis in hepatocellular
carcinoma. Cancer Sci. 2009;100:1403–7.
38. Soukka T, Pohjola J, Inki P, Happonen RP. Reduction of syndecan-1 expression
is associated with dysplastic oral epithelium. J Oral Pathol Med. 2000;29:308–13.
39. Kurokawa H, Matsumoto S, Murata T, Yamashita Y, Tomoyose T, Zhang M,
et al. Immunohistochemical study of syndecan-1 downregulation and the
expression of p53 protein or Ki-67 antigen in oral leukoplakia with or without
epithelial dysplasia. J Oral Pathol Med. 2003;32:513–21.
40. Vered M, Dayan D, Yahalom R, Dobriyan A, Barshack I, Bello IO, et al. Cancerassociated fibroblasts and epithelial-mesenchymal transition in metastatic
oral tongue squamous cell carcinoma. Int J Cancer. 2010;127:1356–62.
41. Inki P, Joensuu H, Grenman R, Klemi P, Jalkanen M. Association between
syndecan-1 expression and clinical outcome in squamous cell carcinoma of
the head and neck. Br J Cancer. 1994;70:319–23.
42. Inki P, Larjava H, Haapasalmi K, Miettinen HM, Grenman R, Jalkanen M.
Expression of syndecan-1 is induced by differentiation and suppressed by
malignant transformation of human keratinocytes. Eur J Cell Biol. 1994;63:43–51.
43. Anttonen A, Kajanti M, Heikkilä P, Jalkanen M, Joensuu H. Syndecan-1
expression has prognostic significance in head and neck carcinoma. Br J
Cancer. 1999;79:558–64.
Page 18 of 19
44. Jackson LL, Wade Z, Hessler RB, Abdelsayed R, Rogers JB, Gourin CG.
Quantitative analysis of syndecan-1 expression in dysplasia and squamous
cell carcinoma of the oral cavity. Laryngoscope. 2007;117:868–71.
45. Saussez S. In reference to quantitative analysis of syndecan-1 expression in
dysplasia and squamous cell carcinoma of the oral cavity. Laryngoscope.
2008;118:944–5. author reply 945.
46. Martínez A, Spencer ML, Brethauer U, Grez P, Marchesani FJ, Rojas IG.
Reduction of syndecan-1 expression during lip carcinogenesis. J Oral Pathol
Med. 2009;38:580–3.
47. Mukunyadzi P, Liu K, Hanna EY, Suen JY, Fan CY. Induced expression of
syndecan-1 in the stroma of head and neck squamous cell carcinoma. Mod
Pathol. 2003;16:796–801.
48. Siqueira AS, Gama-de-Souza LN, Arnaud MV, Pinheiro JJ, Jaeger RG.
Laminin-derived peptide AG73 regulates migration, invasion, and protease
activity of human oral squamous cell carcinoma cells through syndecan-1
and beta1 integrin. Tumour Biol. 2010;31:46–58.
49. Nicolosi PA, Dallatomasina A, Perris R: Theranostic impact of NG2/CSPG4
proteoglycan in cancer. Theranostic Journal, in press.
50. Benassi MS, Pazzaglia L, Chiechi A, Alberghini M, Conti A, Cattaruzza S, et al.
NG2 expression predicts the metastasis formation in soft-tissue sarcoma
patients. J Orthop Res. 2009;27:135–40.
51. Warta R, Herold-Mende C, Chaisaingmongkol J, Popanda O, Mock A, Mogler
C, et al. Reduced promoter methylation and increased expression of CSPG4
negatively influences survival of HNSCC patients. Int J Cancer. 2014;135:2727–34.
52. Brazma A, Vilo J. Gene expression data analysis. FEBS Lett. 2000;480:17–24.
53. Barrett T, Troup DB, Wilhite SE, Ledoux P, Rudnev D, Evangelista C, et al.
NCBI GEO: archive for high-throughput functional genomic data. Nucleic
Acids Res. 2009;37(Database issue):D885–90.
54. Zimpfer A, Schonberg S, Agostinelli C, Pileri SA, Went P, Dirnhofer S. Construction
and validation of a bone marrow tissue microarray. J Clin Pathol. 2007;60:57–61.
55. Tzankov A, Pehrs AC, Zimpfer A, Ascani S, Lugli A, Pileri S, et al. Prognostic
significance of CD44 expression in diffuse large B cell lymphoma of
activated and germinal centre B cell-like types: a tissue microarray analysis
of 90 cases. J Clin Pathol. 2003;56:747–52.
56. Numa F, Hirabayashi K, Kawasaki K, Sakaguchi Y, Sugino N, Suehiro Y, et al.
Syndecan-1 expression in cancer of the uterine cervix: association with
lymph node metastasis. Int J Oncol. 2002;20:39–43.
57. Garusi E, Rossi S, Perris R. Antithetic roles of proteoglycans in cancer. Cell
Mol Life Sci. 2012;69:553–79.
58. Price MA, Colvin Wanshura LE, Yang J, Carlson J, Xiang B, Li G, et al. CSPG4,
a potential therapeutic target, facilitates malignant progression of
melanoma. Pigment Cell Melanoma Res. 2011;24:1148–57.
59. Yoneda A, Lendorf ME, Couchman JR, Multhaupt HA. Breast and ovarian
cancers: a survey and possible roles for the cell surface heparan sulfate
proteoglycans. J Histochem Cytochem. 2012;60:9–21.
60. Pulkkinen JO, Penttinen M, Jalkanen M, Klemi P, Grénman R. Syndecan-1: a
new prognostic marker in laryngeal cancer. Acta Otolaryngol. 1997;117:312–5.
61. Kurokawa H, Zhang M, Matsumoto S, Yamashita Y, Tanaka T, Takamori K,
et al. Reduced syndecan-1 expression is correlated with the histological
grade of malignancy at the deep invasive front in oral squamous cell carcinoma.
J Oral Pathol Med. 2006;35:301–6.
62. Chen CL, Ou DL. Expression of syndecan-1 (CD138) in nasopharyngeal
carcinoma is correlated with advanced stage and poor prognosis. Hum
Pathol. 2006;37:1279–85.
63. Máthé M, Suba Z, Németh Z, Tátrai P, Füle T, Borgulya G, et al. Stromal
syndecan-1 expression is an adverse prognostic factor in oral carcinomas.
Oral Oncol. 2006;42:493–500.
64. Kim YJ, Go H, Wu HG, Jeon YK, Park SW, Lee SH. Immunohistochemical
study identifying prognostic biomolecular markers in nasopharyngeal
carcinoma treated by radiotherapy. Head Neck. 2011;33:1458–66.
65. Mikami S, Ohashi K, Usui Y, Nemoto T, Katsube K, Yanagishita M, et al. Loss
of syndecan-1 and increased expression of heparanase in invasive esophageal
carcinomas. Jpn J Cancer Res. 2001;92:1062–73.
66. Contreras HR, Ledezma RA, Vergara J, Cifuentes F, Barra C, Cabello P, et al.
The expression of syndecan-1 and −2 is associated with Gleason score and
epithelial-mesenchymal transition markers, E-cadherin and beta-catenin, in
prostate cancer. Urol Oncol. 2010;28:534–40.
67. Wang H, Si JL, Zhang XZ, Qi YQ, Niu ZY, Zhou CH. Expression and clinical
significance of syndecan-1 mRNA and HPA-1 mRNA in colorectal cancer
detected with real-time fluorescent quantitative polymerase chain reaction.
Chin J Cancer. 2010;29:288–93.
Farnedi et al. BMC Cancer (2015) 15:352
Page 19 of 19
68. Lee SH, Choi EJ, Kim MS, Park JW, Lee YS, Kim SY, et al. Prognostic
significance of syndecan-1 expression in squamous cell carcinoma of the
tonsil. Int J Clin Oncol. 2014;19:247–53.
69. Huang X, Xiao DW, Xu LY, Zhong HJ, Liao LD, Xie ZF, et al. Prognostic
significance of altered expression of SDC2 and CYR61 in esophageal
squamous cell carcinoma. Oncol Rep. 2009;21:1123–9.
70. Popović A, Demirović A, Spajić B, Stimac G, Kruslin B, Tomas D. Expression
and prognostic role of syndecan-2 in prostate cancer. Prostate Cancer
Prostatic Dis. 2010;13:78–82.
71. Lin H, Huber R, Schlessinger D, Morin PJ. Frequent silencing of the GPC3
gene in ovarian cancer cell lines. Cancer Res. 1999;59:807–10.
72. Murthy SS, Shen T, De Rienzo A, Lee WC, Ferriola PC, Jhanwar SC, et al.
Expression of GPC3, an X-linked recessive overgrowth gene, is silenced in
malignant mesothelioma. Oncogene. 2000;19:410–6.
73. Xiang YY, Ladeda V, Filmus J. Glypican-3 expression is silenced in human
breast cancer. Oncogene. 2001;20:7408–12.
74. Chang CC, Campoli M, Luo W, Zhao W, Zaenker KS, Ferrone S.
Immunotherapy of melanoma targeting human high molecular weight
melanoma-associated antigen: potential role of nonimmunological mechanisms.
Ann N Y Acad Sci. 2004;1028:340–50.
75. Wang X, Osada T, Wang Y, Yu L, Sakakura K, Katayama A, et al. CSPG4
protein as a new target for the antibody-based immunotherapy of
triple-negative breast cancer. J Natl Cancer Inst. 2010;102:1496–512.
76. Wang J, Svendsen A, Kmiecik J, Immervoll H, Skaftnesmo KO, Planagumà J,
et al. Targeting the NG2/CSPG4 proteoglycan retards tumour growth and
angiogenesis in preclinical models of GBM and melanoma. PLoS One.
2011;6, e23062.
77. Rivera Z, Ferrone S, Wang X, Jube S, Yang H, Pass HI, et al. CSPG4 as a
target of antibody-based immunotherapy for malignant mesothelioma. Clin
Cancer Res. 2012;18:5352–63.
78. Cattaruzza S, Nicolosi PA, Braghetta P, Pazzaglia L, Benassi MS, Picci P, et al.
NG2/CSPG4-collagen type VI interplays putatively involved in the
microenvironmental control of tumour engraftment and local expansion.
J Mol Cell Biol. 2013;5:176–93.
79. Wang X, Wang Y, Yu L, Sakakura K, Visus C, Schwab JH, et al. CSPG4 in
cancer: multiple roles. Curr Mol Med. 2010;10:419–29.
80. Campoli M, Ferrone S, Wang X. Functional and clinical relevance of
chondroitin sulfate proteoglycan 4. Adv Cancer Res. 2010;109:73–121.
81. Kelly-Goss MR, Sweat RS, Stapor PC, Peirce SM, Murfee WL. Targeting
pericytes for angiogenic therapies. Microcirculation. 2014;21:345–57.
82. Zhang H, Bie P, Leida Z, Xia Z, Bai L. NG2/CSPG4 proteoglycan as a novel
prognostic indicator and therapeutic target in malignant cancer. J Stem Cell
Res Ther. 2014;4:171.
Submit your next manuscript to BioMed Central
and take full advantage of:
• Convenient online submission
• Thorough peer review
• No space constraints or color figure charges
• Immediate publication on acceptance
• Inclusion in PubMed, CAS, Scopus and Google Scholar
• Research which is freely available for redistribution
Submit your manuscript at
www.biomedcentral.com/submit