Healthcare costs attributable to the treatment of patients with spinal metastases: A cohort study with up to 8 years follow-up
Bạn đang xem bản rút gọn của tài liệu. Xem và tải ngay bản đầy đủ của tài liệu tại đây (556.05 KB, 7 trang )
Tipsmark et al. BMC Cancer (2015) 15:354
DOI 10.1186/s12885-015-1357-z
RESEARCH ARTICLE
Open Access
Healthcare costs attributable to the treatment of
patients with spinal metastases: a cohort study
with up to 8 years follow-up
Line Stjernholm Tipsmark1*, Cody Eric Bünger2, Miao Wang2, Søren Schmidt Morgen3, Benny Dahl3
and Rikke Søgaard1,4,5
Abstract
Background: Cancer treatment, and in particular end-of-life treatment, is associated with substantial healthcare
costs. The purpose of this study was to analyse healthcare costs attributable to the treatment of patients with
spinal metastases.
Methods: The study population (n = 629) was identified from clinical databases in Denmark. Patients undergoing spinal
metastasis treatment from January 2005 through June 2012 were included. Clinical data were merged with national
register data on healthcare resource use, costs and death date. The analytic period ranged from treatment initiation until
death or administrative censoring in October 2013. Analysis of both survival and costs were stratified into four treatment
regimens of increasing invasiveness: radiotherapy (T1), decompression (T2), decompression + instrumentation (T3) and
decompression + instrumentation + reconstruction (T4). Survival was analysed using Kaplan-Meier curves. Costs were
estimated from a healthcare perspective. Lifetime costs were defined as accumulated costs from treatment initiation until
death. The Kaplan-Meier Sampling Average method was used to estimate these costs; 95% CIs were estimated using
nonparametric bootstrapping.
Results: Mean age of the study population was 65.2 years (range: 19-95). During a mean follow-up period of 9.2 months
(range: 0.1-94.5 months), post treatment survival ranged from 4.4 months (95% CI 2.5-7.5) in the T1 group to 8.7 months
(95% CI 6.7-14.1) in the T4 group. Inpatient hospitalisation accounted for 65% and outpatient services for
31% of the healthcare costs followed by hospice placements 3% and primary care 1%. Lifetime healthcare
costs accounted for €36,616 (95% CI 33,835-39,583) per T1 patients, €49,632 (95% CI 42,287-57,767) per T2
patient, €70997 (95% CI 62,244-82,354) per T3 patient and €87,814 (95% CI 76,638-101,528) per T4 patient.
Overall, 45% of costs were utilised within the first month. T1 and T4 patients had almost identical distributions of
costs: inpatient hospitalisation averaged 59% and 36% for outpatient services. Costs of T2 and T3 were very similarly
distributed with an average of 71% for inpatient hospitalisation and 25% for outpatient services.
Conclusion: The index treatment accounts for almost half of lifetime health care costs from treatment initiation until
death. As expected, lifetime healthcare costs are positively association with invasiveness of treatment.
Keywords: Healthcare costs, Spinal metastases, Spinal surgery, Survival, Palliative treatment
* Correspondence:
1
Health Economics, CFK - Public Health and Quality Improvement, Central
Denmark Region, Olof Palmes Allé 15, 8200 Aarhus N, Denmark
Full list of author information is available at the end of the article
© 2015 Tipsmark et al.; licensee BioMed Central. This is an Open Access article distributed under the terms of the Creative
Commons Attribution License ( which permits unrestricted use, distribution, and
reproduction in any medium, provided the original work is properly credited. The Creative Commons Public Domain
Dedication waiver ( applies to the data made available in this article,
unless otherwise stated.
Tipsmark et al. BMC Cancer (2015) 15:354
Background
Cancer patients are frequently affected by bone metastases and approximately fifty percent of bone metastases
are located in the spine [1]. Symptomatic spinal metastases often have severe negative effects on the quality of
life due to pain and neurologic dysfunction [2,3]. Metastases can result in epidural spinal cord compression
which may cause permanent paraplegia if not treated
within 24–48 hours after onset of symptoms [3,4]. When
tumours metastasise to bone, the condition is most often
incurable and the patients usually have a relatively short
life expectancy [5,6]. The choice of optimal treatment
therefore should be based on whether the expected outcome outweighs the disutility and risk to the patient of
undergoing the treatment [7]. In clinical practice, this
choice is often guided by assessment of predicted survival based on prognostic scoring systems such as the
Tokuhashi score [8-10]. In this scoring system, patients
are scored from 0-15 and a score of 0-8 indicates a predicted survival of 0-6 months, 9-11 predicts 6-12 months
survival and 12-15 predicts a survival >12 months. On the
basis of the predicted survival different treatment modalities are recommended: conservative treatment, palliative
surgery or excisional procedures [8].
In Denmark, cancer treatment accounts for approximately 8% of the total costs of hospital activity [11]. A
substantial share of these costs concern end-of-life treatment. Approval of expensive end-of-life treatment has
been increasingly debated in the last years and a supplement to the National Institute for Health and Care
Excellence guidelines on technology appraisal was
written to allow approval of very restricted end-of-life
medicines exceeding conventional threshold levels of
£20-30,000 per quality-adjusted life years (QALY) [12].
Presently, the evidence for healthcare costs of patients
with bone metastases is limited [13-15]. Additionally,
lifetime costs attributable to the treatment of patients
with spinal metastases have to our knowledge never
been analysed [16]. To support decision-making in the
field of spinal metastasis treatment, it seems relevant to
analyse these costs. The purpose of the present study
thus was to analyse healthcare costs attributable to the
treatment of patients with spinal metastases from a
healthcare perspective.
Methods
Study population
The study population consisted of patients with acute
symptoms of metastatic epidural spinal cord compression. The diagnosis was based on Magnetic Resonance
Imaging combined with clinical symptoms of back pain
and/or neurologic impairment. Patients treated from
2005 and onward were included to ensure that patients were representative regarding modern oncological
Page 2 of 7
treatment strategy and due to the fact that national data
on service costs were unavailable for the period prior
to this year. Spinal metastasis patients were identified
using two clinical databases Aarhus Spinal Metastases
Database and Copenhagen Spinal Metastases Database.
Together they represent tertiary referral units serving
almost 4 million people, corresponding to 68% of the
Danish population. Copenhagen Spinal Metastases
Database includes all patients treated with radiotherapy.
Aarhus spinal Metastases database includes all spinal metastases patients referred to surgical treatment. From
Aarhus Spinal Metastases Database we included 210 consecutive surgical patients over a period of seven years
from January 2005 until June 2012. From Copenhagen
Spinal Metastases Database we included 419 patients that
had been consecutively included in 2011; all treated with
radiotherapy. The databases were never meant to be
identical and they are the only available spinal metastases
databases in Denmark (covering two different geographical areas). Date of treatment initiation (day of surgery or
first day of radiation therapy) was recorded and patients
were followed until death or administrative censoring in
October 2013. The following patient information was
extracted from the databases: patient ID, age, gender,
diagnosis, Tokuhashi score, procedure codes and day of
treatment initiation.
The study was approved by The Danish Data Protection
Agency (J.no. 2007-58-0010). Ethical approval from The
National Committee on Health Research Ethics was not
necessary, since this is not a clinical trial involving biological material or human subjects. For the same reason no
written consent was necessary.
Treatment regimens
Radiotherapy consisted of a short-course regime in patients with expected survival less than 6 months. They
received 5 x 4 Gy in one week. Patients with better prognosis underwent 20 x 2 Gy over a period of four weeks.
Radiotherapy was administered to the involved vertebra
after CT-based three-dimensional planning. The radiotherapeutic regime is hereafter referred to as T1.
Surgical interventions included three main entities
with increasing invasiveness: decompression (T2), decompression + instrumentation (T3) and decompression +
instrumentation + reconstruction (T4). The spine surgeons
in Aarhus divided the worst prognosis group (0 – 8 points)
of the Tokuhashi scoring system into two subgroups:
patients in the first treatment regime (0 – 4 points)
had a life expectancy of less than 3 months. Patients
in the second treatment regime (5 – 8 points) were
expected to survive between 3 and 6 months. A simple
decompression/laminectomy surgery was designed for
spinal metastasis patients with the lowest Tokuhashi
score (0 – 4 points). Decompression + pedicle screw
Tipsmark et al. BMC Cancer (2015) 15:354
Page 3 of 7
system instrumentation implantation surgery was employed for patients with low Tokuhashi scores (5 – 8
points). The pedicle screw system strengthens the stability of the spinal segments with metastases. The final surgical regime for patients with an expected survival of
over 6 months (9 – 15 points) was posterior decompression with pedicle screw instrumentation and anterior/
posterior reconstruction by bone cementing and/or bone
graft transplantation. Spine surgeons needed to remove
tumour tissues both inside the spinal canal and in the vertebral body followed by reconstruction afterwards. These
procedures provide strong mechanical supports and stability of the patients’ spines. The patients were stratified according to the treatment they received (T1-T4).
All statistical analyses were carried out in Stata
13.0 (Stata Corporation, Texas, USA). Tables and
graphs were illustrated by use of Excel 2007 (Microsoft
Corporation, USA).
Healthcare costs
Survival
Lifetime healthcare costs were defined as accumulated
costs from treatment initiation until death. The cost perspective of the analysis was healthcare. Primary sector
visits were divided by type of care: general practitioner,
medical specialist, therapists and other. For hospital
sector, inpatient admissions and bed days were recorded as well as outpatient visits. The healthcare costs
were retrieved through the National Health Insurance
Service Register and The Danish National Patient
Register and they were based on Diagnosis-Related
Groups, Danish Ambulant Grouping System and collectively bargained (primary sector) tariffs. Patients’
hospice use rates before 2009 were assumed to follow
rates from 2009 and onwards, as the former were not
available in registries. All costs were converted to price
year 2012 by use of the general consumer price index.
The healthcare costs were converted to Euros at an exchange rate of 7.45 DKK/€.
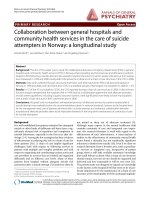
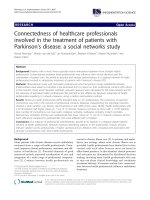
Figure 1 illustrates the Kaplan-Meier survival curves for
the patients in each treatment regime. The number of
remaining patients during the follow-up period is shown
under the graph. The survival among T1 and T2 patients
was very similar until around 25 months where the
curve for T1 patients stagnates and T2 proceeds to decrease until 94 months, which was the longest observed
follow-up period. T1 patients were observed to have the
shortest median survival of 3.0 months (95% CI 2.4-3.8).
The median survival time for T2 and T3 patients was
longer than preoperatively predicted. T2 patients had a
median survival of 4.4 months (95% CI 2.5-7.5) and T3
patients presented with a median survival of 8.0 months
(95% CI 5.2-9.9). T4 patients that received the most
invasive procedure had the longest median survival of
8.7 months (95% CI 6.7-14.1). Fifty-nine patients were
alive at the time of censoring.
Results
Patient characteristics
The study population (n = 629) consisted of 60.3% males
and the mean age was 65.2 years (range: 19-95). Patients
were followed for a mean period of 9.2 months (range:
0.1-94.5 months). The overall censoring rate was 0.09.
The censoring rates for the different treatment regimes
were 0.11 (T1), 0.03 (T2), 0.11 (T3) and 0.01 (T4).
Table 1 shows baseline characteristics for each database.
Healthcare resource use
Analyses
Survival was calculated in days from the date of treatment initiation to death or censoring. Cox regression
was used to estimate survival. Kaplan-Meier survival
curves were performed for each treatment subgroup.
The Kaplan-Meier Sampling Average method was used
to calculate expected lifetime healthcare costs in order
to handle bias introduced by censoring [17]. We partitioned the follow-up period into monthly intervals and
hereafter a three-step procedure was followed: 1. Calculating probability of survival at the beginning of each
monthly interval, 2. Calculating monthly average costs
for patients alive at the beginning of the time interval, 3.
Multiplying estimates from step 1 and 2. Hereafter costs
were accumulated for each treatment regime. Ninetyfive percent confidence intervals (95% CIs) were estimated for probabilities, resource use and costs (calculated
separately in step 1 and 2) by use of 1000 nonparametric
bootstrap replications.
Healthcare resource use categorised by healthcare sector
and treatment strategy is shown in Table 2. Evaluating
the overall distribution of healthcare resource use, approximately 58% was utilised within the primary sector;
furthermore treatment regimes with shorter survival had
lower healthcare resource use. Generally, a large number
of hospital bed days were observed. Comparing treatment regimes, T1 patients had the highest share of resource use at 38% in outpatient settings and the lowest
share in the primary sector at 48%. Resource use among
T1 patients was almost evenly distributed between primary and hospital sector. The distribution of resources
among T2-T4 patients was more similar, with the majority situated in the hospital sector. Sixty-four percent of
T2 resources were used in primary sector and 11% at
inpatient admissions, which was the highest percentage
among the treatment regimes. T4 patients generally used
more resources in the hospital sector compared to the
other surgical treatments (T2 and T3).
Tipsmark et al. BMC Cancer (2015) 15:354
Page 4 of 7
Table 1 Baseline characteristics of 629 spinal metastases
patients
Copenhagen database
(n = 419)
Aarhus database
(n = 210)
n
%
n
%
245
58
134
64
15-54
62
15
42
20
55-64
115
27
68
32
65-74
137
33
71
34
Male
Age (years)
75-84
81
19
26
12
≥85
24
6
3
1
Prostate
97
23
67
32
Lung
99
24
22
10
Breast
75
18
41
20
Other
148
35
80
38
0-6
198
47
107
51
6-12
122
29
76
36
>12
99
24
27
13
419
100
T2
51
24
T3
79
38
T4
80
38
Primary cancer
Predicted survival time*
(months)
Treatment
T1
*Based on the Tokuhashi scoring system at baseline.
T1 conservative, T2 decompression, T3 decompression + instrumentation,
T4 decompression + instrumentation + reconstruction.
Table 3 summarises the lifetime healthcare costs for
the different treatment regimes. The main cost driver
was hospital sector accounting for 96% of total costs
shared among inpatient hospitalisation at 65% and outpatient visits at 31%, these were followed by hospice
accounting for 3% and 1% for primary sector. Overall,
45% of healthcare costs were utilised within the first
month after treatment initiation and 90% were utilised
after 20 months.
T1 and T4 patients had almost identical distribution
of costs: inpatient hospitalisation averaged 59% and outpatient services accounted for 37% and 36%. T1 costs
for hospice placements averaged 3% and 4% for T4.
Likewise, T2 and T3 costs were almost evenly distributed among sectors with 73% and 70% for inpatient
hospitalisation, 24% and 27% for outpatient services.
Hospice placements accounted for 1% (T2) and 2% (T3).
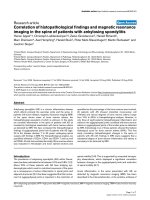
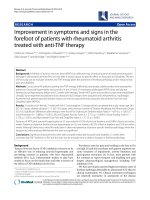
Lifetime costs of the treatment regimes are illustrated
in Figure 2. The curves start at the initial treatment cost
and increases with resource use hereafter. The cost for
T1 patients converged to its maximum relatively quickly
and was stable after 36 months due to no survivors.
Costs for T1 and T2 patients were very similar except
for an upwards shift of the T2 patients due to the extra
initial treatment costs and a slightly higher cost rate in
the mid-period of follow-up due to longer survival. For
the most invasive surgical procedures (T3 and T4) it was
seen that within the first 4-5 months after treatment, the
healthcare costs were almost identical. Hereafter, the T4
patients demonstrate a continued healthcare resource
use whereas the T3 patients’ healthcare use almost levelled out after 30 months due to limited survival time.
Discussion
To our knowledge, this is the first study analysing
healthcare costs attributable to the treatment of patients
with spinal metastases. The lifetime cost of healthcare
after being referred to specialised treatment for spinal
metastases range from €36,616 (95% CI €33,835-39,583)
to €87,814 (95% CI €76,638-101,528) per patient, depending on the type of index treatment received. As
expected it was found that the main category driver was
inpatient hospitalisation, accounting for about 65% of
total costs, followed by outpatient visits, accounting for
another 31%. Also as expected, the ranking of lifetime
costs was in accordance with the observed survival of
the four treatment regimes: longer survival was associated with higher healthcare costs.
In the field of spinal metastasis research, the present
study population is unique in size and follow-up period
because a part of the study population originates from
one of the oldest and most extensive spinal metastases
databases in the world [10]. Although the study population represents one of the largest samples in the literature, we do not have statistical power to assess the role
of patient characteristics in a multivariate analysis. A
strength of this study is that the clinical data is merged
with unique register data, which does not contain missing data and is not affected by recall bias. On the weakness side, one could consider whether the applied DRG
tariffs reflect the actual economic opportunity cost. In
general, DRG tariffs are national average costs of related
procedures and the number of procedures does therefore
not match the number of available tariffs.
Since the present study is the first of its kind, comparison is difficult. A study published by Vera-Llonch et al.
describes healthcare costs in women with metastatic
breast cancer receiving chemotherapy [15]. Methodically
the studies are comparable; both apply the Kaplan-Meier
Sampling Average to calculate total costs. Our study,
however, possess substantial additional strength by
reporting bootstrapped confidence intervals for both
costs and survival as well as providing a description of
the treatment regimes administered.
Tipsmark et al. BMC Cancer (2015) 15:354
Page 5 of 7
Figure 1 Kaplan-Meier survival curves for each of the four treatment regimes: conservative treatment (T1), decompression (T2), decompression +
instrumentation (T3) and decompression + instrumentation + reconstruction (T4).
regime). The total costs per breast cancer patient in
Vera-Llonch et al.’s study was estimated to be $128,556
(≈ €94,000), which is more than twice the costs of T1
patients (€36,616) in our study. Breast cancer patients
are generally observed to have longer survival compared
to patients with most other cancer forms [8,10]. In
The results of Vera-Llonch et al.’s study can be compared to the results of T1 patients, since both groups receive non-surgical treatment, but certain reservations
have to made since the diagnoses among these groups
are not entirely the same (in our study breast cancer
patients only comprised 18.1% of the T1 treatment
Table 2 Total healthcare resource use per spinal metastases patient from treatment initiation until death
T1 (n = 419)
T2 (n = 51)
T3 (n = 79)
T4 (n = 80)
Mean
CI
Mean
CI
Mean
CI
Mean
CI
14.5
(13.6-15.4)
30.8
(27.0-35.2)
36.0
(33.2-39.2)
34.1
(31.2-37.4)
Primary sector (n)
GP
MS
0.6
(0.5-0.8)
1.5
(1.0-2.1)
1.3
(0.8-2.0)
0.8
(0.6-1.2)
Therapists
4.7
(3.8-5.7)
6.6
(3.7-10.5)
8.6
(5.6-12.1)
9.7
(7.0-12.5)
Other
0.2
(0.2-0.3)
0.4
(0.2-0.6)
0.34
(0.2-0.5)
0.7
(0.5-0.9)
Outpatient
16.1
(14.4-17.9)
14.3
(10.8-18.0)
18.7
(14.9-23.7)
24.7
(20.0-29.8)
ER
1.2
(1.1-1.3)
0.7
(0.4-0.9)
0.3
(0.2-0.5)
0.3
(0.2-0.4)
Admissions
4.4
(4.1-4.7)
6.9
(6.0-7.9)
7.2
(6.4-7.9)
7.9
(7.0-8.8)
Bed days
25.4
(22.9-27.9)
39.2
(32.0-46.9)
45.6
(38.4-54.0)
46.1
(39.4-53.1)
Hospital sector (n)
Inpatient
Hospice (n)
Admissions
0.2
(0.2-0.3)
0.2
(0.0-0.4)
0.2
(0.1-0.4)
0.4
(0.2-0.6)
Bed days
4.1
(2.9-5.5)
1.7
(0.1-5.5)
5.3
(1.9-10.2)
11.9
(4.8-22.5)
ER Emergency room, GP general practitioner, MS medical specialist, T1 conservative, T2 decompression, T3 decompression + instrumentation T4 decompression +
instrumentation + reconstruction.
Tipsmark et al. BMC Cancer (2015) 15:354
Page 6 of 7
Table 3 Total healthcare cost per spinal metastases patient from treatment initiation until death or censoring
T1 (n = 419)
T2 (n = 51)
%
Mean
CI
T3 (n = 79)
%
Mean
CI
T4 (n = 80)
Mean
CI
%
Mean
CI
%
GP
247
(228-266)
1
648
(542-773)
1
647
(580-716)
1
MS
28
(19-39)
0
46
(29-64)
0
64
(24-122)
0
608
(535-682)
1
37
(22-57)
0
Therapists
85
(69-104)
0
92
(46-152)
0
145
(100-198)
0
Other
32
(26-38)
0
43
(29-60)
0
37
(25-49)
0
205
(151-265)
0
62
(50-77)
0
Outpatient
13567
(11585-16104)
37
11830
(7124-18411)
24
19005
(12259-28984)
27
31408
(21797-44086)
36
ER
146
(135-157)
0
93
(63-131)
0
40
Inpatient
21421
(19651-23232)
59
36202
(30944-42415)
73
49651
(24-59)
0
36
(20-57)
0
(45007-54859)
70
52,135 (47398-57464)
59
Hospice (€)
1089
(763-1509)
3
678
(81-1572)
1
1409
Total
36616 (33835-39583) 100 49632 (42287-57767) 100 70997 (62244-82354) 100 87814 (76638-101528) 100
(559-2631)
2
3324
4
Primary sector (€)
Hospital sector (€)
(1348-6027)
ER Emergency room, GP general practitioner, MS medical specialist, T1 conservative, T2 decompression, T3 decompression + instrumentation T4 decompression +
instrumentation + reconstruction.
Vera-Llonch et al.’s study this results in a follow-up
period twice as long as ours. During this period, a larger
proportion of the study population is alive and thereby
able to consume healthcare resources compared to our
study population. This could be a possible explanation
for the higher costs, together with the fact that VeraLlonch et al. also include outpatient medication costs.
Comparing the healthcare utilisation of the present
study with utilisation reported in Vera-Llonch et al.’s
study for breast cancer patients, it appears that Danish
patients in the follow-up period use more health care in
the hospital sector: hospital admissions (1.7 versus 4.4
admissions), and inpatient days (10.7 versus 25.4 days
per remainder life time) and substantially less in the
primary sector: outpatient services (83.6 versus 30.6
visits per follow-up). These differences however could be
explained from differences in study designs, as VeraLlonch et al.’s study included only patients with breast
cancer who might have been on average less severe than
patients in the present study. Furthermore, the abovementioned differences in follow-up period could be part
of the explanation.
Figure 2 Lifetime healthcare costs per patient for four different treatment regimes: conservative treatment (T1), decompression (T2),
decompression + instrumentation (T3) and decompression + instrumentation + reconstruction (T4).
Tipsmark et al. BMC Cancer (2015) 15:354
The present study was conducted from a healthcare
perspective so one must consider omitted costs (informal
care giving by relatives, transportation back and forth
from the hospital, terminal care in the patient’s own
home and over-the-counter medication) if results are to
be compared to societal costs of treating patients with
spinal metastases. A potential limitation of the study
could be a low degree of external validity since the organisation of the treatment of patients with spinal metastases in Denmark is centralised compared to other
countries. This centralisation, however, makes the study
population representative. Furthermore, considerations
must also be given to differences in price standards between countries.
Since this analysis does not compare treatment costs
and effects, these results cannot be used to conclude on
the cost-effectiveness of the treatments. Guided by
predicted survival, patients were carefully selected for a
specific treatment regime and this is one of the reasons
for T1 patients having the shortest survival and likewise
the lowest cost etc.
Conclusion
We believe that the results of the present study can be
used to inform the cost side of future cost effectiveness
analyses, thereby supporting decision making about
costly end-of-life treatment. The results of such a cost
effectiveness analysis would contribute to optimising the
basis of decision-making. Future research of societal
perspective would be of great interest as well as investigating quality of life parameters among this patient
group.
The index treatment accounts for almost half of lifetime health care costs from treatment initiation until
death followed by readmissions and outpatient visits.
Hospice placements and primary care account for only a
minor share of total costs. As expected, lifetime healthcare costs are positively association with invasiveness of
treatment.
Competing interests
Benny Dahl and Søren Schmidt Morgen received research funding from
Medtronic Denmark, Globus Medical and Lundbeck Foundation. The
remaining authors had no competing interests to declare.
Authors’ contributions
MW, SSM, CB and BD provided the data. LST and RS designed the study and
undertook the statistical analysis. LST drafted the manuscript. All authors
read, edited and approved the final manuscript.
Acknowledgement
The study and the authors of this article were part of the CESpine project
(www.cespine.dk), which was financed by the Danish Strategic Research
Council (grant 2142-08-0017).
Author details
1
Health Economics, CFK - Public Health and Quality Improvement, Central
Denmark Region, Olof Palmes Allé 15, 8200 Aarhus N, Denmark. 2Department
of Orthopaedic E, Aarhus University Hospital, Nørrebrogade 44, 8000 Aarhus
Page 7 of 7
C, Denmark. 3Department of Orthopedic Surgery, Spine Unit, Rigshospitalet
and University of Copenhagen, Blegdamsvej 9, 2100 København Ø, Denmark.
4
Department of Public Health, Aarhus University, Bartholins Allé 2, 8000
Aarhus C, Denmark. 5Department of Clinical Medicine, Aarhus University,
Palle Juul-Jensens Boulevard 82, 8200 Aarhus N, Denmark.
Received: 30 April 2014 Accepted: 23 April 2015
References
1. Liang T, Wan Y, Zou X, Peng X, Liu S. Is surgery for spine metastasis
reasonable in patients older than 60 years? Clin Orthop Relat Res.
2013;471:628–39.
2. Katagiri H, Takihashi M, Inagki J, Kobayashi H, Sugiura H, Yamamura S, et al.
Clinical results of nonsurgical treatment for. Int J Radiat Oncol Biol Phys.
1998;42:1127–32.
3. Coleman RE. Metastatic bone disease: clinical features, pathophysiology and
treatment strategies. 2001. p. 165–76.
4. Patchell R, Tibbs P, Regine WF, Payne R, Saris S, Kryscio RJ, et al. Direct
decompressive surgical resection in the treatment of spinal cord
compression caused by metastatic cancer: a randomised trial. Lancet.
2005;366:643–8.
5. Clark PE, Torti FM. Prostate cancer and bone metastases: medical
treatment. Clin Orthop Relat Res. 2003;(415 Suppl):S148–57. http://
www.ncbi.nlm.nih.gov/pubmed/14600605.
6. Roodman GD. Mechanisms of bone metastasis. N Engl J Med.
2004;350:1655–64.
7. Bünger CE, Laursen M, Hansen ES, Neumann P, Christensen FB, Høy K, et al.
A new algorithm for the surgical treatment of spinal metastases. Curr Opin
Orthop. 1999;10:101–5.
8. Tokuhashi Y, Matsuzaki H, Oda H, Oshima M, Ryu J. A revised scoring system
for preoperative evaluation of metastatic spine tumor prognosis. Spine
(Phila Pa 1976). 2005;30:2186–91.
9. Tomita K, Kawahara N, Kobayashi T, Yoshida A, Murakami H, Akamaru T. Surgical
strategy for spinal metastases. Spine (Phila Pa 1976). 2001;26:298–306.
10. Wang M, Bünger CE, Li H, Wu C, Høy K, Niedermann B, et al. Predictive
value of Tokuhashi scoring systems in spinal metastases, focusing on
various primary tumor groups: evaluation of 448 patients in the Aarhus
spinal metastases database. Spine (Phila Pa 1976). 2012;37:573–82.
11. Kalseth J, Halsteinli V, Halvorsen T, Kalseth B, Anthun K, Peltola M, et al.
Costs of cancer in the Nordic countries. Trondheim. 2011; Retrieved from
/>2FReports%2FReportCostsofCancer_FinalVersion18Mai2011.pdf.
12. National Institute for Health and Care Excellence. Appraising End of Life
Medicines. 2008. p. 1–5.
13. Hess G, Barlev A, Chung K, Hill JW, Fonseca E. Cost of palliative radiation to
the bone for patients with bone metastases secondary to breast or prostate
cancer. Radiat Oncol. 2012;7:168.
14. Barlev A, Song X, Ivanov B, Setty V, Chung K. Payer costs for inpatient
treatment of pathologic fracture, surgery to bone, and spinal cord
compression among patients with multiple myeloma or bone
metastasis secondary to prostate or breast cancer. J Manag Care
Pharm. 2010;16:693–702.
15. Vera-Llonch M, Weycker D, Glass A, Gao S, Borker R, Qin A, et al. Healthcare
costs in women with metastatic breast cancer receiving chemotherapy as
their principal treatment modality. BMC Cancer. 2011;11:250.
16. Chew C, O’Dwyer PJ, Edwards R. Health service cost associated with
percutaneous vertebroplasty in patients with spinal metastases. Clin Radiol.
2013;68:776–9.
17. Lin DY, Feuer EJ, Etzioni R, Wax Y. Estimating medical costs from incomplete
follow-up data. Int Biometric Soc. 1997;53:419–34.