Mechanism study of peptide GMBP1 and its receptor GRP78 in modulating gastric cancer MDR by iTRAQ-based proteomic analysis
Bạn đang xem bản rút gọn của tài liệu. Xem và tải ngay bản đầy đủ của tài liệu tại đây (4.65 MB, 14 trang )
Wang et al. BMC Cancer (2015) 15:358
DOI 10.1186/s12885-015-1361-3
RESEARCH ARTICLE
Open Access
Mechanism study of peptide GMBP1 and its
receptor GRP78 in modulating gastric cancer
MDR by iTRAQ-based proteomic analysis
Xiaojuan Wang†, Yani Li†, Guanghui Xu, Muhan Liu, Lin Xue, Lijuan Liu, Sijun Hu, Ying Zhang, Yongzhan Nie,
Shuhui Liang*, Biaoluo Wang* and Jie Ding*
Abstract
Background: Multidrug resistance (MDR) is a major obstacle to the treatment of gastric cancer (GC). Using a phage
display approach, we previously obtained the peptide GMBP1, which specifically binds to the surface of MDR gastric
cancer cells and is subsequently internalized. Furthermore, GMBP1 was shown to have the potential to reverse the
MDR phenotype of gastric cancer cells, and GRP78 was identified as the receptor for this peptide. The present study
aimed to investigate the mechanism of peptide GMBP1 and its receptor GRP78 in modulating gastric cancer MDR.
Methods: Fluorescence-activated cell sorting (FACS) and immunofluorescence staining were used to investigate
the subcellular location and mechanism of GMBP1 internalization. iTRAQ was used to identify the MDR-associated
downstream targets of GMBP1. Differentially expressed proteins were identified in GMBP1-treated compared to untreated
SGC7901/ADR and SGC7901/VCR cells. GO and KEGG pathway analyses of the differentially expressed proteins revealed
the interconnection of these proteins, the majority of which are involved in MDR. Two differentially expressed proteins
were selected and validated by western blotting.
Results: GMBP1 and its receptor GRP78 were found to be localized in the cytoplasm of GC cells, and GRP78 can mediate
the internalization of GMBP1 into MDR cells through the transferrin-related pathway. In total, 3,752 and 3,749 proteins
were affected in GMBP1-treated SGC7901/ADR and SGC7901/VCR cells, respectively, involving 38 and 79 KEGG pathways.
Two differentially expressed proteins, CTBP2 and EIF4E, were selected and validated by western blotting.
Conclusion: This study explored the role and downstream mechanism of GMBP1 in GC MDR, providing insight into the
role of endoplasmic reticulum stress protein GRP78 in the MDR of cancer cells.
Keywords: Gastric cancer, Multidrug resistance, Peptide GMBP1, GRP78
Background
Gastric cancer (GC) remains the fourth most common
malignancy and the second leading cause of cancer-related
death worldwide [1]. Although surgery is effective for most
patients, chemotherapy remains the primary treatment for
advanced gastric cancer [2]; nonetheless, therapies often fail
due to the multidrug resistance (MDR) exhibited by some
cancer cells. MDR is a phenomenon in which cancer cells
that are exposed to one anti-cancer drug become resistant
* Correspondence: ; ;
†
Equal contributors
State Key Laboratory of Cancer Biology and Xijing Hospital of Digestive
Diseases, Xijing Hospital, Fourth Military Medical University, 127 Changle
Western Road, Xi’an 710032, China
to several other chemotherapy drugs that are structurally
and functionally different from the initial drug [3,4]. MDR
is a multifactor event in which several mechanisms act
simultaneously, including increased drug efflux, DNA repair
activity, and altered survival and apoptotic signaling pathways [5-7]. Although there have been many pathogenesis
studies on tumor MDR, the mechanisms of MDR are intricate and have not yet been fully elucidated [8]. Moreover,
there is an urgent need to find novel approaches to reverse
MDR in GC.
Short peptides with rapid blood clearance, high tissue
penetration and diffusion, non-immunogenicity and a high
affinity for target tumor cells have attracted great interest in
recent years [9-11]. In a previous study using a phage
© 2015 Wang et al.; licensee BioMed Central. This is an Open Access article distributed under the terms of the Creative
Commons Attribution License ( which permits unrestricted use, distribution, and
reproduction in any medium, provided the original work is properly credited. The Creative Commons Public Domain
Dedication waiver ( applies to the data made available in this article,
unless otherwise stated.
Wang et al. BMC Cancer (2015) 15:358
display approach, we analyzed a peptide, GMBP1, that was
specifically bound to the surface of MDR gastric cancer
cells and that had the potential to be internalized into these
cells and reverse the gastric MDR phenotype. GRP78 was
later identified as a receptor for this peptide [12]. Importantly, exploring novel agents that can reverse MDR in GC
is necessary for the improvement of chemotherapy in GC
patients.
Proteomics is used as a powerful tool to accurately monitor and quantitatively detect changes in protein expression
in response to drug treatment, and this approach has been
widely used to investigate the mechanisms of action of
chemicals on cancer cells [13-15]. Some technologies have
been widely used in proteomics, including 2DE, SILAC,
2D-DIGE, and iTRAQ [16-20]. 2DE is an important proteomic technique and is widely used in comparative studies
of protein expression levels. However, this technique has
several disadvantages, including poor reproducibility
between gels, low sensitivity in the detection of proteins in
low concentrations and hydrophobic membrane proteins,
limited sample capacity and a low linear range in
visualization procedures [21,22]. Furthermore, only a
limited number of proteins have been identified using the
existing techniques. iTRAQ-based analysis, a technique
that has been developed to quantitatively investigate
changes in protein abundance in various biological
samples with high accuracy and reproducibility [23,24],
enables the differential labeling of peptides from
distinct proteomes. In addition, the use of iTRAQ reagents with four to eight different tags allows for
multiplexing ability [25]. High-throughout techniques
can be used to screen MDR-related proteins and to
study the mechanisms of gastric cancer drug resistance,
and proteomics-based iTRAQ is an excellent choice for
studying MDR mechanisms. Indeed, this approach has
been successfully employed to identify differentially
expressed proteins in gastric cancer [26].
Adriamycin and vincristine have been used to treat
various cancers, and these drugs are accepted worldwide as
first-line anti-cancer drugs for GC chemotherapy. However,
their use remains limited because of the rapid development
of MDR; thus, it is necessary to explore the mechanisms
underlying this resistance. To further characterize the
mechanisms of MDR, adriamycin-resistant SGC7901/ADR
cells and vincristine-resistant SGC7901/VCR cells, which
have been widely employed as cell culture models to investigate the mechanism underlying MDR in gastric cancer,
were used in this study. These cell lines were derived from
the human gastric cancer cell line SGC7901 by stepwise
selection in vitro using adriamycin and vincristine and
developed cross-resistance to other anticancer drugs,
including cisplatin, adriamycin, etoposide, mitomycin
C, and 5-fluorouracil (5-FU) [27]. Methods including
FACS and immunofluorescence staining were used in
Page 2 of 14
this study to investigate the mechanism underlying the
internalization of GMBP1. In addition, an iTRAQbased proteomic approach coupled with bioinformatics,
including GO and KEGG analyses, were also applied.
Our work elucidates the molecular mechanism of
GMBP1-induced reversal of MDR in GC, and the results presented here will undoubtedly provide important clues to the mechanisms of MDR in gastric cancer.
Methods
Cell lines and cell culture
Human MDR gastric adenocarcinoma adriamycin-resistant
SGC7901/ADR and vincristine-resistant SGC7901/VCR
cell lines were derived in our laboratory from the human
gastric cancer cell line SGC7901 by stepwise selection
in vitro using adriamycin and vincristine, respectively. The
cells were cultured in RPMI-1640 medium (Thermo Scientific Hyclone, Beijing, China) containing 10% fetal bovine
serum, 100 μg/ml streptomycin and 100 U/ml penicillin
and incubated at 37°C with 5% CO2 in a humidified incubator. To maintain the MDR phenotype, vincristine (final
concentration, 1 μg/ml) was added to the culture medium
of the SGC7901/VCR cells, and adriamycin (final concentration, 0.5 μg/ml) was added to the culture medium of the
SGC7901/ADR cells. Adriamycin (ADR) and vincristine
(VCR) were dissolved in normal saline at the indicated
concentrations.
Transient transfection
For knockdown of GRP78, GC cells were transfected with
a small interfering RNA (siRNA) targeting GRP78: sense
5′-GGAGCGCAUUGAUACUAGATT-3′ and antisense
5′-UCUAGUAUCAAUGCGCUCCTT-3′ [28]. siRNA targeting green fluorescent protein (GFP) was purchased
from GenePharma (Shanghai, China) and served as a
negative control. Both siRNAs were used at a final concentration of 80 nmol/l. The cells were transfected in sixwell plates according to the manufacturer’s instructions.
Ten microliters of each siRNA was used with 5 μl of
Lipofectamine 2000 per well. The transfected cells were
monitored for GFP under a fluorescence microscope.
Immunofluorescence staining
Cells were cultured on cover slips and fixed with acetone
at 4°C for 30 min, blocked with 10% normal rabbit
serum, and incubated with a goat anti-human GRP78
antibody (1:500; Abcam, USA) overnight at 4°C. Subsequently, the cells were incubated with a secondary
FITC-conjugated anti-goat antibody (1:1,000; Invitrogen,
CA, USA) for 1 h at 37°C. A drop of Prolong Gold antifade reagent with DAPI (Invitrogen, CA, USA) was
added before the cell images were acquired using a
FLUOVIEW FV1000 laser scanning confocal microscope
Wang et al. BMC Cancer (2015) 15:358
Page 3 of 14
(Olympus, Tokyo, Japan). PBS and control siRNA were
used as a negative control.
GMBP1-treated samples. The labeled samples were pooled
before further analysis.
Flow cytometric analysis for uptake assays
Strong cation exchange chromatography separation
Cells were cultured in serum-free RPMI-1640 medium.
After 24 h, the cells were trypsinized, centrifuged at
1,000 rpm for 5 min, harvested and washed with ice-cold
PBS twice. The expression level of GMBP1-GRP78 was
measured by staining the cells with FITC-conjugated
GMBP1 in PBS containing 0.05% bovine serum albumin on
ice. FITC-GMBP1 (200 μg/ml) was incubated with the cells
in growth medium for 1 h at 37°C, and the cells were then
washed twice with ice-cold PBS. After removing unbound
FITC-GMBP1 by washing the cells extensively in PBS, the
surface immunofluorescence of viable cells was measured
using a flow cytometer. FITC-URP was used as a negative
control.
Double immunofluorescence staining
Cells were seeded on cover slips at a density of 106 cells/
ml; experiments were conducted at 24–72 h postseeding. The multidrug-resistant gastric cells SGC7901/
ADR and SGC7901/VCR with GMBP1 were doubly labeled as follows. Briefly, the cells were serum-starved for
2 h in RPMI-1640 medium. The cells were first incubated with FITC-GMBP1 in growth medium at 200 μg/
ml for 1 h at 37°C in the dark and then washed twice
with ice-cold PBS. The cells were then incubated with
Alexa Fluor 594-transferrin (25 μg/ml) at 4°C for 3 h in
the dark to stop receptor-mediated endocytosis [29]; the
cells were then incubated at 37°C for 30 min to initiate
the uptake of FITC-GMBP1, after which the cells were
washed twice with ice-cold PBS. The cell nuclei were
stained using 4, 6-diamidino-2-phenylindole (DAPI). Cell
images were acquired using a FLUOVIEW FV1000 laser
scanning confocal microscope (Olympus, Tokyo, Japan).
Protein sample preparation and iTRAQ labeling
The treated and untreated SGC7901/ADR and SGC7901/
VCR cells were harvested and lysed in lysis buffer and centrifuged at 15,000 rpm for 30 min at 4°C. The supernatants
were collected, and the total protein concentration was determined using a Bradford protein assay kit. For each
sample, 100 μg of protein was precipitated by adding six
volumes of cold acetone and incubating at −20°C for 4 h.
The precipitated protein was dissolved in solution buffer
and denatured, and the cysteines were then blocked according to the manufacturer’s instructions (Applied Biosystems).
Each sample was digested with 20 μl of 0.25 μg/μl trypsin
(Promega) solution at 37°C overnight. iTRAQ labels 113
and 118 were used to separately label the control samples
SGC7901/ADR and SGC7901/VCR, respectively, and the
labels 115 and 119 were used to label the corresponding
To reduce sample complexity during the LC-MS/MS
analysis, the pooled samples were diluted 10-fold with
HPRP buffer A (10 mM KH2PO4 in 25% acetonitrile at
pH 3.0) and separated using a 2.1 × 200 mm polysulfoethyl A HPRP column (Poly LC, Columbia, MD,
USA). The column was eluted with a gradient of 0–25%
HPRP buffer B (10 Mm KH2PO4 at pH 3.0 in 25% acetonitrile containing 350 mM KCl) over 30 min followed by
a gradient of 25-100% HPRP buffer B over 40 min. The
fractions were collected at 1-min intervals. These HPRP
fractions were lyophilized in a vacuum concentrator and
subjected to C18 clean-up using a C18 Discovery DSC18 SPE column (Thermo). The cleaned fractions were
then lyophilized again and stored at −20°C until analyzed
by mass spectrometry.
Nano-LC-MS/MS analysis
The mass spectrometric analysis was performed using a
nano-LC column coupled online to a QStarXL mass spectrometer (Applied Biosystems). Peptides were loaded onto
a 75 cm × 10 cm, 3-mm fused silica C18 capillary column,
and mobile phase elution was performed using buffer A
(0.1% formic acid in 2% acetonitrile/98% Milli-Q water)
and buffer B (0.1% formic acid in 98% acetonitrile/2%
Milli-Q water). The peptides were eluted using a gradient
from 2% buffer B to 100% buffer B over 90 min at a flow
rate of 300 nl/min. The LC eluent was directed to an ESI
source for Q-TOF-MS analysis. The mass spectrometer
was set to perform information-dependent acquisition
(IDA) in the positive ion mode for a selected mass
range of 300–2,000 m/z. Peptides with +2 to +4 charge
states were selected for tandem mass spectrometry, and
the time of summation of MS/MS events was set to 3 s.
The two most abundantly charged peptides above a
10-count threshold were selected for MS/MS and were
dynamically excluded for 60 s with a ±50-mmu mass
tolerance.
Protein identification and relative quantization
The raw data were analyzed using Proteome Discoverer
1.4 (Thermo Fisher Scientific). The software was connected to a Mascot Search Engine server version 2.2.4
(Matrix Science, London, UK) and to a Sequest Search
Engine version 28.0 (Thermo Fisher Scientific). The confidence value for each peptide was calculated based on
the agreement between the experimental and theoretical
fragmentation patterns. Each protein was assigned a
confidence score (0% to 100%) based on the confidence
scores of its constituent peptides based on unique spectral patterns. Proteins with confidence scores of greater
Wang et al. BMC Cancer (2015) 15:358
than 90% and with at least 1 peptide of 95% identification confidence were used for further quality control
and differential expression analyses. Each protein also
received quantitative scores for each of the eight-iTRAQ
tags to calculate the relative expression levels. In this experiment, the relative expression levels of proteins in different samples were calculated using a normal sample as
the reference sample.
Bioinformatic analysis of differentially expressed proteins
The theoretical pI values and molecular weights (MWs) of
the identified proteins were obtained from the UniProt
protein sequence database. Functional enrichment
analysis was performed using Gene Ontology (GO)
( and GO annotation was
applied to describe the functions of the differentially
expressed proteins, which were classified into three major
categories: cellular component, molecular function, and
biological process [30]. Pathway analysis was performed
by KEGG mapping. Both assays proved statistically significant with p-values of less than 0.01 and 0.05, respectively.
Western blotting assay
Proteins were extracted from cells in log-phase growth and
were separated using SDS–PAGE. A western blot analysis
was then performed according to standard procedures.
Briefly, total proteins were resolved by 10% SDS-PAGE and
then transferred to nitrocellulose membranes. After incubating with primary antibodies at 4°C overnight, the nitrocellulose membranes were then washed three times with
Tris-buffered saline containing Tween-20 (TBST) and incubated with horseradish peroxidase-conjugated secondary
antibodies (1:2,000; Santa Cruz, USA) for 2 h at room
temperature. The membranes were then washed again in
TBS-T and visualized using an Enhanced ChemiLuminescence Kit (ECL-Kit, Santa Cruz, USA). Anti-CTBP2 and
anti-EIF4E primary antibodies used for western blotting
(1:500 dilutions; Abcam, USA), and an anti-β-actin antibody (Beyotime, China) was used as an internal reference.
The experiments were repeated three times.
Statistical analysis
GraphPad Prism and image J software were used for data
analysis. The results are presented as the mean ± standard deviation. Student’s t-test was performed to evaluate
differences between the western blotting analysis results.
P-values of less than 0.05 were considered statistically
significant.
Results
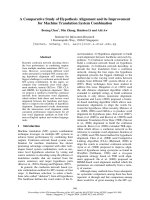
Subcellular localization of GMBP1 and its receptor GRP78
in multidrug-resistant gastric cells
In the present study, the localization of GMBP1 in
multi-drug resistant gastric cells SGC7901/ADR and
Page 4 of 14
SGC7901/VCR was demonstrated by immunofluorescence staining and flow cytometric assays. As shown in
the immunofluorescence staining assay, in both cell
lines, positive staining was mainly located in the cytoplasm and was observed as a green color in the FITCGMBP1 group; in contrast, the PBS group exhibited no
staining (Figure 1(A,B)). Similarly, flow cytometry analysis showed higher fluorescence intensity for FITCGMBP1 bound to SGC7901/ADR and SGC7901/VCR
cells compared to the negative control FITC-URP group
(Figure 1(C)). These results demonstrate that GMBP1
and its receptor GRP78 were located in the cytoplasm of
gastric cancer cells but not in the control group.
Internalization of the GMBP1 peptide into multidrugresistant gastric cells
To explore the role of GRP78 in the internalization of the
GMBP1 peptide into multi-drug resistant gastric cells, the
specific downregulator GRP78 siRNA (siGRP78) and
control siRNA (siCtrl) were transfected into SGC7901/
ADR and SGC7901/VCR cells. Western blot and RT-PCR
analyses showed that the transfection of SGC7901/ADR
and SGC7901/VCR cells with the specific GRP78 siRNA
resulted in a marked inhibition of GRP78 protein expression and decreased mRNA levels compared to cells transfected with the control siRNA (p < 0.01) (Figure 2(A,B)).
An immunofluorescence staining assay showed that the
control group incubated with FITC-GMBP1 did exhibit
green staining (Figure 2(C, D)); the same results (data not
shown) were observed using the GRP78 inhibitor. These
results suggest that GMBP1 was internalized into the
multi-drug resistant gastric cells and that this internalization was receptor mediated.
The mechanism of GRP78-mediated GMBP1 internalization
in multidrug-resistant gastric cells
To further characterize the mechanism of GRP78-mediated
GMBP1 internalization in multi-drug resistant gastric cells,
a double immunofluorescence staining assay was used. The
effects of GRP78-mediated GMBP1 internalization on the
uptake of Alexa Fluor 594-transferrin by the multi-drug resistant gastric cells are shown in Figure 3. Cells were doubly
labeled with FITC-GMBP1 (green) and Alexa Fluor
594-transferrin (red) under control conditions at 37°C
for 30 min; both FITC-GMBP1 and Alexa Fluor 594transferrin were internalized, and FITC-GMBP1 was
observed on the cell surface and in the cytoplasm
(Figure 3(a, i)), whereas transferrin was observed primarily in the cytoplasm (Figure 3(b, j)). The labeled
proteins were found to colocalize in the cytoplasm and
perinuclear regions of the cells (Figure 3(d, l)). Furthermore, when chlorpromazine (CPZ), an inhibitor of
clathrin-dependent endocytosis [31,32], blocked transferrin uptake, the red fluorescence of Alexa Fluor 594-
Wang et al. BMC Cancer (2015) 15:358
Figure 1 (See legend on next page.)
Page 5 of 14
Wang et al. BMC Cancer (2015) 15:358
Page 6 of 14
(See figure on previous page.)
Figure 1 Subcellular localization of GMBP1 and its receptor GRP78 in SGC7901/ADR and SGC7901/VCR. (A-B): a, d, g, j: The cytoplasmic localization of
internalized GRP78 (green). b, e, h, k: Nuclear staining with 4, 6-diamidino-2-phenylindole (DAPI; blue). c, f, i, l: Merged images showing the relationship
between GRP78 and the nucleus. (C): The internalization of the GMBP1 peptide into SGC7901/ADR and SGC7901/VCR cells. FITC-GMBP1
bound to SGC7901/ADR and SGC7901/VCR cells exhibited higher fluorescence intensity than the negative control FITC-URP group.
transferrin was barely detectable (Figure 3(f, n)), and
the green fluorescence of FITC-GMBP1 was also
greatly reduced (Figure 3(e, m)). These results showed
that the GRP78-mediated internalization of GMBP1 occurred through a clathrin-independent, transferrinrelated pathway.
and number of residues, were calculated using PEPSTATS
in EMBOSS. The grand average hydropathy (GRAVY)
values were calculated as the arithmetic mean of the sum
of the hydropathic indices of each amino acid.
Classification of differentially expressed proteins
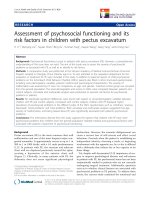
Proteome analysis
Our goal was to identify differentially expressed proteins
that are related to MDR in GC and subsequently, to
validate a subset of these proteins. We used cells from
the multidrug-resistant gastric cell lines SGC7901/ADR
and SGC7901/VCR for this study, and a schematic flow
of the iTRAQ method used is shown in Figure 4. To increase the coverage of protein identification and/or the
confidence in the data generated, proteins from these
cell lines were labeled with iTRAQ reagents (the 113 tag
for cell line SGC7901/ADR and the 115 tag for GMBP1treated SGC7901/ADR cells). Thus, the ratio of labels
115 and 113 would indicate the relative abundance of
MDR-related proteins. Similarly, proteins from these cell
lines were also labeled with iTRAQ reagents (the 118
tag for cell line SGC7901/VCR and the 119 tag for
GMBP1-treated SGC7901/VCR cells). Again, the ratio of
labels 119 and 118 would also indicate the relative abundance of MDR-related proteins. To examine the biological reproducibility of the results, duplicate protein
samples were obtained from both control and GMBP1treated groups in two independent experiments. The
iTRAQ analysis was performed in double-duplex style.
All the unique proteins were identified (false discovery
rate < 1%) in the two biological replicates, and linear regression analyses were performed to examine the biological reproducibility of the results. Although the relative
quantification analysis conducted using Protein Pilot 3.0
software includes statistical analysis, most methods are
prone to technical variation; therefore, we included an
additional 1.5-fold change and a 0.8-fold change cutoff
for all iTRAQ ratios to reduce false positives for the
selection of differentially expressed proteins. In total,
143 proteins were differentially expressed in the GMBP1treated SGC7901/ADR cells compared with the SGC7901/
ADR cells: 95 proteins were upregulated and 48 were
downregulated (Additional file 1). For the SGC7901/VCR
cells, 217 proteins were expressed differently following
GMBP1 treatment compared to the control cells: 129 were
upregulated, and 88 were downregulated (Additional file 2).
Protein properties, including pI, molecular weight (MW),
The functional classification of all 3,752 proteins that were
identified in the GMBP1-treated SGC7901/ADR cells is
presented in Figure 5A. Proteins were cataloged according
to biological processes (BPs), molecular functions (MFs),
and cellular components (CCs) according to the GO database. The proteins representing BPs included cellular nitrogen compound metabolic processes (16%), biosynthetic
processes (15%), small molecule metabolic processes (12%),
signal transduction (10%), transport (9%), response to stress
(8%), cellular protein modification processes (8%), anatomical structure development (8%), nucleobase-containing
compound catabolic processes (7%) and cell differentiation
(7%). The MFs of the proteins were classified, and the
largest groups were found to be involved in binding (77%),
oxidoreductase activity (7%), ATPase activity (4%), enzyme
regulator activity (4%), kinase activity (4%) and transmembrane transporter activity (4%). The proteins representing
CCs were classified as cytoplasm (17%), nucleus (17%), protein complex (12%), co-organelle (10%), extracellular region
(9%), cytosol (9%), intracellular (8%), mitochondrion (7%),
plasma membrane (6%) and cytoskeleton (5%).
The functional classification of all 3,749 proteins identified in the GMBP1-treated SGC7901/VCR cells is presented in Figure 5B. Proteins were categorized as BPs, MFs,
and CCs according to the GO database. BP proteins represented cellular nitrogen compound metabolic processes
(17%), biosynthetic processes (16%), signal transduction
(11%), cellular protein modification processes (9%), small
molecule metabolic processes (9%), transport (8%), anatomical structure development (8%), response to stress (8%),
cell differentiation (7%) and nucleobase-containing compound catabolic processes (7%). MF proteins were also classified, and the largest groups were found to be involved in
binding (69%), cytoskeletal protein binding (7%), kinase activity (6%), enzyme regulator activity (6%), ATPase activity
(4%), nucleic acid binding transcription factor activity (4%)
and oxidoreductase activity (4%). Identified CC proteins
were classified as belonging to the nucleus (19%), cytoplasm
(17%), protein complex (13%), organelle (9%), intracellular
(9%), extracellular region (8%), cytosol (8%), plasma membrane (6%), cytoskeleton (6%) and nucleoplasm (5%).
Wang et al. BMC Cancer (2015) 15:358
Page 7 of 14
Figure 2 Internalization of the GMBP1 peptide into SGC7901/ADR and SGC7901/VCR cells. (A): Relative expression of GRP78 in SGC7901/ADR cells and
SGC7901/VCR cells transfected with control-siRNA or GRP78-siRNA, which were confirmed western blot analysis. The values represent the means from three
separate experiments, and the error bars represent the SEM (*P < 0.01). (B): The relative mRNA level of GRP78 in SGC7901/ADR and SGC7901/
VCR cells. (C, D): a, d, g, j: The cytoplasmic localization of FITC-GMBP1 (green). b, e, h, k: Nuclear staining with 4, 6-diamidino-2-phenylindole (DAPI; blue).
c, f, i, l: Merged images showing the relationship between GMBP1 and the nucleus.
The differentially expressed proteins were further defined
based on KEGG ( The proteins were mapped to KEGG pathways based on their
KEGG gene ID. The proteins differentially expressed in
GMBP1-treated SGC7901/ADR and SGC7901/VCR cells
are involved in 38 KEGG pathways and 79 KEGG pathways, respectively (results not shown). All pathways were
statistically significant and based on research. As shown in
Wang et al. BMC Cancer (2015) 15:358
Page 8 of 14
Figure 3 The mechanism of GRP78-mediated GMBP1 internalization into SGC7901/ADR and SGC7901/VCR cells. (A, B): a, i: FITC-GMBP1 observed on the
cell surface and in the cytoplasm. b, j: Alexa Fluor 594-transferrin observed primarily in the cytoplasm. e, m: Internalization of FITC-GMBP1 was
strongly decreased after blocking the uptake of Alexa Fluor 594-transferrin. f, n: Chlorpromazine largely blocked the uptake of Alexa Fluor 594-transferrin. c,
g, k, o: Nuclear staining with 4, 6-diamidino-2-phenylindole (DAPI; blue). d, h, l, p: Merged images showing the relationship between GMBP1 and transferrin.
Figure 5C, we used hypergeometric distribution in the
enrichment analysis to prioritize these pathways, and the
top ten KEGG pathways were summarized for both cell
lines. The results (Figure 6(A)) indicated ten significant
(p < 0.05) pathways in the GMBP1-treated SGC7901/ADR
cells, including pathways for HTLV-I infection, Fanconi
anemia, Influenza A, tight junctions, proteoglycans in
cancer, Notch signaling, Jak-STAT signaling, N-glycan biosynthesis, adherens junctions and Wnt signaling. Figure 6(B)
shows the ten most significant pathways in the GMBP1-
treated SGC7901/VCR cells, which included pathways for
adrenergic signaling in cardiomyocytes, PI3K-Akt signaling,
ubiquitin-mediated proteolysis, tight junctions, HTLV-I
infection, AMPK signaling, oxytocin signaling, dopaminergic synapses, gastric acid secretion and glutathione
metabolism. Representative pathways associated with gastric cancer were investigated, including the Notch, Wnt,
p53, PI3K-Akt and calcium signaling pathways. Further
research is required to verify the proposed link between
these pathways and GC MDR.
Wang et al. BMC Cancer (2015) 15:358
Page 9 of 14
Figure 4 The flow chat of iTRAQ method and representative MS/MS spectrum of target proteins. (A): A schematic flow of the iTRAQ method.
(B): A representative MS/MS spectrum showing CTBP2 and EIF4E peptides.
Effects of GMBP1 on several identified targets
Among the proteins that were differentially regulated in the
GMBP1-treated SGC7901/ADR and SGC7901/VCR cells,
those that were the most downregulated in the two cell
lines, EIF4E and CTBP2, are involved in the PI3K/AKT and
the Notch and Wnt signaling pathways. To validate the
effects of GMBP1 on several of the identified targets, a
western blotting assay was performed. As shown in Figure 7,
the expression levels of EIF4E and CTBP2 proteins were
clearly downregulated (p < 0.01). This trend is similar to
that observed for protein expression according to the
iTRAQ analysis.
Discussion
Resistance to chemotherapy is a recurring issue for all
cancer types, and the development of MDR is a major
obstacle to the effective treatment of gastric cancer [33].
However, the mechanism of MDR remains obscure. To
study MDR in gastric cancer, we used as cellular
models two drug-resistant cell lines, SGC7901/VCR
and SGC7901/ADR, which were derived from the
human gastric cancer cell line SGC7901 by stepwise
selection in vitro using adriamycin and vincristine,
respectively. These cell lines have been widely used as
in vitro models for the study of MDR in gastric cancer
[34-37]. Small molecules and short peptides have been
considered for use in novel research on MDR because
they exhibit many advantages, including rapid blood
clearance, high tissue penetration and diffusion, nonimmunogenicity and a high affinity for target tumor
cells [9-11]. For example, in a previous study involving
many peptides, our research team identified two peptides that bind specifically to GC vascular endothelial
cells: GEBP11 and GX1. GX1 was also found to inhibit
tumor growth. Using a phage display approach, we investigated the GMBP1 peptide, which specifically binds
to the surface of gastric cancer MDR cells and exhibits
the potential to be internalized into these cells and
reverse the gastric MDR phenotype. Subsequently,
GRP78 was identified as a receptor for this peptide
Wang et al. BMC Cancer (2015) 15:358
Page 10 of 14
Figure 5 Classification of the identified proteins by GO database. (A): Classification of the proteins that were identified in GMBP1-treated SGC7901/ADR
cells. Biological processes (BPs), cellular components (CCs), and molecular functions (MFs) of all identified proteins, as classified according to
the GO database. (B): Classification of the proteins that were identified in GMBP1-treated SGC7901/VCR cells. Biological processes (BPs), cellular
components (CCs), and molecular functions (MFs) of all identified proteins, as classified according to the GO database.
Figure 6 Classification of the identified proteins by KEGG database. (A): The ten most significant KEGG pathways in GMBP1-treated SGC7901/ADR
cells. (B): The ten most significant KEGG pathways in GMBP1-treated SGC7901/VCR cells.
Wang et al. BMC Cancer (2015) 15:358
Page 11 of 14
Figure 7 A representative western blot analysis of CTBP2 and EIF4E expression in the four cell lines comparing SGC7901/ADR and SGC7901/VCR
cells and GMBP1-treated SGC7901/ADR and SGC7901/VCR cells. The values represent the means from three separate experiments, and the error
bars represent the SEM (*P < 0.01).
[12]. The success of our previous work and the known
advantages of these short peptides encouraged us to
study the effects of GMBP1 on GC MDR.
To further investigate the targeted binding sites and
the subcellular localization of the GMBP1 and GRP78
peptides, we investigated the underlying internalization
mechanism of GMBP1 using immunofluorescence staining
combined with FACS. The results indicated the localization
of GMBP1 and its receptor GRP78 in the cytoplasm of gastric cancer cells. In addition, we found that the internalization of GMBP1 into multidrug-resistant gastric cells was
mediated by its receptor, GRP78. A double immunofluorescence staining assay demonstrated that the uptake of
GMBP1, which was mediated by GRP78, occurred through
a clathrin-independent transferrin-related pathway.
MDR is a multifactorial and multistep process, and a
variety of biological factors are involved in GC MDR.
Therefore, a global view of the interconnectivity of signaling proteins and their actions is critically important
for the successful reversal of GC MDR. To date, proteomics analyses have proved to be powerful tools for
identifying biological markers and for estimating biological networks [15]. Proteomic methods have also
been used to study the mechanisms of GC MDR. For
example, Hu et al. revealed that MVP, one of the differentially expressed proteins found in our study, was
highly expressed in SGC7901/VCR, and MDR was verified using iTRAQ-based proteomics [26]. In the present
study, the iTRAQ-based method was used to analyze
the molecular mechanisms occurring in GMBP1treated multidrug-resistant gastric cells SGC7901/ADR
and SGC7901/VCR. To validate the reliability of this
technology, the iTRAQ results were corroborated by
conducting a literature review (in PubMed) and by
western blot analysis. We determined that 83.6% of the
affected proteins are also associated with other cancers,
indicating that our data are consistent with those of
other researchers. The differentially expressed proteins
that were identified exhibited by a wide range of molecular weight (MW), pI, and GRAVY values. Moreover,
bioinformatics analysis revealed that these proteins are
involved in many BPs in GMBP1-treated SGC7901/
ADR and SGC7901/VCR cells, including cellular nitrogen
compound metabolic processes, biosynthetic processes,
small molecule metabolic processes, signal transduction,
transport, response to stress, cellular protein modification
processes, anatomical structure development, nucleobasecontaining compound catabolic processes and cell differentiation. In GMBP1-treated SGC7901/ADR cells, these
proteins were found to be involved in 38 KEGG pathways
that are connected with each other to form a network.
Furthermore, the proteins identified in GMBP1-treated
SGC7901/VCR cells are involved in 79 KEGG pathways.
These findings illustrate that multiple mechanisms can
cause drug resistance in gastric cancer cells and that
these mechanisms might partially contribute to chemotherapeutic resistance during gastric cancer treatment.
Deregulation of the PI3K/AKT pathway plays a crucial role in the regulation of multiple cellular functions,
including cell growth, proliferation, metabolism, and
angiogenesis. Notably, numerous reports have implicated the PI3K-Akt signaling pathway in gastric cancers
[38]. Among the differentially expressed proteins identified, the level of eukaryotic translation initiation factor 4E (EIF4E) was markedly downregulated in both
GMBP1-treated cell lines, which was confirmed by
western blot analysis. As a member of the PI3K/AKT
pathway, EIF4E has been identified as an oncogene that
plays a role in many malignant diseases, including GC.
Silencing of EIF4E was found to slow proliferation and
arrest the cell cycle in G0/G1 phase in larynx, stomach,
and breast cancer cells [39-41]. These findings indicate
Wang et al. BMC Cancer (2015) 15:358
that EIF4E expression might represent a molecular
target for cancer therapy and lead to the assumption of
a possible role for EIF4E in MDR. Combining our
present and previous work, we hypothesis that the
GMBP1 peptide modulates gastric cancer MDR by
targeting GRP78 and that the expression of GRP78
modulates the expression of EIF4E and MDR1 through
the PI3K/AKT pathway (as shown in Figure 8). Our
study also showed that PPP2R2A, PRKAA1, and PCK2
were overexpressed in GMBP1-treated SGC7901/VCR
cells. These proteins are also members of the PI3K/
AKT pathway, and their function in GC MDR merits
further investigation.
The Notch signaling pathway and the Wnt signaling
pathway are increasingly recognized as critical for
the regulation of drug resistance. C-terminal binding
proteins (CTBPs) are transcriptional corepressors that
mediate the Notch and Wnt pathways, among others.
Of the proteins identified using iTRAQ, C-terminal
binding protein 2 (CTBP2) was downregulated in both
GMBP1-treated cell lines; furthermore, the protein
level of CTBP2 was lower in the GMBP1-treated
SGC7901/ADR and SGC7901/VCR cells than in the
control cells. CTBPs interact with many DNA-binding
transcription factors, including mediators of Wnt, BMP,
and Notch signaling [42,43], GATA factors [44], and
regulators of several key processes, including myogenesis [45], vascularization [46], apoptosis, and cell
adhesion [47]. Paliwal et al. identified the CTBP2 transcription regulator as an ARF-binding protein and observed
that the targeting of CTBP by ARF results in p53independent apoptosis [48]. Furthermore, Paliwal et al.
showed that CTBP might promote tumor proliferation
[49]. Recent studies have shown that MDR phenotype
acquisition is often associated with increased tumor invasion and metastasis [50]. MDR not only prohibits effective
Page 12 of 14
chemotherapy but also exacerbates the metastatic symptoms of cancer patients; CTBP proteins, which had not
previously been associated with MDR, are now shown to
play a role in the development of MDR.
Transcription factors and proteins related to signal
transduction were found to be differentially expressed
between GMBP1-treated and untreated multidrugresistant gastric cells but have not been associated with
MDR to date. The correlation between these proteins
and MDR in gastric cancer cells will be the subject of
future study.
Conclusions
In conclusion, GMBP1 exhibited significant potential to
reverse GC MDR. Our results showed that iTRAQ is a
powerful technique for performing quantitative proteome analysis in relation to drug resistance, and a large
number of differentially expressed proteins were identified in this study. Our results further confirmed that the
GMBP1-GRP78 component plays an important role in
the drug-resistant phenotype of gastric cancer cells.
GMBP1 may therefore represent a novel MDR reversal
agent for the management of GC. Other mechanisms
that act against GC MDR in the GMBP1-GRP78 module
should be investigated further. The data obtained will
prove useful for the study of the mechanism of MDR in
human GC and provide new clues for investigating
MDR in other tumors.
Additional files
Additional file 1: Table S1. iTRAQ analysis of proteins that were
differentially expressed between GMBP1-treated SGC7901/ADR (iTRAQ
115) and SGC7901/ADR (iTRAQ113) cells.
Additional file 2: Table S2. iTRAQ analysis of proteins that were
differentially expressed between GMBP1-treated SGC7901/VCR (iTRAQ
119) and SGC7901/VCR (iTRAQ118) cells.
Abbreviations
GC: Gastric cancer; MDR: Multidrug resistance; FACS: Fluorescence-activated
cell sorting; Itraq: Isobaric tag for relative and absolute quantitation;
LC-MS: Liquid chromatography-mass spectrometry.
Competing interests
The authors declare that they have no competing interests.
Authors’ contributions
XW, SL, BW and JD designed the study and experimental protocols. SH and
YZ directed the proteomic research. XW and YL wrote the first draft of the
manuscript together. GX and ML participated in FACS staining and analysis.
XW, YN and LX completed the protein identification and bioinformatics
analysis. XW participated in protein identification. LL and YL finished the WB
experiments. All authors have read and approved the final manuscript.
Figure 8 Schematic drawing of the mechanism of the GMBP1
peptide in modulating gastric cancer MDR by targeting GRP78.
Acknowledgments
This work was supported by the National Natural Science Foundation of
China (Nos. 81472778,81272516, 81090273, 81090270, 30900674, 30973428)
and the Clinical New Techniques Project of Xijing Hospital (No. XJGX13LZ02).
Wang et al. BMC Cancer (2015) 15:358
Received: 2 February 2015 Accepted: 23 April 2015
References
1. Jemal A, Bray F, Center MM, Ferlay J, Ward E, Forman D. Global cancer
statistics. CA Cancer J Clin. 2011;61(2):69–90.
2. Lage H. An overview of cancer multidrug resistance: a still unsolved
problem. Cell Mol Life Sci. 2008;65(20):3145–67.
3. Zhang D, Fan D. New insights into the mechanisms of gastric cancer
multidrug resistance and future perspectives. Future Oncol. 2010;6(4):527–37.
4. Gottesman MM. Mechanisms of cancer drug resistance. Annu Rev Med.
2002;53:615–27.
5. Kusuhara H, Suzuki H, Terasaki T, Kakee A, Lemaire M, Sugiyama Y.
P-Glycoprotein mediates the efflux of quinidine across the blood–brain
barrier. J Pharmacol Exp Ther. 1997;283(2):574–80.
6. Morrow CS, Diah S, Smitherman PK, Schneider E, Townsend AJ. Multidrug
resistance protein and glutathione S-transferase P1-1 act in synergy to
confer protection from 4-nitroquinoline 1-oxide toxicity. Carcinogenesis.
1998;19(1):109–15.
7. Morrow CS, Smitherman PK, Townsend AJ. Role of multidrug-resistance
protein 2 in glutathione S-transferase P1-1-mediated resistance to
4-nitroquinoline 1-oxide toxicities in HepG2 cells. Mol Carcinog.
2000;29(3):170–8.
8. Yang YX, Chen ZC, Zhang GY, Yi H, Xiao ZQ. A subcelluar proteomic
investigation into vincristine-resistant gastric cancer cell line. J Cell
Biochem. 2008;104(3):1010–21.
9. Curnis F, Arrigoni G, Sacchi A, Fischetti L, Arap W, Pasqualini R, et al.
Differential binding of drugs containing the NGR motif to CD13
isoforms in tumor vessels, epithelia, and myeloid cells. Cancer Res.
2002;62(3):867–74.
10. Brown KC. Peptidic tumor targeting agents: the road from phage
display peptide selections to clinical applications. Curr Pharm Des.
2010;16(9):1040–54.
11. Vicent MJ, Duncan R. Polymer conjugates: nanosized medicines for treating
cancer. Trends Biotechnol. 2006;24(1):39–47.
12. Kang J, Zhao G, Lin T, Tang S, Xu G, Hu S, et al. A peptide derived from
phage display library exhibits anti-tumor activity by targeting GRP78 in
gastric cancer multidrug resistance cells. Cancer Lett. 2013;339(2):247–59.
13. Blackstock WP, Weir MP. Proteomics: quantitative and physical mapping of
cellular proteins. Trends Biotechnol. 1999;17(3):121–7.
14. Gupta N, Benhamida J, Bhargava V, Goodman D, Kain E, Kerman I, et al.
Comparative proteogenomics: combining mass spectrometry and
comparative genomics to analyze multiple genomes. Genome Res.
2008;18(7):1133–42.
15. Dix MM, Simon GM, Cravatt BF. Global mapping of the topography and
magnitude of proteolytic events in apoptosis. Cell. 2008;134(4):679–91.
16. Ong SE, Blagoev B, Kratchmarova I, Kristensen DB, Steen H, Pandey A, et al.
Stable isotope labeling by amino acids in cell culture, SILAC, as a simple
and accurate approach to expression proteomics. Mol Cell Proteomics.
2002;1(5):376–86.
17. Rukmangadachar LA, Kataria J, Hariprasad G, Samantaray JC, Srinivasan A.
Two-dimensional difference gel electrophoresis (DIGE) analysis of sera from
visceral leishmaniasis patients. Clin Proteomics. 2011;8(1):4.
18. Feng H, Li X, Niu D, Chen WN. Protein profile in HBx transfected cells:
a comparative iTRAQ-coupled 2D LC-MS/MS analysis. J Proteomics.
2010;73(8):1421–32.
19. Wang Y, Cheung YH, Yang Z, Chiu JF, Che CM, He QY. Proteomic approach
to study the cytotoxicity of dioscin (saponin). Proteomics. 2006;6(8):2422–32.
20. Poulsen JW, Madsen CT, Young C, Kelstrup CD, Grell HC, Henriksen P, et al.
Comprehensive profiling of proteome changes upon sequential deletion of
deubiquitylating enzymes. J Proteomics. 2012;75(13):3886–97.
21. Gorg A, Drews O, Luck C, Weiland F, Weiss W. 2-DE with IPGs.
Electrophoresis. 2009;30 Suppl 1:S122–32.
22. Weiss W, Gorg A. Sample solublization buffers for two-dimensional
electrophoresis. Methods Mol Biol. 2008;424:35–42.
23. Parent N, Winstall E, Beauchemin M, Paquet C, Poirier GG, Bertrand R.
Proteomic analysis of enriched lysosomes at early phase of camptothecininduced apoptosis in human U-937 cells. J Proteomics. 2009;72(6):960–73.
24. Kolla V, Jeno P, Moes S, Lapaire O, Hoesli I, Hahn S. Quantitative proteomic
(iTRAQ) analysis of 1st trimester maternal plasma samples in pregnancies at
risk for preeclampsia. J Biomed Biotechnol. 2012;2012:305964.
Page 13 of 14
25. Hogeweg P. The roots of bioinformatics in theoretical biology. Plos Comput
Biol. 2011;7(3):e1002021.
26. Hu HD, Ye F, Zhang DZ, Hu P, Ren H, Li SL. iTRAQ quantitative analysis of
multidrug resistance mechanisms in human gastric cancer cells. J Biomed
Biotechnol. 2010;2010:571343.
27. Yang YX, Xiao ZQ, Chen ZC, Zhang GY, Yi H, Zhang PF, et al. Proteome
analysis of multidrug resistance in vincristine-resistant human gastric cancer
cell line SGC7901/VCR. Proteomics. 2006;6(6):2009–21.
28. Tsutsumi S, Namba T, Tanaka KI, Arai Y, Ishihara T, Aburaya M, et al.
Celecoxib upregulates endoplasmic reticulum chaperones that inhibit
celecoxib-induced apoptosis in human gastric cells. Oncogene.
2006;25(7):1018–29.
29. Ishizaka N, Griendling KK, Lassegue B, Alexander RW. Angiotensin II type 1
receptor: relationship with caveolae and caveolin after initial agonist
stimulation. Hypertension. 1998;32(3):459–66.
30. Zhong XW, Zou Y, Liu SP, Yi QY, Hu CM, Wang C, et al. Proteomic-based
insight into Malpighian tubules of silkworm Bombyx mori. PLoS One.
2013;8(9):e75731.
31. Schubert W, Frank PG, Razani B, Park DS, Chow CW, Lisanti MP.
Caveolae-deficient endothelial cells show defects in the uptake and
transport of albumin in vivo. J Biol Chem. 2001;276(52):48619–22.
32. Gustavsson J, Parpal S, Karlsson M, Ramsing C, Thorn H, Borg M, et al.
Localization of the insulin receptor in caveolae of adipocyte plasma
membrane. Faseb J. 1999;13(14):1961–71.
33. Fan K, Fan D, Cheng LF, Li C. Expression of multidrug resistance-related
markers in gastric cancer. Anticancer Res. 2000;20(6C):4809–14.
34. Xia L, Zhang D, Du R, Pan Y, Zhao L, Sun S, et al. miR-15b and miR-16
modulate multidrug resistance by targeting BCL2 in human gastric cancer
cells. Int J Cancer. 2008;123(2):372–9.
35. Li T, Wang H, Sun Y, Zhao L, Gang Y, Guo X, et al. Transcription factor
CUTL1 is a negative regulator of drug resistance in gastric cancer. J Biol
Chem. 2013;288(6):4135–47.
36. Du J, Pan Y, Shi Y, Guo C, Jin X, Sun L, et al. Overexpression and significance
of prion protein in gastric cancer and multidrug-resistant gastric carcinoma
cell line SGC7901/ADR. Int J Cancer. 2005;113(2):213–20.
37. Zhao Y, You H, Liu F, An H, Shi Y, Yu Q, et al. Differentially expressed gene
profiles between multidrug resistant gastric adenocarcinoma cells and their
parental cells. Cancer Lett. 2002;185(2):211–8.
38. Tapia O, Riquelme I, Leal P, Sandoval A, Aedo S, Weber H, et al. The PI3K/
AKT/mTOR pathway is activated in gastric cancer with potential prognostic
and predictive significance. Virchows Arch. 2014;465(1):25–33.
39. Nathan CO, Amirghahari N, Abreo F, Rong X, Caldito G, Jones ML, et al.
Overexpressed eIF4E is functionally active in surgical margins of head and
neck cancer patients via activation of the Akt/mammalian target of
rapamycin pathway. Clin Cancer Res. 2004;10(17):5820–7.
40. Nasr Z, Robert F, Porco JJ, Muller WJ, Pelletier J. eIF4F suppression in breast
cancer affects maintenance and progression. Oncogene. 2013;32(7):861–71.
41. Liang S, Guo R, Zhang Z, Liu D, Xu H, Xu Z, et al. Upregulation of the eIF4E
signaling pathway contributes to the progression of gastric cancer, and targeting
eIF4E by perifosine inhibits cell growth. Oncol Rep. 2013;29(6):2422–30.
42. Brannon M, Brown JD, Bates R, Kimelman D, Moon RT. XCtBP is a XTcf-3
co-repressor with roles throughout Xenopus development. Development.
1999;126(14):3159–70.
43. Melhuish TA, Wotton D. The interaction of the carboxyl terminus-binding protein
with the Smad corepressor TGIF is disrupted by a
holoprosencephaly mutation in TGIF. J Biol Chem. 2000;275(50):39762–6.
44. Deconinck AE, Mead PE, Tevosian SG, Crispino JD, Katz SG, Zon LI, et al. FOG acts
as a repressor of red blood cell development in Xenopus. Development.
2000;127(10):2031–40.
45. Lu J, McKinsey TA, Zhang CL, Olson EN. Regulation of skeletal myogenesis by
association of the MEF2 transcription factor with class II histone deacetylases.
Mol Cell. 2000;6(2):233–44.
46. Lin Q, Lu J, Yanagisawa H, Webb R, Lyons GE, Richardson JA, et al. Requirement
of the MADS-box transcription factor MEF2C for vascular development.
Development. 1998;125(22):4565–74.
47. Grooteclaes M, Deveraux Q, Hildebrand J, Zhang Q, Goodman RH, Frisch SM.
C-terminal-binding protein corepresses epithelial and proapoptotic gene
expression programs. Proc Natl Acad Sci U S A. 2003;100(8):4568–73.
48. Paliwal S, Pande S, Kovi RC, Sharpless NE, Bardeesy N, Grossman SR.
Targeting of C-terminal binding protein (CtBP) by ARF results in
p53-independent apoptosis. Mol Cell Biol. 2006;26(6):2360–72.
Wang et al. BMC Cancer (2015) 15:358
Page 14 of 14
49. Paliwal S, Kovi RC, Nath B, Chen YW, Lewis BC, Grossman SR. The
alternative reading frame tumor suppressor antagonizes hypoxia-induced
cancer cell migration via interaction with the COOH-terminal binding
protein corepressor. Cancer Res. 2007;67(19):9322–9.
50. Kerbel RS, Kobayashi H, Graham CH. Intrinsic or acquired drug resistance
and metastasis: are they linked phenotypes? J Cell Biochem. 1994;56(1):37–47.
Submit your next manuscript to BioMed Central
and take full advantage of:
• Convenient online submission
• Thorough peer review
• No space constraints or color figure charges
• Immediate publication on acceptance
• Inclusion in PubMed, CAS, Scopus and Google Scholar
• Research which is freely available for redistribution
Submit your manuscript at
www.biomedcentral.com/submit