MicroRNA-10a is reduced in breast cancer and regulated in part through retinoic acid
Bạn đang xem bản rút gọn của tài liệu. Xem và tải ngay bản đầy đủ của tài liệu tại đây (857.32 KB, 8 trang )
Khan et al. BMC Cancer (2015) 15:345
DOI 10.1186/s12885-015-1374-y
RESEARCH ARTICLE
Open Access
MicroRNA-10a is reduced in breast cancer and
regulated in part through retinoic acid
Sonja Khan1, Deirdre Wall2, Catherine Curran1, John Newell2, Michael J Kerin1 and Roisin M Dwyer1*
Abstract
Background: MicroRNAs (miRNAs) are short non-coding RNA molecules that play a critical role in mRNA cleavage
and translational repression, and are known to be altered in many diseases including breast cancer. MicroRNA-10a
(miR-10a) has been shown to be deregulated in various cancer types. The aim of this study was to investigate miR-10a
expression in breast cancer and to further delineate the role of retinoids and thyroxine in regulation of miR-10a.
Methods: Following informed patient consent and ethical approval, tissue samples were obtained during surgery.
miR-10a was quantified in malignant (n = 103), normal (n = 30) and fibroadenoma (n = 35) tissues by RQ-PCR. Gene
expression of Retinoic Acid Receptor beta (RARβ) and Thyroid Hormone receptor alpha (THRα) was also quantified in the
same patient samples (n = 168). The in vitro effects of all-trans Retinoic acid (ATRA) and L-Thyroxine (T4) both individually
and in combination, on miR-10a expression was investigated in breast cancer cell lines, T47D and SK-BR-3.
Results: The level of miR-10a expression was significantly decreased in tissues harvested from breast cancer patients
(Mean (SEM) 2.1(0.07)) Log10 Relative Quantity (RQ)) compared to both normal (3.0(0.16) Log10 RQ, p < 0.001) and benign
tissues (2.6(0.17) Log10 RQ, p < 0.05). The levels of both RARβ and THRα gene expression were also found to be decreased
in breast cancer patients compared to controls (p < 0.001). A significant positive correlation was determined between
miR-10a and RARβ (r = 0.31, p < 0.001) and also with THRα (r = 0.32, p < 0.001). In vitro stimulation assays revealed miR-10a
expression was increased in both T47D and SK-BR-3 cells following addition of ATRA (2 fold (0.7)). While T4 alone did not
stimulate miR-10a expression, the combination of T4 and ATRA was found to have a positive synergistic effect.
Conclusion: The data presented supports a potential tumour suppressor role for miR-10a in breast cancer, and highlights
retinoic acid as a positive regulator of the microRNA.
Keywords: MicroRNA (miRNA), MicroRNA-10a (miR-10a), Breast cancer, Retinoic acid (RA), Retinoic acid receptor beta
(RARβ)
Background
MicroRNAs (miRNAs) are an important class of short
non-coding RNA molecules proven to have a critical
role in mRNA cleavage or decay [1]. miRNAs play
crucial roles in a variety of physiological as well as
pathological processes including breast cancer [2]. They
have been shown to be dysregulated in both tissue
and circulation of cancer patients [3-7].
miR-10a is located on chromosome 17q21.32 and is a
member of the HOX gene cluster (HOXB and HOXD)
[8]. In the miR-10 family, particularly miR-10a/b display
relevant roles in developmental pathways which also
* Correspondence:
1
Discipline of Surgery, School of Medicine, Clinical Science Institute, National
University of Ireland, Galway, Galway, Ireland
Full list of author information is available at the end of the article
feature in cancer-related processes [9]. Deregulation of
miR-10a has been reported in a number of cancers,
including gastric, cervical and thyroid cancer [10-12].
Loss of miR-10a expression was reported in gastric cancer
tissues, and in cell lines. This report highlighted a potential
tumour suppressor role for miR-10a, partly mediated
through DNA methylation [10]. Elevated expression on the
other hand was observed in primary cervical tumours. This
was associated with an increased risk of developing
metastasis facilitated by its binding to phosphatase
tensin homologue (PTEN) [11]. Inhibition of both
miR-10a and miR-10b was found to promote metastasis in
neuroblastoma cell lines [13,14].
In the context of breast cancer, miR-10a expression has
been shown to display both oncomiR as well as tumour
© 2015 Khan et al.; licensee BioMed Central. This is an Open Access article distributed under the terms of the Creative
Commons Attribution License ( which permits unrestricted use, distribution, and
reproduction in any medium, provided the original work is properly credited. The Creative Commons Public Domain
Dedication waiver ( applies to the data made available in this article,
unless otherwise stated.
Khan et al. BMC Cancer (2015) 15:345
suppressor roles [15-17]. Elevated miR-10a expression in
estrogen receptor (ER)-positive tumours was associated
with a longer relapse-free time following Tamoxifen
treatment [15]. A study by Chang et al. [16] reported
a trend towards increased expression of miR-10a in
breast tumours compared to matched tumour associated
normal tissues. This study implicated both miR-10a/b
expression to be associated with adverse outcomes for
breast cancer patients. A study by Pogribny et al. [18] also
showed higher expression of miR-10a in breast cancer
MCF-7 cell lines with an inbuilt resistance to cisplatin.
This analysis identified a potential role for miR-10a in the
regulation of cellular proteins, including homeobox family
HOXD10, tumour suppressor p27 and ER-alpha (ERα)
[18]. Loss of miR-10a expression has been reported by
Peres-Riva et al. [17]. A microarray analysis was performed on primary breast tumours from patients with
early and late recurrence of the disease. The level of
miR-10a was significantly reduced in patients with
early breast cancer recurrence, potentially predicting
patients at risk of developing recurrence of the disease. A
global miRNA profiling study revealed miR-10a to be
involved in inhibition of HOXD4 expression in breast
cancer cell lines [8].
All-trans-retinoic acid (RA) is a known anti-cancer
agent, implicated in a variety of cancers, including lung,
head and neck, and haematological malignancies [19-21].
This has been shown through its anti-proliferative,
pro-apoptotic and anti-oxidative effects in cell line
and animal models [22]. One of the key regulatory
targets of RA is retinoic acid receptor beta (RARβ)
[23]. It has been revealed to inhibit breast cancer cell
proliferation in vitro [24,25], and has also been shown
to inhibit mammary carcinogenesis in mice [26]. This
group and others have reported reduced expression in
tumours [27-30]. This protein also has been shown to
have a potential tumour suppressor role in breast
cancer and is known to dimerize with Thyroid hormone
receptor alpha (THRα) [27,31-33].
Studies have reported a link between miR-10a and RA
[13,14,34]. In T cells, stimulation with RA alone, or combined with transforming growth factor beta (TGF-β) has
been shown to induce miR-10a expression [34]. This
type of stimulation by RA has also been reported in a
pancreatic and a neuroblastoma cell line model as well as
during smooth muscle differentiation [14,35,36]. Based on
the conflicting studies to date, the aim of this study
was to establish the baseline expression of miR-10a in
breast cancer and any potential relationship with RA
and L-Thyroxine.
Expression of miR-10a was quantified in tissues from
breast cancer patients (n = 103), healthy controls (n = 30)
and patients with benign breast disease (n = 35). Any relationship with clinicopathological details was investigated.
Page 2 of 8
RARβ and THRα gene expression were previously
quantified in the same cohort and any association
with miR-10a expression was examined. The impact
of RA and L-Thyroxine (T4) on miR-10a expression was
also determined.
Methods
Ethics statement
All experimental procedures involving tissue samples
from human participants were approved by the Clinical
Research Ethics Committee (University College Hospital,
Galway). Written informed consent was obtained from
each patient and all clinical investigation was performed
according to the principles expressed in the Declaration
of Helsinki.
Clinical samples
Breast tissue specimens (n = 168) were obtained at
University College Hospital, Galway. The clinical patient
samples comprised of 103 malignant tissue biopsies, 30
normal mammary tissue biopsies obtained at reduction
mammoplasty, and 35 fibroadenoma tissues which are
benign breast disease tissues. Full patient demographics
and clinicopathological details were collected and maintained prospectively (Table 1). Samples were immersed in
RNAlater® (Qiagen) for 24 hours, then the RNAlater® was
removed and the tissue stored at −80°C until required.
Cell lines and culture conditions
T47D and SK-BR-3 breast cancer cell lines were previously
purchased from the American Type Culture Collection
(Manassas, VA). T47D cells were cultured in RPMI-1640
media and SK-BR-3 cells were cultured in McCoy’s 5A.
Both media types were supplemented with 10% fetal bovine
serum (FBS) and 100U/ml penicillin/ 100 μg streptomycin
(P/S). Cells were incubated at 37°C and 5% CO2 with a
media change performed twice weekly and passage every
7 days.
Total and micro RNA extraction
Breast tissue specimens or cell pellets were homogenised
in 1 ml TRIzol® lysis reagent (Invitrogen) as previously
described [27]. Total (large and micro) RNA was
extracted from malignant (n = 103), normal (n = 30) and
fibroadenoma (n = 35) mammary tissue using the RNeasy
Mini Kit (QIAGEN) as per manufacturer’s instructions.
Gene and microRNA analysis
1 μg of large RNA was reverse transcribed using
SuperScript III reverse transcriptase enzyme (200U/μl),
0.1 M DTT, RT-5x Buffer, RNaseOut Ribonulease Inhibitor
(40U/μl), Random primers (3 μg/μl) and dNTP’s (100 mM)Promega (Invitrogen, Carlsbad, CA, USA). TaqMan® Gene
Expression Assays targeting RARβ and THRα (Table 2)
Khan et al. BMC Cancer (2015) 15:345
Page 3 of 8
Table 1 Patient Clinicopathological details
Table 2 Primer sequence of target mRNAs/miRNAs
Breast Clinicopathological Cancer
characteristics
Fibroadenoma Normal
miRNA
Gene
locus
Primer sequence
Number of patients
103
35
RARß
3p24.2
Forward: CTCCCTCCCTGCCTAACCA
Median Patient Age yrs
56 (35–90) 44 (17–62)
THRα
17q11.2
Forward: TGACCATCGCCGTTAT
30
46.5 (24–58)
Menopausal Status
Post
72
Pre
32
Histological Subtype
Invasive Ductal
Reverse: TCCACTGCCTCTTAGCATTTACT
Reverse: GCTTTTGTTGGCGTAC
hsa-miR-10a 17q21.32 Forward: GGAGGGGTACCAGAATCCCATTTTGGCCA
Reverse: GGAGGAAGCTTGCGGAGTGTTTATGTCAACT
78
Invasive Lobular
11
Other
14
Intrinsic Subtype
Luminal A (ER/PR+,
HER2/neu-)
42
Luminal B (ER/PR+,
HER2/neu+)
18
HER2 Over expressing
(ER-, PR-, HER2/neu+)
16
Triple-Negative (ER-, PR-,
HER2/neu-)
16
Unknown
11
Tumour Grade
1
5
2
32
3
55
95°C followed by a 40 cycles at 95°C for 15 seconds and
60°C for 60 seconds. The use of an Inter-assay control
derived from a breast cancer cell line (T47D) on each
reaction allowed comparison of data across plates, and all
reactions were carried out in triplicate with a standard
deviation of < 0.3 between replicates considered acceptable. The relative quantity of mRNA and miRNA expression was calculated using the comparative cycle threshold
(ΔΔCt) [37]. The endogenous controls used for gene
expression were Mitochondrial Ribosomal Protein L19
(MRPL19) and Peptidyl-Prolyl Isomerase A (PPIA) [38].
For the miRNA analysis, let-7a was employed as an
endogenous control [39]. The geometric mean of the
Ct value was used to normalise the data and the sample with the lowest expression level was applied as a
calibrator.
Tumour size
1
19
2
39
3
10
UICC Stage
Stage 1
23
Stage 2
36
Stage 3
21
Stage 4
10
were used in TaqMan® Universal Mastermix (Applied
Biosystems). 100 ng of mature miR-10a (Table 2) was
reverse transcribed using the MultiScribe™-based
High-Capacity cDNA Archive Kit (dNTP 100 mM,
RT Buffer 10x, RNase Inhibitor 20U/μl, Stem loop primer
50nM, MultiScribe RT 50U/μl) (Appied Biosystems). The
resulting cDNA for both mRNA and microRNA was
analysed using the ABI 79000 Fast real-time PCR system
(Applied Biosystems). These reactions were carried out in
a final volume of 10 μl comprising of 0.7 μl cDNA, 5 μl
TaqMan® Universal PCR fast Master Mix (2×), 0.5 μl
TaqMan® primer-probe mix (0.2 μM), Forward primer
(1.5 μM), and Reverse Primer (0.7 μM) (Applied Biosystems).
The RQ-PCR cycle comprised of 10-minute incubation at
In vitro stimulation of breast cancer cell lines with
all-trans retinoic acid (ATRA) and L-thyroxine (T4)
T47D and SK-BR-3 cell lines were seeded at 2.4×10⁴
cells/cm2 in a 6-well plate. The following day, the cells
were exposed to all-trans Retinoic Acid (ATRA, 0.1 μM,
1 μM, 5 μM) or L-Thyroxine (T4, 0.1 μM, 0.5 μM, 5 μM)
for 24 hours. This was carried out to establish optimal
concentrations for the assay [27]. Once optimal concentrations were established (ATRA, 1 μM, 5 μM and T4
0.5 μM), the assay was then performed in triplicate in both
cell lines. The cells were also exposed to a combination of
ATRA (1 μM or 5 μM) and T4 (0.5 μM) for 24 hours.
Controls included cells cultured in the appropriate
diluents used for each stimulant. Dimethyl sulphoxide
(DMSO, 0.5%) for was used to dilute ATRA. Ammonium
hydroxide (NH4OH, 0.1%) was the appropriate diluent for
T4. Cells were harvested at the appropriate time point by
trypsination, centrifuged at 120 × g for 4 mins and the cell
pellet stored at −80°C. Total large and microRNA was
extracted, and the corresponding cDNA analysed using
RQ-PCR targeting miR-10a, RARβ and THRα. The
endogenous controls used were let-7a for miRNA
analysis, and MPRL19 and PPIA for gene expression
analysis as previously described. The data was expressed
relative to cells cultured in appropriate diluent controls.
Khan et al. BMC Cancer (2015) 15:345
Statistical analysis
All data are presented as Mean (SEM), and graphically
represented using box plots and linear scatter plots.
A general ANOVA model was used to compare mean
responses. Scatter plots were displayed using Linear
Regression and Lowess smoother to determine the
relationships between different populations. The level of
relationship was determined using Pearson correlation
coefficients.
Results
miR-10a expression in human breast tissues
MicroRNA extracted from malignant (n = 103), normal
(n = 30) and fibroadenoma (n = 35) breast tissue biopsies
(Table 1) was analysed by RQ-PCR. Levels of miR-10a
were significantly decreased in breast cancer tissues
(n = 103, 2.3(0.08) Log10 RQ) compared to both normal
(n = 30, 3.1(0.17) Log10 RQ, p < 0.001) and fibroadenoma
tissues (n = 35, 2.9(0.15) Log10 RQ, p < 0.001, Figure 1).
miR-10a expression was further stratified based on patient
clinicopathological details. Expression of miR-10a was not
dysregulated across epithelial subtype (p = 0.168), tumour
grade (p = 0.299), tumour stage (p = 0.340) or menopausal
status (p = 0.126, results not shown).
RARβ and THRα gene expression in human breast tissues
Expression levels of RARβ and THRα were previously
reported by this group, on a total of n = 100 breast
tissues, consisting of n = 75 breast cancers, n = 10
fibroadenoma tissues and n = 15 normal breast tissues
[27]. Supplementary data shows results from increasing
patient sample number to include a total of n = 168 breast
tissues for the analysis. This RNA was extracted from an
additional n = 27 breast tumours, n = 20 fibroadenoma
and n = 15 normal breast tissues was quantified by
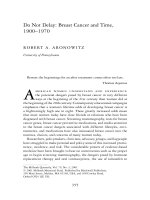
Figure 1 MicroRNA-10a (miR-10a) expression in normal, fibroadenoma
and malignant breast tissues. RQ-PCR of miR-10a revealed significantly
decreased levels of expression in breast cancer n = 103 (Mean(SEM)
2.3(0.08)Log10 Relative Quantity (RQ)) compared to normal tissue
n = 30 (3.1(0.17) Log10 RQ, p < 0.001) and fibroadenoma tissues
(n = 35, 2.9(0.15) Log10 RQ, p < 0.001).
Page 4 of 8
RQ-PCR targeting RARβ and THRα. RARβ gene expression was found to be significantly down-regulated in breast
cancer (n = 101, 0.83 (0.04) Log10 RQ) compared to both
normal (n = 27, 1.35 (0.09) Log10 RQ, p < 0.001) and fibroadenoma tissue (n = 32, 1.49 (0.07) Log10 RQ, p < 0.001,
Additional file 1: Figure S1.). No significant association was
observed with epithelial subtype (p = 0.122), tumour grade
(p = 0.363), tumour stage (p = 0.614) or menopausal status
(p = 0.635, results not shown).
Levels of THRα were found to be significantly decreased
in breast cancer (n = 101, 0.90 (0.03) Log10 RQ) compared
to both normal (n = 27, 1.50 (0.06) Log10 RQ, p < 0.001)
and fibroadenoma tissues (n = 32, 1.28(0.07), p < 0.001,
Additional file 2: Figure S2.). Further analysis revealed
THRα expression was not significantly deregulated across
epithelial subtype (p = 0.116), tumour stage (p = 0.859) or
menopausal status (p = 0.679, results not shown).
Expression of miR-10a across 168 breast tissues
was correlated with the gene expression results for
RARβ and THRα. A significant positive correlation with
RARβ gene expression was observed (r = 0.31, p < 0.001,
Figure 2A). miR-10a expression also revealed a robust
positive correlation with THRα gene expression (r = 0.32,
p < 0.001, Figure 2B).
In vitro stimulation of breast cancer cells with ATRA or T4
alone or in combination
This study was performed to determine the impact of
all-trans retinoic acid (RA) and L-Thyroxine (T4) on
miR-10a expression in vitro. The following concentrations were selected for the analysis, ATRA (1 μM and
5 μM) and T4 (0.5 μM). This was determined based on
preliminary studies, and reflected the most effective
doses. Cells were harvested, and changes in miR-10a
expression were quantified by RQ-PCR.
In the case of the T47D cells, miR-10a expression was
shown to be stimulated at 1 μM ATRA (2.2 fold,
SEM(0.6), p = 0.11) and 5 μM ATRA (2.3 fold, SEM(0.7),
p = 0.2). In the presence of 0.5 μM T4, no stimulation of
miR-10a expression was observed (0.64 fold, (0.08),
p < 0.05). When combining both reagents, a significant
synergistic increase was shown at 1 μM ATRA+ 0.5 μM T4
(3.1 fold, (0.3), p < 0.005) and at 5 μM ATRA+ 0.5 μM T4
(3.4 fold, (0.8), p < 0.05).
In the SK-BR-3 cells, ATRA alone had a significant
impact on miR-10a expression (3.5-4.1 fold (1.2) p < 0.005,
Figure 3B). Similar to the T47D cells, SK-BR-3 cells did
not show a change in miR-10a expression following stimulation with T4 alone (0.7 fold (0.5)). Combining ATRA and
T4 resulted in a synergistic impact on miR-10a expression
(2.5-2.6 fold (0.2), p < 0.005).
The impact of ATRA or T4 on receptors was also
determined. In the T47D cells, RARβ gene expression
was increased by 99–183 fold following stimulation
Khan et al. BMC Cancer (2015) 15:345
Page 5 of 8
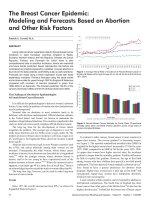
Figure 2 Pearson Correlation of miR-10a and Retinoic Acid Receptor Beta (RARβ) and Thyroid hormone receptor alpha (THRα). (A) Pearson
correlation of miR-10a and RARβ revealed a significant positive correlation (r = 0.31, p < 0.001). (B) The same positive correlation was observed
between miR-10a and THRα (r = 0.32, p < 0.001).
with ATRA alone (Figure 4A). The addition of T4 abrogated this effect (76–92 fold increase). Stimulation with T4
alone or in combination had no impact on expression of
THRα (0.8-1.5 fold, Figure 4B). In the SK-BR-3 cells,
combination of ATRA and T4 stimulated increased RARβ
expression (37–48 fold increase, Figure 4C), with no
change observed in THRα (Figure 4D) or RARβ in any
other conditions.
Discussion
Currently there are varied reports on expression of
miR-10a in breast cancer. Most recently, a study by
Chang et al. [16] quantified miR-10a levels in 108
breast tissues compared to matched tumour associated
normal (TAN) tissues, and found no significant changes
in malignancy. In contrast, the present study quantified
the expression of miR-10a in a total of 168 breast tissues
by RQ-PCR. Expression of miR-10a was found to be
significantly reduced in breast cancer tissues (n = 103)
compared to normal (n = 30) and benign breast disease
tissues (n = 35). The different results observed between
both studies might be as a consequence of the type of
control tissue employed. The present study included
control tissues from patients with no history of the disease
as well as patients with benign breast disease, while the
previous study looked at expression levels in tissue from
the tumour-bearing breast of the same patients. The data
reported here is also supported by another study, showing
Khan et al. BMC Cancer (2015) 15:345
Page 6 of 8
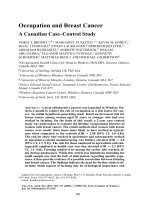
Figure 3 miR-10a Expression in breast cancer cell lines following stimulation with All-trans Retinoic Acid (ATRA) or L-Thyroxine (T4) alone or in
combination. (A) miR-10a expression was quantified by RQ-PCR in T47D cells following 24 hours stimulation with ATRA (1 μM and 5 μM) and T4
(0.5 μM) alone or in combination and (B) in SK-BR-3 cells.
reduced miR-10a expression in 71 Formalin fixed, paraffin
embedded (FFPE) breast tumour tissues from patients
with early recurrence of the disease [17]. This study by
Peres-Riva et al. [17] included a microRNA array on
FFPE tissues, and determined that loss of miR-10a
was associated with the likelihood of developing
metastasis. Reduced expression of miR-10a was also
previously observed in other types of cancers including
gastric cancer and intestinal neoplasia [10,40]. No associations with patient clinicopathological details were observed
in the current study.
RARβ is a known tumour suppressor in breast cancer
[24,27], confirmed in both cell line and animal models.
In the present study, RARβ gene expression was significantly reduced in breast cancer tissues compared to
healthy controls. THRα, which is known to dimerize
with RARβ [32,33], has also previously been implicated
to have a potential tumour suppressor role in breast
cancer tissues, confirmed using western blot analysis
[27,31]. In the present study, reduced expression was
reported in breast cancer tissues compared to healthy
controls. A significant positive correlation was observed
between miR-10a and RARβ and with THRα in breast
tissues. This observation supports a tumour-suppressor
role for miR-10a, and instigated further analysis into the
potential regulation of miR-10a through RA. Previously
miR-10a expression has been shown to be regulated
by RA [35], where elevated miR-10a expression in a
pancreatic cancer cell line model was reduced using
RA inhibitors. In another study, RA elevated miR-10a
expression in T helper cells in vitro, resulting in enhanced
plasticity of these helper cells [34].
Khan et al. BMC Cancer (2015) 15:345
Page 7 of 8
Figure 4 Retinoic acid receptor beta (RARβ) and Thyroid hormone receptor alpha (THRα) gene expression following In Vitro Stimulation in breast
cancer cell lines with ATRA or T4 alone or in combination. (A) RARβ gene expression in T47D cells (B) THRα gene expression in T47D cells (C) RARβ
gene expression in SK-BR-3 cells (D) THRα gene expression in SK-BR-3 cells.
Conclusions
In the present study miR-10a expression was not
affected by stimulation of T47D cells with ATRA or T4
alone. Treatment with a combination of ATRA and T4 on
the other hand showed a greater than 2 fold change in
miR-10a expression. In the Her2 amplified SK-BR-3
cell lines however, ATRA alone showed a 2 fold
change increase in miR-10a expression compared to
the ER positive T47D cells.
Retinoids are used as chemopreventive and anticancer
agents because of their ability to regulate cell differentiation, growth and proliferation and apoptosis [22]. This
data presented supports a potential tumour suppressor
role for miR-10a in breast cancer, and highlights RA
alone or in combination with T4 as a positive regulator
of the miRNA.
Additional files
Additional file 1: Retinoic acid receptor beta (RARβ) gene
expression across all tissue types. RARβ is significantly decreased in
breast cancer (0.8(0.04) log RQ) compared to both normal (1.3(0.09)log
RQ) and benign (1.5(0.07)log RQ) p < 0.001 tissue. Interestingly RARβ is
significantly elevated in benign compared to normal and malignant
tissue (p < 0.001).
Additional file 2: Thyroid hormone receptor alpha (THRα) gene
expression across all tissue types. THRα is significantly decreased in
breast cancer (0.9(0.03)log RQ) compared to both normal (1.5(0.06) log
RQ) and benign (1.3(0.07)log RQ) p < 0.001.
Competing interests
The authors declare that they have no competing interests.
Authors’ contributions
SK performed the analysis, functional assays and drafted the manuscript,
CC aided in collection of tissue specimens and patient clinicopathological
details, DW and JN aided in the statistical analysis of the data sets, MJK aided
in study design and RMD participated in study design, coordination and
manuscript preparation. All authors read and approved the final manuscript.
Acknowledgements
This work was funded by the National Breast Cancer Research Institute
Ireland (NBCRI) and the Irish Cancer Society Collaborative Research Centre
Breast-Predict (CCRC13GAL).
Author details
1
Discipline of Surgery, School of Medicine, Clinical Science Institute, National
University of Ireland, Galway, Galway, Ireland. 2Clinical Research Facility and
School of Mathematics, Statistics and Applied Mathematics, National
University of Ireland, Galway, Galway, Ireland.
Khan et al. BMC Cancer (2015) 15:345
Received: 5 January 2015 Accepted: 27 April 2015
References
1. Bartel DP. MicroRNAs: genomics, biogenesis, mechanism, and function.
Cell. 2004;116(2):281–97. doi:S0092867404000455.
2. Calin GA, Croce CM. MicroRNA signatures in human cancers. Nat Rev
Cancer. 2006;6(11):857–66. doi:10.1038/nrc1997.
3. Bieche I, Vacher S, Lallemand F, Tozlu-Kara S, Bennani H, Beuzelin M, et al.
Expression analysis of mitotic spindle checkpoint genes in breast carcinoma:
role of NDC80/HEC1 in early breast tumorigenicity, and a two-gene signature
for aneuploidy. Mol Cancer. 2011;10:23. doi:10.1186/1476-4598-10-23.
4. Sassen S, Miska EA, Caldas C. MicroRNA: implications for cancer. Virchows
Arch. 2008;452(1):1–10. doi:10.1007/s00428-007-0532-2.
5. Kuhling H, Alm P, Olsson H, Ferno M, Baldetorp B, Parwaresch R, et al.
Expression of cyclins E, A, and B, and prognosis in lymph node-negative
breast cancer. J Pathol. 2003;199(4):424–31. doi:10.1002/path.1322.
6. Rudolph P, Kuhling H, Alm P, Ferno M, Baldetorp B, Olsson H, et al.
Differential prognostic impact of the cyclins E and B in premenopausal and
postmenopausal women with lymph node-negative breast cancer. Int J
Cancer. 2003;105(5):674–80. doi:10.1002/ijc.11132.
7. Heneghan HM, Miller N, Kelly R, Newell J, Kerin MJ. Systemic miRNA-195
differentiates breast cancer from other malignancies and is a potential
biomarker for detecting noninvasive and early stage disease. Oncologist.
2010;15(7):673–82. doi:10.1634/theoncologist.2010-0103.
8. Tan Y, Zhang B, Wu T, Skogerbo G, Zhu X, Guo X, et al. Transcriptional
inhibiton of Hoxd4 expression by miRNA-10a in human breast cancer cells.
BMC Mol Biol. 2009;10:12. doi:10.1186/1471-2199-10-12.
9. Lund AH. miR-10 in development and cancer. Cell Death Differ.
2010;17(2):209–14. doi:10.1038/cdd.2009.58.
10. Jia HY, Zhang ZY, Zou DL, Wang B, Yan YM, Luo M, et al. MicroRNA-10a is
down-regulated by DNA methylation and functions as a tumor suppressor
in gastric cancer cells. PloS One. 2014;9(1). doi:ARTN e88057
doi:10.1371/journal.pone.0088057.
11. Zeng TH, Li GL. MicroRNA-10a enhances the metastatic potential of cervical
cancer cells by targeting phosphatase and tensin homologue. Mol Med
Rep. 2014;10(3):1377–82. doi:10.3892/mmr.2014.2370.
12. Hudson J, Duncavage E, Tamburrino A, Salerno P, Xi L, Raffeld M, et al.
Overexpression of miR-10a and miR-375 and downregulation of YAP1 in
medullary thyroid carcinoma. Exp Mol Pathol. 2013;95(1):62–7.
doi:10.1016/j.yexmp.2013.05.001.
13. Meseguer S, Mudduluru G, Escamilla JM, Allgayer H, Barettino D. MicroRNAs-10a
and -10b contribute to retinoic acid-induced differentiation of neuroblastoma
cells and target the alternative splicing regulatory factor SFRS1 (SF2/ASF). J Biol
Chem. 2011;286(6):4150–64. doi:10.1074/jbc.M110.167817.
14. Foley NH, Bray I, Watters KM, Das S, Bryan K, Bernas T, et al. MicroRNAs 10a
and 10b are potent inducers of neuroblastoma cell differentiation through
targeting of nuclear receptor corepressor 2. Cell Death Differ.
2011;18(7):1089–98. doi:10.1038/cdd.2010.172.
15. Hoppe R, Achinger-Kawecka J, Winter S, Fritz P, Lo W-Y, Schroth W, et al.
Increased expression of miR-126 and miR-10a predict prolonged relapse-free
time of primary oestrogen receptor-positive breast cancer following tamoxifen
treatment. Eur J Cancer. 2013;(0). />16. Chang CH, Fan TC, Yu JC, Liao GS, Lin YC, Shih A, et al. The prognostic
significance of RUNX2 and miR-10a/10b and their inter-relationship in breast
cancer. J Transl Med. 2014;12(1):257. doi:10.1186/s12967-014-0257-3.
17. Perez-Rivas LG, Jerez JM, Carmona R, de Luque V, Vicioso L, Claros MG, et al.
A microRNA signature associated with early recurrence in breast cancer.
PloS One. 2014;9(3). doi:ARTN e91884. doi:10.1371/journal.pone.0091884.
18. Pogribny IP, Filkowski JN, Tryndyak VP, Golubov A, Shpyleva SI, Kovalchuk O.
Alterations of microRNAs and their targets are associated with acquired
resistance of MCF-7 breast cancer cells to cisplatin. Int J Cancer.
2010;127(8):1785–94. doi:10.1002/ijc.25191.
19. Hong WK, Lippman SM, Itri LM, Karp DD, Lee JS, Byers RM, et al. Prevention
of second primary tumors with isotretinoin in squamous-cell carcinoma of
the head and neck. N Engl J Med. 1990;323(12):795–801. doi:10.1056/
NEJM199009203231205.
20. Kakizuka A, Miller WH, Umesono K, Warrell RP, Frankel SR, Murty VVVS, et al.
Chromosomal translocation T(15–17) in human acute promyelocytic
leukemia fuses Rar-Alpha with a novel putative transcription factor, Pml. Cell.
1991;66(4):663–74. doi:10.1016/0092-8674(91)90112-C.
Page 8 of 8
21. Lippman SM, Benner SE, Hong WK. Retinoid chemoprevention studies in upper
aerodigestive tract and lung carcinogenesis. Cancer Res. 1994;54(7):S2025–8.
22. Alizadeh F, Bolhassani A, Khavari A, Bathaie SZ, Naji T, Bidgoli SA. Retinoids
and their biological effects against cancer. Int Immunopharmacol.
2014;18(1):43–9. doi:10.1016/j.intimp.2013.10.027.
23. Theodosiou M, Laudet V, Schubert M. From carrot to clinic: an overview of
the retinoic acid signaling pathway. Cell Mol Life Sci. 2010;67(9):1423–45.
doi:10.1007/s00018-010-0268-z.
24. Prakash P, Russell RM, Krinsky NI. In vitro inhibition of proliferation of
estrogen-dependent and estrogen-independent human breast cancer cells
treated with carotenoids or retinoids. J Nutr. 2001;131(5):1574–80.
25. Rubin M, Fenig E, Rosenauer A, Menendez-Botet C, Achkar C, Bentel JM, et al.
9-Cis retinoic acid inhibits growth of breast cancer cells and down-regulates
estrogen receptor RNA and protein. Cancer Res. 1994;54(24):6549–56.
26. Toma S, Isnardi L, Raffo P, Riccardi L, Dastoli G, Apfel C, et al. RARalpha
antagonist Ro 41–5253 inhibits proliferation and induces apoptosis in
breast-cancer cell lines. Int J Cancer. 1998;78(1):86–94.
27. Ryan J, Curran CE, Hennessy E, Newell J, Morris JC, Kerin MJ, et al. The
sodium iodide symporter (NIS) and potential regulators in normal, benign
and malignant human breast tissue. PLoS One. 2011;6(1):e16023.
doi:10.1371/journal.pone.0016023.
28. Widschwendter M, Berger J, Daxenbichler G, Muller-Holzner E, Widschwendter
A, Mayr A, et al. Loss of retinoic acid receptor beta expression in breast cancer
and morphologically normal adjacent tissue but not in the normal breast
tissue distant from the cancer. Cancer Res. 1997;57(19):4158–61.
29. Wu Q, Dawson MI, Zheng Y, Hobbs PD, Agadir A, Jong L, et al. Inhibition of
trans-retinoic acid-resistant human breast cancer cell growth by retinoid X
receptor-selective retinoids. Mol Cell Biol. 1997;17(11):6598–608.
30. Yang QF, Sakurai T, Kakudo K. Retinoid, retinoic acid receptor beta and
breast cancer. Breast Cancer Res Treat. 2002;76(2):167–73. doi:10.1023/
A:1020576606004.
31. Silva J, Domínguez G, González-Sancho J, García J, Silva J, García-Andrade C,
et al. Expression of thyroid hormone receptor/erbA genes is altered in
human breast cancer. Oncogene. 2002;21(27):4307–16.
32. Lee S, Privalsky ML. Heterodimers of retinoic acid receptors and thyroid
hormone receptors display unique combinatorial regulatory properties.
Mol Endocrinol. 2005;19(4):863–78. doi:10.1210/me.2004-0210.
33. Barton KN, Stricker H, Brown SL, Elshaikh M, Aref I, Lu M, et al. Phase I study
of noninvasive imaging of adenovirus-mediated gene expression in the
human prostate. Mol Ther. 2008;16(10):1761–9. doi:10.1038/mt.2008.172.
34. Takahashi H, Kanno T, Nakayamada S, Hirahara K, Sciume G, Muljo SA, et al.
TGF-beta and retinoic acid induce the microRNA miR-10a, which targets
Bcl-6 and constrains the plasticity of helper T cells. Nat Immunol.
2012;13(6):587–95. doi:10.1038/ni.2286.
35. Weiss FU, Marques IJ, Woltering JM, Vlecken DH, Aghdassi A, Partecke LI, et al.
Retinoic acid receptor antagonists inhibit miR-10a expression and block
metastatic behavior of pancreatic cancer. Gastroenterology.
2009;137(6):2136–45. e1-7. doi:10.1053/j.gastro.2009.08.065.
36. Huang H, Xie C, Sun X, Ritchie RP, Zhang J, Chen YE. miR-10a contributes to
retinoid acid-induced smooth muscle cell differentiation. J Biol Chem.
2010;285(13):9383–9. doi:10.1074/jbc.M109.095612.
37. Livak KJ, Schmittgen TD. Analysis of relative gene expression data using
real-time quantitative PCR and the 2(−Delta Delta C(T)) Method. Methods.
2001;25(4):402–8. doi:10.1006/meth.2001.1262 S1046-2023(01)91262-9.
38. McNeill RE, Miller N, Kerin MJ. Evaluation and validation of candidate
endogenous control genes for real-time quantitative PCR studies of breast
cancer. BMC Mol Biol. 2007;8:107. doi:10.1186/1471-2199-8-107.
39. Davoren PA, McNeill RE, Lowery AJ, Kerin MJ, Miller N. Identification of
suitable endogenous control genes for microRNA gene expression analysis in
human breast cancer. BMC Mol Biol. 2008;9:76. doi:10.1186/1471-2199-9-76.
40. Stadthagen G, Tehler D, Hoyland-Kroghsbo NM, Wen J, Krogh A, Jensen KT, et al.
Loss of miR-10a activates lpo and collaborates with activated Wnt signaling in
inducing intestinal neoplasia in female mice. PLoS Genet. 2013;9(10):e1003913.
doi:10.1371/journal.pgen.1003913.