Variable expression levels of keratin and vimentin reveal differential EMT status of circulating tumor cells and correlation with clinical characteristics and outcome of patients with
Bạn đang xem bản rút gọn của tài liệu. Xem và tải ngay bản đầy đủ của tài liệu tại đây (1005.26 KB, 10 trang )
Polioudaki et al. BMC Cancer (2015) 15:399
DOI 10.1186/s12885-015-1386-7
RESEARCH ARTICLE
Open Access
Variable expression levels of keratin and vimentin
reveal differential EMT status of circulating tumor
cells and correlation with clinical characteristics
and outcome of patients with metastatic breast
cancer
Hara Polioudaki1, Sofia Agelaki2,3, Rena Chiotaki1, Eleni Politaki2, Dimitris Mavroudis2,3, Alexios Matikas3,
Vassilis Georgoulias2,3 and Panayiotis A Theodoropoulos1*
Abstract
Background: CTCs expressing variable levels of epithelial and mesenchymal markers in breast cancer have
previously been reported. However, no information exists for keratin expression levels of CTCs in association with
disease status, whereas assays for the characterization of transitional EMT phenotypes of CTCs in breast cancer are
rather lacking. We investigated the correlation between keratin expression of CTCs and patients’ outcome and
characterized the EMT status of CTCs via the establishment of a numerical “ratio” value of keratin and vimentin
expression levels on a single cell basis.
Methods: Keratin expression was evaluated in 1262 CTCs from 61 CTC-positive patients with metastatic breast
cancer, using analysis of images obtained through the CellSearch System. For the determination of vimentin/keratin
(vim/K) ratios, expression levels of keratin and vimentin were measured in cytospin preparations of luminal (MCF-7
and T47D) and basal (MDA.MB231 and Hs578T) breast cancer cell lines and 110 CTCs from 5 CTC-positive patients
using triple immunofluorescence laser scanning microscopy and image analysis.
Results: MCF-7 and T47D displayed lower vim/K ratios compared to MDA.MB231 and Hs578T cells, while MCF-7
cells that had experimentally undergone EMT were characterized by varying intermediate vim/K ratios. CTCs were
consisted of an heterogeneous population presenting variable vim/K values with 46% of them being in the range
of luminal breast cancer cell lines. Keratin expression levels of CTCs detected by the CellSearch System correlated
with triple negative (p = 0.039) and ER-negative (p = 0.025) breast cancer, and overall survival (p = 0.038).
Conclusions: Keratin expression levels of CTCs correlate with tumor characteristics and clinical outcome. Moreover,
CTCs display significant heterogeneity in terms of the degree of EMT phenotype that probably reflects differential
invasive potential. The assessment of the vim/K ratios as a surrogate marker for the EMT status of CTCs merits
further investigation as a prognostic tool in breast cancer.
Keywords: Circulating tumor cells, EMT, Breast cancer, Keratin expression levels, Fluorescence levels of cell markers,
Vimentin/keratin ratio
* Correspondence:
1
Department of Biochemistry, School of Medicine, University of Crete,
Heraklion, Greece
Full list of author information is available at the end of the article
© 2015 Polioudaki et al.; licensee BioMed Central. This is an Open Access article distributed under the terms of the Creative
Commons Attribution License ( which permits unrestricted use, distribution, and
reproduction in any medium, provided the original work is properly credited. The Creative Commons Public Domain
Dedication waiver ( applies to the data made available in this article,
unless otherwise stated.
Polioudaki et al. BMC Cancer (2015) 15:399
Background
CTCs are typically identified based on the expression of
epithelial markers such as keratins, EpCAM (Epithelial
Cell Adhesion Marker) and the absence of the common
leukocyte marker CD45. Keratins are differentially
expressed among different breast cancer cell lines and are
down-regulated during metastatic spread and progression
in breast cancer [1]. Moreover, it has been suggested that
modulation of keratins due to Epithelial-to-Mesenchymal
Transition (EMT) occurs frequently in CTCs of breast
cancer patients and may be associated with an unfavorable
outcome [1].
EMT is a process that generates invasive cells with the
ability to enter the blood stream ([2] and references
therein). It has been suggested that CTCs undergo EMT
in order to migrate to distant organs [3-5]. During EMT,
epithelial cells display decreased expression of epithelial
markers (loss of epithelial keratins, including 8, 18 and
19, and downregulation of E-cadherin, occludins, claudins and desmoplakin) and acquire mesenchymal traits
(up-regulation of vimentin, N-cadherin, fibronectin,
alpha-smooth muscle actin). Vimentin filaments support
the extension of tubulin-based microtentacles, which are
promoted by EMT and enhance endothelial engagement
[6,7]. Human cancer cells induced to undergo EMT have
been shown to exhibit stem cell–like properties and increased metastatic potential [8].
Genome wide transcriptional analysis of human
breast cancer cell lines has revealed a subgroup of cells
with increased expression of EMT markers and high invasive potential, termed basal B/mesenchymal. These
cells display a “mesenchymal” gene expression profile
in contrast to a second subcategory, the luminal breast
cancer cells, which exhibit poor invasive capability, low
expression of EMT markers and bear an “epithelial”
gene expression profile. Basal A breast cancer cells
represent a third group with intermediate basal/luminal
characteristics [9].
Using RT-PCR, Aktas et al. [3] reported that 62% of
CTCs were positive for at least one EMT marker,
whereas CTCs isolated by CELLection™Dynabeads
coated with the monoclonal antibody toward EpCAM
were negative for both keratins and CD45 [4], but positive for vimentin and fibronectin in 34% of patients with
breast cancer. Although the expression of mesenchymal
markers indicates that a cell may undergo EMT, it does
not really determine the extent to which epithelial cells
are engaged in the EMT process.
In a recent study, using a quantifiable, dual-colorimetric
RNA–in situ hybridization assay for epithelial and mesenchymal transcripts, Yu et al. [5] defined five categories of
CTCs ranging from exclusively epithelial (E) to intermediate (E > M, E = M, M > E) and exclusively mesenchymal
(M). Forty-one percent of patients with metastatic breast
Page 2 of 10
cancer were scored positive for CTCs with EMT features;
CTCs from patients with lobular type cancers (typically
ER+/PR+) were predominantly epithelial, whereas those
from the TN (Triple Negative) were predominantly
mesenchymal.
In this study, we propose a new approach for the designation of EMT status of CTCs, based on the quantification of fluorescence intensity of keratin and vimentin
on a single cell basis and the generation of a numerical
‘ratio’ value corresponding to their relative expression.
“Epithelial” (MCF-7, T47D) and “mesenchymal” (Hs578T,
MDA.MB231) breast cancer cell lines and “epithelial”
(MCF-7) cells during experimentally induced EMT were
employed as controls for the standardization of EMT ratio
range. Furthermore, we present data that reveal a correlation between keratin expression levels of CTCs and
patients’ clinical characteristics and disease outcome.
Methods
Cell lines and treatments
Culture conditions
MCF-7 (mammary adenocarcinoma), T47D (ductal
breast epithelial tumor), MDA.MB231 and Hs578T (human breast carcinoma) cell lines were obtained from
American Type Tissue Culture Collection (Manassas,
VA). MCF-7 cells were cultured in Dulbecco’s modified
Eagle’s medium (DMEM) plus 0.2 U/ml insulin, T47D in
RPMI 1640 medium plus 0.2 U/ml insulin, MDA.MB231
and Hs578T in DMEM medium at 37°C in a humidified
atmosphere containing 5% CO2.
Culture media were purchased from Biochrom (Berlin,
Germany) and were supplemented with 10% heatinactivated fetal bovine serum, penicillin and streptomycin.
EGF treatment
For the induction of Epithelial-to-Mesenchymal Transition, MCF-7 cells were treated with 100 ng/ml Epidermal
Growth Factor (EGF) in low serum (0.1% FBS) DMEM
with 1% penicillin/streptomycin, as described [10].
Cytospin preparation of cultured cells
Cells were harvested by trypsinization, washed with PBS
and aliquots of 500000 cells were centrifuged at
2000 rpm for 2 min on glass slides. Cytospins were dried
and stored at −80°C before use.
Confocal microscopy
Patients and cytospin preparation
Peripheral blood (10 mL in EDTA) was obtained from a
separate group of 20 metastatic breast cancer patients
on progression before the initiation of a new line of
treatment. Blood was collected by vein puncture after
disposal of the first 5 mL in order to avoid contamination with epithelial cells from the patient skin during
Polioudaki et al. BMC Cancer (2015) 15:399
sample collection. Peripheral blood mononuclear cells
(PBMC) were isolated after Ficoll-Hypaque (Sigma Life
Science 10771) density gradient (d = 1.077 g/ml) centrifugation at 1800 rpm for 30 min, washed three times with
PBS and centrifuged at 1500 rpm for 10 min. Aliquots of
500000 cells were centrifuged at 2000 rpm for 2 min on
glass slides. Cytospins were dried and stored at −80°C for
further use. All patients gave their written informed consent for their participation in this study, which has been
approved by the Ethics and Scientific Committees of the
University Hospital of Heraklion, Crete, Greece.
Immunofluorescence staining
A combination of direct and indirect immunofluorescence
was used as previously described [11]. Cytospins were fixed
with 4% formaldehyde in phosphate buffered saline (PBS)
for 5 minutes at room temperature and permeabilized with
Triton X-100. Fixed cells were incubated in blocking buffer
(PBS, pH 7.4, 0.5% Triton X-100 and 1% fish skin gelatin)
and stained indirectly with primary and then with secondary antibodies and directly with labelled primary
antibodies. Primary antibodies for vimentin (Santa Cruz
Biotechnology, sc-7558), CD45 [DakoCytomation, M
0701 (mouse) or Santa Cruz Biotechnology, sc-25590
(rabbit)], E-cadherin (BD Transduction Laboratories,
612130), fibronectin (BD Transduction Laboratories,
610077) and EpCAM (Acris Antibody AM10033 PU-N)
and the corresponding anti-mouse and anti-rabbit
secondary antibodies labeled with Alexa 488 (green
staining, Invitrogen), Alexa 633 (blue staining, Invitrogen)
and CF555 (red staining, Biotium) dyes were used.
In all experiments, we utilized anti-keratin 8/18/19
mouse monoclonal antibodies, A45-B/B3 (R002A, Micromet AG, Munich, Germany), used for CTCs analysis using
CellSearch, A45-B/B3 antibodies were conjugated to Zenon
488 (green staining, Z25002, Molecular Probes), diluted
1/30 in blocking buffer without Triton X-100. Labelling
of A45-B/B3 with Zenon 488 was performed following
the instructions of the supplier.
The titration for optimal activities and the specificity of
each antibody was evaluated using the different cell lines
spiked in PBMCs from healthy patients. Specifically, we
used the MCF-7 and T47D cell lines for the evaluation of
anti-keratin, anti- E-cadherin and anti-EpCAM antibodies
and the MDA.MB231 and Hs578T cell lines for the antivimentin and anti-fibronectin antibodies. In each separate
immunofluorescence experiment, positive samples for epithelial and mesenchymal markers and negative controls
prepared by omitting the respective primary antibody, to
exclude non-specific binding, were included.
Identification of CTCs
All cytospin preparations of PBMCs were first examined
under a conventional epifluorescence microscope (Leica)
Page 3 of 10
using 40 x objective lens with oil immersion and were further analyzed by confocal (Leica SP) microscopy. Keratins
were labeled with anti-keratin 8/18/19 mouse monoclonal
antibodies conjugated to Zenon 488 (green staining),
vimentin was identified with anti-vimentin rabbit polyclonal antibodies and subsequently with secondary antibodies conjugated with CF 555 (red staining) and finally
CD45 was labeled with mouse monoclonal antibodies
followed by incubation with secondary antibodies conjugated with Alexa 633 (blue staining). To prevent any signal
interference (green, red and blue) generated by the different emission spectra, the detection of each one of the
markers was performed by sequential laser confocal scan.
Fixed confocal settings were used for all specific measurements. Images were taken from all CTCs detected (DAPI
positive and CD45 negative cells) and were stored electronically. As positive controls, cytospins of MCF-7 cells
(keratin positive) or Hs578T cells (vimentin positive)
spiked into normal donor PBMCs (CD45 and vimentin
positive) were included in each separate experiment.
Analysis of CD45 and keratin expression in CTCs and
PBMCs revealed a highly significant difference between
the 2 populations (Additional file 1).
CellSearch analysis
Patients
Sixty-one patients with metastatic breast cancer with ≥2
CTCs per 7.5 ml of blood detected by the use of CellSearch were included in the current analysis. Patients
were treated from 9/2007 to 10/2012 for metastatic
breast cancer within prospective clinical trials organized
by HORG (Hellenic Oncology Research Group) and had
been assessed for the presence of CTCs before the initiation of first-line chemotherapy. The CellSearch Circulating
Tumor Cell Kit (Veridex Warren, NJ) was used for CTC
detection as previously described [12,13]. Patient data
were prospectively obtained and retrospectively analyzed.
All patients gave their written informed consent for their
participation in the study, which has been approved by
the Ethics and Scientific Committees of the University
Hospital of Heraklion, Crete, Greece.
Breast cancer cell lines
For the calibration of keratin expression on CTCs,
MCF-7 cells were spiked into 7.5 ml of peripheral blood
obtained from healthy donors and were processed by the
CellSearch System using the same protocol employed for
patient samples [12,13].
Image analysis
To quantify the fluorescence intensity of the markers of
interest, images obtained from CellSearch or confocal
microscopy were subjected to java-based image processing with the use of ImageJ program (NIH). CellSearch
Polioudaki et al. BMC Cancer (2015) 15:399
Page 4 of 10
images from all CTCs detected in patient samples and
representative images of 100 cells from MCF-7 cells
were analyzed. Accordingly, images of all CTCs identified on patient cytospins and representative images of
100 cells from each MCF-7, T47D, MDA.231 and
Hs578T cell lines obtained by confocal microscopy were
also assessed by ImageJ. Fluorescence intensity was
expressed as Corrected Total Cell Fluorescence (CTCF).
Statistical analyses
T-test was used to compare 2 continuous variables.
Pearson correlation and linear regression were used to
assess correlation between continuous variables. One
way ANOVA nonparametric test (Kruskal-Wallis) with
Dunn’s post test was used to compare cell lines and
CTCs. Overall survival (OS) was calculated from treatment initiation to death from tumor progression or
death from any cause.
To examine the potential association of keratin expression on CTCs with patient outcome, the median keratin
intensity on CTCs was determined using the values
obtained from all CTCs detected by the use of the CellSearch System. Each individual CTC was classified as
“high” or “low” according to the median keratin value;
the keratin levels on CTCs were correlated with tumor
characteristics. Patients with more than 50% of CTCs
being “high” were characterized as “high keratin, HK”,
whereas those with more than 50% of CTCs below the
median value were designated as “low keratin, LK”. The
two groups (HK and LK) were compared in terms of
patient characteristics and overall survival.
All analyses were performed using the SPSS20 program.
Results
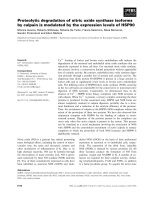
Figure 1 Linearity of the measured fluorescence intensity. (A) Corrected
total fluorescence from fluorescent beads of different (100%, 33%,
10% and 3%) nominal fluorescence intensity was measured in
different PMT settings (450, 500, 550 and 600 volts) and analyzed
using ImageJ. Linear regression and R-square are shown for each
PMT setting. (B) Box plot presenting the mean values (minimum
to maximum) of keratin expression in different breast cancer cell
lines. Fluorescence was measured in 550 volts and a total of 100
cells were evaluated for each cell line.
Immunofluorescence assay: intensity calibration and
linearity of the detection system
In order to establish an assay which would allow the effective measurement of fluorescence of epithelial and
mesenchymal markers, we first determined the confocal
settings in the range of which linearity of fluorescent
measurements is maintained. For this purpose, we utilized beads of different fluorescence intensities (Focal
Check Fluorescence Microscope Test Slide 1, F36909,
Invitrogen), and captured a series of images at different
laser settings. Fluorescence intensity was calculated with
the use of ImageJ. Figure 1A shows the relative intensity
curves obtained in different Photomultiplier (PMT) settings. Fluorescence intensity was practically linear up to
550 volts, indicating an effective and proportional measurement efficiency of both low and high intensity pixels
under these adjustments. In order to assess whether the
fluorescence intensity of pixels in cells under examination
is included into the fluorescent limits of our standard
curves, we analyzed the keratin expression in “epithelial”
and “mesenchymal” breast cancer cell lines by measuring the mean intensity of the fluorescently labeled area
of the cells (CTCF/area). Using cytospin preparations
of MCF-7, T47D, MDA.MB231 and Hs578T cells, we
found that the fluorescence values of all cells examined
are distributed within the limits of the standard curve
demonstrating that under these conditions low, moderate
and high expression levels of keratin can be evaluated and
compared (Figure 1B).
Expression levels of epithelial and mesenchymal markers
in breast cancer cell lines
The specificity of the antibodies used in our study and
the pattern of epithelial and mesenchymal markers in
breast cancer cell lines are presented in Figure 2, while
the range and mean values calculated for epithelial (keratins, EpCAM) and mesenchymal (vimentin, fibronectin)
Polioudaki et al. BMC Cancer (2015) 15:399
Page 5 of 10
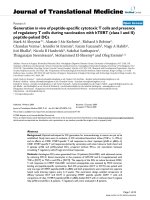
Figure 2 Expression patterns of epithelial and mesenchymal markers in breast cancer cell lines and PBMCs. Characteristic images of “epithelial”
(MCF-7, T47D), “mesenchymal” (MDA.MB231, Hs578T) cells and PBMCs stained for epithelial (K, EpCAM and E-cadherin) markers (green) mesenchymal
(vimentin and fibronectin) markers (red) and the leukocyte marker CD45 (blue).
markers in these cell lines are shown in Table 1 and
Additional file 2. The calculated mean values demonstrate an upregulation of vimentin and fibronectin expression and downregulation of keratins and EpCAM in
invasive cell lines (MDA.MB231, Hs578T), while poorly
invasive cell lines (MCF-7, T47D) display the opposite
profile. When the expression values were presented as a
vimentin to keratin ratio, which we introduce as an
EMT index, it was shown that the “epithelial” MCF-7
and T47D cell lines are characterized by low vim/K ratios (0.19 ± 0.05 for MCF-7 and 0.20 ± 0.07 for T47D
cells), while “mesenchymal” MDA.MB231 and Hs578T
cells display high vim/K (4.44 ± 1.98 and 13.14 ± 5.08, respectively) ratios (Table 1 and Figure 3). To further support the suggested correlation of a high vim/K ratio with
a mesenchymal-like cell state, we examined the respective
ratios in MCF-7 cells undergoing EMT. When MCF-7
cells were treated with EGF, most cells were characterized
by variable vim/K ratios ranging from 0.45 to 5.05 with a
mean value of 1.57 ± 1.02 (Table 1). Representative images
are presented in Figure 3. In addition, we calculated the
vimentin/EpCAM and fibronectin/K ratios in all cell lines
examined. As shown in Additional file 2, the respective
ratios displayed differences according to the ‘epithelial’
Table 1 Expression levels of epithelial and mesenchymal
markers in breast cancer cell lines and CTCs
Keratin
MCF-7
T47D
MDA.MB231
Hs578T
MCF-7 EGF
CTCs
vimentin
vim/K
Range
25.08 -131.69
9.01 – 24.75
0.12 - 0.49
Mean
87.34 ± 18.99
15.68 ± 2.58
0.19 ± 0.05
Range
15.49 -80.36
2.80 -16.27
0.17 – 0.43
Mean
35.43 ± 10.62
6.73 ± 2.16
0.19 ± 0.07
Range
4.22 -39.12
13.77 – 72.70
1.19 – 10.88
Mean
11.47 ± 4.87
43.38 ± 12.06
4.44 ± 1.98
Range
1.73-7.40
12.30 -153.80
5.47 – 38.88
Mean
4.02 ± 1.00
53.64 ± 24.81
13.14 ± 5.08
Range
7.59 – 43.06
11.79 – 52.23
0.45 – 5.05
Mean
18.37 ± 7.56
23.63 ± 9.10
1.57 ± 1.02
Range
1.49 – 213.19
0.00 - 155.24
0.00 – 22.46
Mean
30.06 ± 25.00
26.42 ± 25.45
1.62 ± 3.96
The range and mean values (± SD) were calculated by measuring the
fluorescence intensity (CTCF/area) of each marker. For the calculation of vim/K
ratios, data were obtained from double staining (Keratin and vimentin)
immunofluorescence experiment.
Polioudaki et al. BMC Cancer (2015) 15:399
Page 6 of 10
Figure 3 EMT status of breast cancer cell lines and CTCs. Cytospin preparations of cells stained for vimentin and K are placed along an axis with
increasing vimentin/K (vim/K) ratios and EMT status. In the upper part of the figure are shown representative images of MCF-7, MDA.MB231 and
Hs578T cells double stained for vimentin and K and a merge image of EGF treated MCF-7 cells stained for K (green), vimentin (red) and Topro
(blue). Numbers shown below the images indicate the mean values of vim/K ratios calculated for each cell line. Numbers next to individual MCF-7 cells
undergoing EMT are vim/K values measured for the indicated cells. Characteristic images from CTCs with different vim/K ratios and CD45 staining are
presented in the lower part of the figure. Note the absence of CD45 staining in all CTCs and the presence of CD45 positive PBMCs (asterisks). Numbers
shown inside the images, indicate the relative fluorescence intensity measured for each demonstrated marker, whereas numbers outside the images
represent the vim/K ratios of the CTCs show.
and ‘mesenchymal’ status of the cell lines with epithelial
cell lines expressing lower ratios compared to the mesenchymal ones. Since K is broadly used for the identification
of CTCs (by the use of immunofluorescence or the CellSearch System) whereas the wide range of the vim/K
scale promoted a finer categorization of EMT in breast
cancer cells, the generation of the EMT scale for the
categorization of CTCs was based on the vim/K ratio.
Expression levels of epithelial and mesenchymal markers
in CTCs
Twenty metastatic breast cancer patients evaluated before
the initiation of a new line of treatment were screened for
the presence of CTCs. A total of 110 CTCs detected in 5
patients with more than 2 CTCs per 106 PBMCs were analyzed to determine the relative expression levels of keratin
and vimentin. CTCs presented a significant heterogeneity
in ratio values, ranging from 0.0 (cells without vimentin
expression) to 22.46 (cells with almost exclusive vimentin
expression). The mean value was 1.62 ± 3.96, compared to
0.12 ± 0.49 calculated for the “epithelial” MCF-7 cell line
and 13.14 ± 5.08 for the “mesenchymal” Hs578Tcell line
(Table 1 and Figure 3).
To define the epithelial or mesenchymal status of
CTCs, the range of vim/K values calculated for MCF-7
and Hs578T cells, respectively, were used as cut-offs.
Specifically, CTCs exhibiting ratios up to 0.49, representing
the highest value of the ratio for MCF-7 cells, were characterized as “epithelial”, whereas values from 5.47 to 38.88,
that correspond to the range calculated for Hs578T cells,
defined “mesenchymal” CTCs. CTCs with values ranging
from 0.49 – 5.46 were characterized as “intermediate”
EMT undergoing cells. According to these cut-offs, 46% of
CTCs could be classified as “epithelial” (with vim/K ratios
ranging from 0.00-0.48), 5.4% (vim/K ratios ranging from
12.82-22.46) as “mesenchymal” and 48.2% of CTCs showing ratios between 0.57 and 3.35 as “intermediate” EMT
undergoing CTCs. Moreover, 30% of all cells evaluated,
exhibited lower keratin levels compared to “epithelial”
luminal type breast cancer cell lines.
Furthermore, a significant inter- and intra-patient heterogeneity was evident regarding the EMT status of
CTCs. The number of CTCs/106 PBMCs detected in
each patient as well as their distribution in “epithelial”,
“intermediate” and “mesenchymal” phenotypes are included in [Additional file 3].
Keratin levels of CTCs analyzed using the CellSearch
platform and their association with tumor characteristics
and clinical outcome of metastatic breast cancer patients
We sought to examine the significance of protein expression levels in CTCs detected by an approved method
Polioudaki et al. BMC Cancer (2015) 15:399
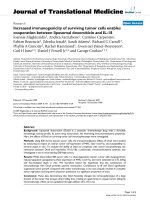
such as the CellSearch platform. To establish the methodology, we initially spiked MCF-7 cells into blood obtained
from healthy blood donors and assessed keratin levels on
images obtained using the CellSearch platform (Figure 4A)
and by immunofluorescence analysis of cell cytospins. A
strong correlation (R2 = 0.97) in the expression levels of
keratin assessed by the use of the two approaches was evident (Additional file 4). Subsequently, we retrospectively
measured keratin levels in 1262 CTCs identified in 61
patients with metastatic disease who had been evaluated
before the initiation of first-line chemotherapy. Patient
characteristics are listed in Table 2. Thirty-four (55.7%)
patients were classified into the HK and 27 (44.3%) into
the LK group according to the keratin expression levels on
CTCs. A correlation was found between keratin levels and
primary tumor characteristics. Low keratin levels were
associated with triple negative status. Specifically, the
mean keratin expression levels on CTCs detected in triple
negative patients was 122.4 ± 99.98 compared to 175.0 ±
128.0 in the remaining patients (p < 0.0001, equal variance
between the two groups, p = 0.056). Moreover, 72.7% of
triple negative patients and 65% of ER-negative patients
were classified as LK (Pearson correlation, p = 0.039 and
p = 0.025, respectively). No difference in objective response
to chemotherapy was evident according to keratin expression levels. A correlation was found for OS; 1-year OS was
73.3% and 46.2%, for patients in the HK and LK groups,
respectively (Pearson correlation, p = 0.038).
Discussion
In the current study, we present data suggesting that
keratin expression levels of EpCAM positive CTCs have
Page 7 of 10
Table 2 Patients characteristics
No of patients
61
No of CTCs
1262
Age
Median (range)
62 (23–82)
N (%)
Menopausal status
Pre
17 (27.9)
Post
41 (67.2)
UN
3 (4.9)
ER
Positive
38 (62.3)
Negative
20 (32.8)
UN
3 (4.9)
PR
Positive
30 (49.2)
Negative
28 (45.9)
UN
3 (4.9)
HER 2
Positive
14 (22.9)
Negative
44 (72.1)
UN
3 (4.9)
Triple negative
11 (18.0)
Histology grade
1
1 (1.6)
2
16 (26.2)
3
26 (42.6)
UN
18 (29.5)
No of CTCs/patients
Figure 4 Expression levels of keratins in MCF-7 cells and CTCs analyzed
using the CellSearch platform. Representative images and the
corresponding CTCF values of MCF-7 cells spiked into blood from
healthy donors (A) and CTCs (B).
Median (range)
2- 162
2-4
21 (34.4)
≥5
40 (65.6)
potential clinical relevance and we propose a quantitative assay for the evaluation of the EMT status of CTCs,
based on a mesenchymal to epithelial ratio calculated
from the expression levels of vimentin and keratin measured on a single cell basis.
Differential gene expression levels of distinct keratins
have been demonstrated among basal and luminal type
breast cancer cell lines [1]. Thus, keratins 8 and 19 were
significantly under-expressed in basal-like B as compared to basal-like A and luminal cell lines whereas,
keratin 18 had significantly lower gene expression levels
in all basal-like compared to luminal cell lines [1]. To
our knowledge, our report is the first presenting data on
protein expression levels in breast cancer cell lines and
individual CTCs. In accordance to the report by Joosse
et al. [1], keratin expression was higher in the luminal
Polioudaki et al. BMC Cancer (2015) 15:399
breast cancer cell lines MCF-7 and T47D compared to
the basal-like B, MDA.MB231 and Hs578T cells. Interestingly, a subpopulation of CTCs, corresponding to
30% of all cells evaluated, exhibited lower keratin levels
compared to “epithelial” luminal type breast cancer cell
lines.
Using MCF-7 cells stimulated with EGF to induce
EMT, we showed that keratin expression decreases
under treatment. Moreover, the EMT status has been
previously correlated with decreased levels of epithelial
markers [14]. Accordingly, low keratin expression on
CTCs could characterize CTCs undergoing EMT which
theoretically are empowered with increased metastatic
potential.
To have an insight into whether keratin expression, a
potential surrogate marker for the EMT process, evaluated by a standardized and broadly available method
such as CellSearch, could be related to clinical characteristics and patient outcome we retrospectively assessed
expression levels on CTCs identified in a cohort of patients with metastatic breast cancer undergoing first-line
chemotherapy. We demonstrated that low protein levels
of keratins 8, 18 and 19 in EpCAM positive CTCs were
associated with shorter OS. Low expression of keratins
was also associated with triple negative histology indicating that low levels could predict for a more aggressive
course of breast cancer [12,15,16]. Similarly, high mRNA
expression of keratin 16 in metastatic breast cancer was
associated with a shorter relapse-free survival when
compared with patients with keratin 16 low expressing
tumors [1]. Interestingly, keratin 16 upregulation is also
a common phenomenon in basal-like breast cancer cell
lines [1]. Data from both the study of Joosse et al. [1]
and ours, although generated through different approaches, suggest that keratin levels do matter since they
are associated with patient characteristics and clinical
outcome. They also suggest that a potential surrogate
marker for the EMT status of CTCs has clinical implications in metastatic disease.
The exclusion of EpCAM negative CTCs from CellSearch analysis remains a default setback of the CellSearch
isolation methodology and could be compensated either
with the acquisition of the cells that remain in the system
or with the use of an EpCAM-independent isolation
methodology. The study of EpCAM negative CTCs would
be of interest in order to obtain a broader representation
of the EMT grade in CTCs and its correlation with patient
outcome.
We subsequently evaluated the combined relative expression of keratin and the mesenchymal marker vimentin as a
means to refine our method regarding the characterization
of the EMT status of CTCs. The EMT program is a highly
dynamic process that involves a series of transitions and a
spectrum of multiple intermediate states between the two
Page 8 of 10
extremes, the epithelial and the mesenchymal ones [17].
With the exception of a dual-colorimetric RNA–in situ
hybridization assay for epithelial and mesenchymal transcripts defining various categories of the EMT process [5],
no protein marker based quantifiable assays have so far
been proposed for the characterization and evaluation
of the mesenchymal and transitional EMT phenotypes
of CTCs. Here, we established a simple and effective
quantitative analysis of protein markers, utilizing data
obtained through routine immunofluorescence analysis
on CTCs non-selected according to EpCAM expression, thus expanding and complementing a previously
established CTC identification methodology. More importantly, using the expression levels for mesenchymal
(vimentin and fibronectin) and epithelial (keratin and
EpCAM) markers of single cells, we introduced a numerical index for the determination of the EMT extent
of CTCs. Subsequently, we applied expression levels for the
generation of an EMT ‘gradient’ ranging from ‘epithelial’ to
‘mesenchymal’ rather than classifying cells into discrete categories. Since K is broadly used for the identification of
CTCs (by immunofluorescence analysis or CellSearch) it
was chosen for the generation of the EMT scale for the
categorization of CTCs on the vim/K rather than the
vimentin/EpCAM or fibronectin/keratin ratios. With the
use of this index, we characterized each cell individually
and positioned it onto this scale of increasing EMT status
(see Figure 3) with a higher vim/K ratio suggestive of a
stronger EMT phenotype. Interestingly, in agreement with
recent studies [3-5] more than half of all CTCs detected in
metastatic breast cancer patients presented an EMT phenotype of variable degree. Cells presenting differential EMT
ratios, could be accredited with variable invasive capabilities. This is supported by recently reported data showing
that the presence of mesenchymal markers on CTCs of
metastatic breast cancer patients is an indicator of worse
disease prognosis compared to the expression of keratins
alone [18]. Moreover, the detection of a small percentage of
purely mesenchymal CTCs in our study, is in accordance
with previous reports [4,5,19], although an under-estimation
of K positive CTCs could not be excluded because of
the inefficiency of A45-B/B3 antibodies to recognize all
types of keratins expressed in CTCs [1]. These cells
could probably represent a highly invasive population
and their presence further supports the view that CTCs
cannot be effectively evaluated when their isolation and
detection is based on epithelial markers alone.
A limitation of our study is that due to the retrospective
nature of the analysis on CellSearch data, the EMT index
could not be generated and validated. On the other hand,
due to the small number of patients evaluated for the
EMT ratio on CTCs, we cannot comment on the clinical
significance of this approach. However, it represents a
simple, practical and cost-effective methodology, which
Polioudaki et al. BMC Cancer (2015) 15:399
can easily be exported due to the wide use of immunofluorescence analysis for the detection of CTCs and for
which we consider that it merits further evaluation as a
prognostic tool.
Conclusions
Our study highlights the significance of quantifying protein expression for the characterization of CTCs. Data
from CellSearch analysis revealed a correlation between
the keratin levels of CTCs, the tumor characteristics and
outcome of patients with metastatic breast cancer. By
evaluating the relative vimentin and keratin expression
levels of unselected, immunofluorescently labeled CTCs
on cytospins, we generated a numerical index on which
we based the establishment of an EMT hierarchy ‘gradient’
ranging from ‘epithelial’ to ‘mesenchymal’. This approach
could offer significant prognostic information upon diagnosis or during follow up of patients with breast cancer.
Although this method could be easily applied following
detection of CTCs using immunofluorescence, we are
currently developing an automated methodology for
the detection, quantification and analysis of the expression
levels of different protein markers to reflect their heterogeneous biological properties.
Additional files
Additional file 1: Keratin and CD45 expression levels in CTCs and
PBMCs. Description: Column bar graph presenting the mean values (±SD)
of CD45 (panel A) and keratin (panel B) in CTCs and PBMCs. Expression
levels were calculated in all CTCs found (110 cells) and an equal number of
PBMCs by measuring the fluorescence intensity (CTCF/area) of each marker.
T- test statistical analysis was performed among the two populations (for
both panels p < 0001). CD45 expression ranged between 29.49 to 171.5
(±31.87) and between 0.0 to 13.30 (±3.97) for PBMCs and CTCs respectively.
Keratin expression levels ranged from 0.11 to 3.86 (±0.96) and from 3.00 to
155.0 (±27.65) for PBMCs and CTCs respectively.
Additional file 2: Mesenchymal/epithelial ratios in breast cancer
cell lines. Description: The range and mean values (± SD) were
calculated by measuring the fluorescence intensity (CTCF/area) of each
marker. For the calculation of vimentin/EpCAM and fibronectin/K ratios,
data were obtained from double staining (EpCAM and vimentin or K and
fibronectin respectively) immunofluorescence experiment.
Additional file 3: Distribution of various CTC phenotypes in breast
cancer patients. Description: Number (No) of CTCs detected in 106 PBMCs
for each patient and their percent distribution in “epithelial”, “intermediate”,
“mesenchymal” phenotypes according to their vim/K ratios.
Additional file 4: Expression levels of keratin after confocal
microscopy or CellSearch analysis. Description: Scatterplot with a
regression line showing a strong correlation between the keratin
expression levels (CTCF) of MCF-7 cells (85 in total) measured after
analysis with CellSearch or immunofluorescence confocal microscopy.
Abbreviations
CTCs: Circulating tumor cells; EMT: Epithelial-to-Mesenchymal Transition;
OS: Overall survival; K: Keratin; PMT: Photomultiplier; MET: Mesenchymal to
Epithelial Transition; HK: High keratin expression of CTCs; LK: Low keratin
expression of CTCs; vim/K: Vimentin/keratin.
Competing interests
The authors declare that they have no competing interests.
Page 9 of 10
Authors’ contributions
HP: Acquisition and analysis of confocal microscopy data, performing
statistical analyses, revising the manuscript. SA: Analysis and interpretation of
data, design the study, revising the manuscript. RC: Acquisition of confocal
microscopy data, revising the manuscript. EP: Acquisition of CellSearch data,
revising the manuscript. DM: Analysis and interpretation of data, revising the
manuscript. AM: Acquisition of clinical data, revising the manuscript. VG:
Analysis and interpretation of data, revising the manuscript. PAT: Conception
and design of the study, analysis and interpretation of data, drafting and
revising the manuscript. All of the authors read and approved the final
manuscript.
Authors’ information
HP: Postdoctoral researcher, Medical school, University of Crete
SA: Assistant Professor of Oncology, Medical school, University of Crete and
University hospital of Heraklion
RC: Postdoctoral researcher, Medical school, University of Crete. Supported
by “Oncoseed” program
EP: Research assistant, Medical school, University of Crete. Supported by
“Oncoseed” program
DM: Professor of Oncology, Medical school, University of Crete and University
hospital of Heraklion
AM: Resident, Medical Oncology Department, University hospital of Heraklion
VG: Professor of Oncology and director, Medical school, University of Crete
and University hospital of Heraklion
PAT: Associate Professor of Biochemistry, Medical school, University of Crete.
Acknowledgements
We thank S. Apostolaki, G. Kallergi and M. Papadaki for contributing materials
and providing constructive comments on this study. This work was partly
supported by a grant KA3175 (“Oncoseed”) from the Greek General Secretary
of Research and Technology.
Author details
1
Department of Biochemistry, School of Medicine, University of Crete,
Heraklion, Greece. 2Laboratory of Τumor Cell Βiology, School of Medicine,
University of Crete, Heraklion, Greece. 3Department of Medical Oncology,
University General Hospital of Heraklion, Heraklion, Greece.
Received: 4 November 2014 Accepted: 28 April 2015
References
1. Joosse SA, Hannemann J, Spotter J, Bauche A, Andreas A, Muller V, et al.
Changes in keratin expression during metastatic progression of breast
cancer: impact on the detection of circulating tumor cells. Clin Cancer Res.
2012;18(4):993–1003.
2. Kalluri R, Weinberg RA. The basics of epithelial-mesenchymal transition.
J Clin Invest. 2009;119(6):1420–8.
3. Aktas B, Tewes M, Fehm T, Hauch S, Kimmig R, Kasimir-Bauer S. Stem cell
and epithelial-mesenchymal transition markers are frequently overexpressed
in circulating tumor cells of metastatic breast cancer patients. Breast Cancer
Res. 2009;11(4):R46.
4. Raimondi C, Gradilone A, Naso G, Vincenzi B, Petracca A, Nicolazzo C, et al.
Epithelial-mesenchymal transition and stemness features in circulating
tumor cells from breast cancer patients. Breast Cancer Res Treat.
2011;130(2):449–55.
5. Yu M, Bardia A, Wittner BS, Stott SL, Smas ME, Ting DT, et al. Circulating
breast tumor cells exhibit dynamic changes in epithelial and mesenchymal
composition. Science. 2013;339(6119):580–4.
6. Whipple RA, Balzer EM, Cho EH, Matrone MA, Yoon JR, Martin SS. Vimentin
filaments support extension of tubulin-based microtentacles in detached
breast tumor cells. Cancer Res. 2008;68(14):5678–88.
7. Whipple RA, Matrone MA, Cho EH, Balzer EM, Vitolo MI, Yoon JR, et al.
Epithelial-to-mesenchymal transition promotes tubulin detyrosination and
microtentacles that enhance endothelial engagement. Cancer Res.
2010;70(20):8127–37.
8. Mani SA, Guo W, Liao MJ, Eaton EN, Ayyanan A, Zhou AY, et al. The
epithelial-mesenchymal transition generates cells with properties of stem
cells. Cell. 2008;133(4):704–15.
Polioudaki et al. BMC Cancer (2015) 15:399
9.
10.
11.
12.
13.
14.
15.
16.
17.
18.
19.
Page 10 of 10
Blick T, Widodo E, Hugo H, Waltham M, Lenburg ME, Neve RM, et al.
Epithelial mesenchymal transition traits in human breast cancer cell lines.
Clin Exp Metastasis. 2008;25(6):629–42.
Vergara D, Valente CM, Tinelli A, Siciliano C, Lorusso V, Acierno R, et al.
Resveratrol inhibits the epidermal growth factor-induced epithelial mesenchymal
transition in MCF-7 cells. Cancer Lett. 2011;310(1):1–8.
Theodoropoulos PA, Polioudaki H, Agelaki S, Kallergi G, Saridaki Z,
Mavroudis D, et al. Circulating tumor cells with a putative stem cell
phenotype in peripheral blood of patients with breast cancer. Cancer Lett.
2010;288(1):99–106.
Dent R, Trudeau M, Pritchard KI, Hanna WM, Kahn HK, Sawka CA, et al.
Triple-negative breast cancer: clinical features and patterns of recurrence.
Clin Cancer Res. 2007;13(15 Pt 1):4429–34.
Pierga JY, Hajage D, Bachelot T, Delaloge S, Brain E, Campone M, et al. High
independent prognostic and predictive value of circulating tumor cells
compared with serum tumor markers in a large prospective trial in first-line
chemotherapy for metastatic breast cancer patients. Ann Oncol.
2012;23(3):618–24.
Thiery JP. Epithelial-mesenchymal transitions in tumour progression. Nat
Rev. 2002;2(6):442–54.
Sorlie T, Perou CM, Tibshirani R, Aas T, Geisler S, Johnsen H, et al. Gene
expression patterns of breast carcinomas distinguish tumor subclasses with
clinical implications. Proc Natl Acad Sci U S A. 2001;98(19):10869–74.
Dent R, Hanna WM, Trudeau M, Rawlinson E, Sun P, Narod SA. Pattern of
metastatic spread in triple-negative breast cancer. Breast Cancer Res Treat.
2009;115(2):423–8.
Tam WL, Weinberg RA. The epigenetics of epithelial-mesenchymal plasticity
in cancer. Nat Med. 2013;19(11):1438–49.
Gradilone A, Raimondi C, Nicolazzo C, Petracca A, Gandini O, Vincenzi B,
et al. Circulating tumour cells lacking cytokeratin in breast cancer: the
importance of being mesenchymal. J Cell Mol Med. 2011;15(5):1066–70.
Mikolajczyk SD, Millar LS, Tsinberg P, Coutts SM, Zomorrodi M, Pham T, et al.
Detection of EpCAM-Negative and Cytokeratin-Negative Circulating Tumor
Cells in Peripheral Blood. J Oncol. 2011;2011:252361.
Submit your next manuscript to BioMed Central
and take full advantage of:
• Convenient online submission
• Thorough peer review
• No space constraints or color figure charges
• Immediate publication on acceptance
• Inclusion in PubMed, CAS, Scopus and Google Scholar
• Research which is freely available for redistribution
Submit your manuscript at
www.biomedcentral.com/submit