Anticancer activity of a thymidine quinoxaline conjugate is modulated by cytosolic thymidine pathways
Bạn đang xem bản rút gọn của tài liệu. Xem và tải ngay bản đầy đủ của tài liệu tại đây (3.67 MB, 11 trang )
Wei et al. BMC Cancer (2015) 15:159
DOI 10.1186/s12885-015-1149-5
RESEARCH ARTICLE
Open Access
Anticancer activity of a thymidine quinoxaline
conjugate is modulated by cytosolic thymidine
pathways
Qiong Wei1, Haijuan Liu1, Honghao Zhou2, Dejun Zhang1, Zhiwei Zhang2 and Qibing Zhou1,3*
Abstract
Background: High levels of thymidine kinase 1 (TK1) and thymidine phosphorylase (TYMP) are key molecular targets
by thymidine therapeutics in cancer treatment. The dual roles of TYMP as a tumor growth factor and a key activation
enzyme of anticancer metabolites resulted in a mixed outcome in cancer patients. In this study, we investigated the
roles of TK1 and TYMP on a thymidine quinoxaline conjugate to evaluate an alternative to circumvent the contradictive
role of TYMP.
Methods: TK1 and TYMP levels in multiple liver cell lines were assessed along with the cytotoxicity of the thymidine
conjugate. Cellular accumulation of the thymidine conjugate was determined with organelle-specific dyes. The impacts
of TK1 and TYMP were evaluated with siRNA/shRNA suppression and pseudoviral overexpression. Immunohistochemical
analysis was performed on both normal and tumor tissues. In vivo study was carried out with a subcutaneous liver tumor
model.
Results: We found that the thymidine conjugate had varied activities in liver cancer cells with different levels of TK1 and
TYMP. The conjugate mainly accumulated at endothelial reticulum and was consistent with cytosolic pathways. TK1 was
responsible for the cytotoxicity yet high levels of TYMP counteracted such activities. Levels of TYMP and TK1 in the liver
tumor tissues were significantly higher than those of normal liver tissues. Induced TK1 overexpression decreased
the selectivity of dT-QX due to the concurring cytotoxicity in normal cells. In contrast, shRNA suppression of TYMP
significantly enhanced the selective of the conjugate in vitro and reduced the tumor growth in vivo.
Conclusions: TK1 was responsible for anticancer activity of dT-QX while levels of TYMP counteracted such an activity.
The counteraction by TYMP could be overcome with RNA silencing to significantly enhance the dT-QX selectivity in
cancer cells.
Keywords: Thymidine conjugate, Thymidine phosphorylase, Thymidine kinase 1, Anticancer selectivity, Liver cancer
Background
Thymidine kinase 1 (TK1) and thymidine phosphorylase
(TYMP) are key cytosolic thymidine salvage enzymes and
targeted by anticancer thymidine therapeutics [1-5]. Two
isoforms of TKs have been identified in cells, TK1 in cytosol and TK2 in mitochondria, which convert thymidine,
2’-deoxyuridine and 5-substiuted-2’-deoxyuridine or
* Correspondence:
1
Department of Nanomedicine & Biopharmaceuticals, National Engineering
Research Center for Nanomedicine, Huazhong University of Science and
Technology, Wuhan, Hubei, China
3
Department of Medicinal Chemistry, Virginia Commonwealth University,
Richmond, VA, USA
Full list of author information is available at the end of the article
2’-deoxycytidine (TK2) to the 5’-monophosphate form
[2-4]. Low levels of TK1 are generally expressed in
normal adult cells while high levels of TK1 are characteristic of cancer cells [6-9]. High levels of TYMP have
been reported in the liver, lung and breast tumors and
associate with poor prognostic outcome of cancer patients [6,10-13]. TYMP converts thymidine to thymine
and 2-deoxyribose-1-phosphate reversibly as the catabolic
pathway. Simultaneously, TYMP also acts as a platelet derived endothelial cell growth factor in tumor angiogenesis
and metastasis [6,14-16]. The contradictive role of TYMP
in cancer therapy refers to that high levels of TYMP
© 2015 Wei et al.; licensee BioMed Central. This is an Open Access article distributed under the terms of the Creative
Commons Attribution License ( which permits unrestricted use, distribution, and
reproduction in any medium, provided the original work is properly credited. The Creative Commons Public Domain
Dedication waiver ( applies to the data made available in this article,
unless otherwise stated.
Wei et al. BMC Cancer (2015) 15:159
are required for the activation of 5-fluorouracil prodrugs such as capecitabine to 5-fluoro-2’-deoxyuridine5’-monophosphate (5-FdUMP) as the thymidylate synthase
inhibitor via the reverse catabolic pathway, whereas high
levels of TYMP at the same time act as the tumor growth
factor [17-19]. Overexpression study has confirmed that although induced overexpression of TYMP gene resulted in
enhanced responses to capecitabine, endothelial cell migration was simultaneously induced [20]. Due to the dual roles
of TYMP, mixed and complex outcomes were reported
in clinical trials of thymidine therapeutic [18,19,21,22].
For example, capecitabine or capecitabine combined
with oxaliplatin resulted in only modest improvement in
advanced hepatocellular carcinoma (HCC) patients [21,22].
3’-Deoxy-3’-(18 F)-fluorothymidine in positron emission tomography is an effective contrast agent for the
diagnosis of liver metastasis, fibrosarcoma and lung tumors [23,24]. However, the results did not correlate to the
progressive levels of TK1 in tumor tissues, suggesting a
complicated mechanism, possibly involving catabolism by
TYMP [25,26].
One strategy to circumvent the dual roles of TYMP in
anticancer thymidine therapeutic is to use cytotoxic thymidine analogs other than capecitabine that do not require
metabolic activation by TYMP. For instance, 5-fluoro2’-deoxyuridine (FdUrd) can be directly converted to
active 5-FdUMP by the high levels of TK in cancer cells.
Page 2 of 11
Unfortunately, FdUrd shows far less anticancer potency
with high toxicity due to the rapid catabolism by TYMP
as compared with 5-fluorouracil and capecitabine [27,28].
Thus, a different selective cytotoxic thymidine analog
would be needed. Recently, we reported a thymidine quinoxaline conjugate (dT-QX) with a broad spectrum of anticancer activity and low cytotoxicity on the normal liver
cell line [29]. Although the selectivity of dT-QX was attributed to its unique thymidine linked chemical structure
(Figure 1a), the molecular pathways responsible for the selectivity are unclear. Thus, dT-QX serves a chemical entity
to investigate how TK1 and TYMP impact the activity
in cancer cells. This may potentially reveal an alternative
strategy for thymidine anticancer therapeutic to overcome
the dual roles of TYMP. In this study, we reported the
involvement of TK1 and TYMP in the biological activity of thymidine analog dT-QX in different liver cancer
cell lines, methods to enhance the anticancer selectivity
and in vivo study with a mouse tumor model.
Methods
Cells
Liver cancer cell lines Hep3B and HepG2 were obtained
from American Type Culture Collection, USA. Human
liver cells HL-7702 and liver cancer cells Bel-7402 and
Bel-7404 were from Shanghai Institute of Life Science Cell
Culture Center, China. Cells were maintained in high
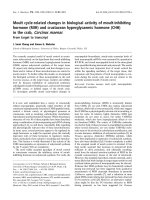
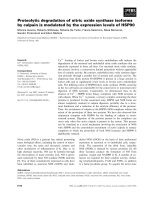
Figure 1 Levels of dT-QX cytotoxicity and cellular TYMP and TK1 proteins among human liver cell lines. (a) Chemical structure of thymidine
analog dT-QX; (b) Cell viability MTT assay on human liver cell lines including HL-7702, Hep3B, HepG2, Bel-7402 and Bel-7404 after treatment of dT-QX
at 50 μM for 24 h (Each data point in the graphs was the mean of triplicates with SEM); (c) Western blot analysis of TYMP and TK1 protein expression
in HL-7702, Hep3B, HepG2, Bel-7402 and Bel-7404 liver cells.
Wei et al. BMC Cancer (2015) 15:159
glucose DMEM medium (Invitrogen, USA) supplemented
with 10% heat-inactivated fetal bovine serum, 25 mM
HEPES, 2 mM L-glutamine, 0.1 mM nonessential amino
acids, 1.0 mM sodium pyruvate, 50 U/mL penicillin, and
50 μg/mL streptomycin at 37°C and 5% CO2.
Cell MTT viability assay
Cells were plated overnight at 5,000 per well on a 96-well
plate and then treated with 50 μM dT-QX for 24 h in the
growth media containing 10% serum and 0.1% DMSO.
MTT assay was carried out as reported [29], and cell
viability was plotted using GraphPad Prism software
(GraphPad Software, USA). Thymidine analog dT-QX
was synthesized as previously reported [29]. Stock solutions of dT-QX (50 mM) were prepared in DMSO and
then diluted in water as a 10× treatment solution containing 0.1% tween-80 and 1% DMSO.
Fluorescence study of dT-QX accumulation in cells
Cells were plated overnight at a density of 20,000 cells
per well on a 48-well plate. For staining with organellespecific fluorescent trackers, cells were treated with the
DMSO control (0.1%) or dT-QX (50 μM) in the full growth
media for 5 h. The treatment media were replaced with an
endoplasmic reticulum (ER) Tracker Red staining solution (1 μM in PBS, Invitrogen, USA) or a mitochondrial
MitoTracker Orange CMTMRos staining solution (100
nM in PBS, Invitrogen, USA) at 37°C for 30 min and then
PBS. Live cell images were captured in PBS with Olympus
IX71 inverted microscope (Tokyo, Japan) equipped with a
digital camera under appropriate fluorescence filter
sets. For ER-specific GFP expression, cells after plating
overnight were transfected with BacMam ER Cell Light
GFP reagent (6 μL, Invitrogen, USA). After 24 h, treatment
of dT-QX or DMSO for 5 h were carried out similarly as
described above. Live cell images were then captured in
PBS with Olympus fluorescence microscope similarly.
Western blot analysis
Cells were plated overnight at a density of 1 × 10⁶ cells
per well on a 6-well plate. Cells were washed with PBS
and lysed with 150 μL RIPA buffer containing protease
and phosphatase inhibitor cocktail. The supernatants were
collected by centrifuge at 14,000 g × 10 min at 4°C and
stored at −80°C. The total protein content in lysates was
determined by enhanced BCA protein assay kit (Beyotime
Institute of Biotechnology, China). Electrophoresis was
carried out on NuPAGE Novex Bis-Tris 4-14% gel
(Invitrogen, USA) under the reduced condition with 5 μg
of proteins per lane. The membrane was incubated with
rabbit anti-TK1 monoclonal (ab76495, Abcam, USA) or
anti-TYMP polyclonal antibody (ab69120, Abcam, USA)
and mouse GAPDH antibody (Invitrogen, USA). Targeted
proteins were visualized with Qdot 625 conjugate kit
Page 3 of 11
(Invitrogen, USA). Gel images were captured with ZF-258
Gel Imaging System (Shanghai Jiapeng Scientific Co. Ltd,
China) under illuminating light of 350 nm wavelength.
siRNA suppression study
Suppression of TK1 or TYMP proteins in cells was performed using Amaxa Nucleofector Kit V with program
T-028 (Lonza, Germany) and Silencer-select Validated
siRNAs for human TK1 (100 nM, 1:1 mixture of s14158
and s14159, Ambion, USA), TYMP (400 nM, s4433) or
control (100 nM) according to manufacturer’s protocol.
After electroporation, cells were plated for 40 h and then
divided into two portions for western blot and MTT viability studies. Western blot analysis of TK1 and TYMP
in cells were carried out at 48 h post transfection as described above. For MTT study, cells were treated with 0,
10, 20 or 50 μM of dT-QX in the growth media at 48 h
post transfection. Cell viability MTT assay was carried
out after treatment for 24 h and analyzed with GraphPad
Prism software (GraphPad Software, USA).
Transduction with TK1 lentiviral particles
A lentiviral open reading frame plasmid Lv-TK1 (EXC0529-Lv105) containing human TK1 mRNA complete
sequence [PubMed cDNA clone MGC number: 3644] and
a control plasmid (EX-NEG-Lv105) were obtained from
GeneCopoeia, USA. The sequences of cloned plasmids
were confirmed by DNA sequencing using 5’-GCGGT
AGGCG TGTAC GGT and 5’-ATTGT GGATG AATAC
TGCC as the forward and reverse primers, respectively.
Pseudo lentiviral particles for TK1 overexpression and
the control were produced with Lv-TK1 or the control
plasmid and Lenti-Pac HIV expression packaging kit
(GeneCopoeia, USA) on 293T cells according to manufacturer’s protocol. Pseudovirus titer was estimated on Hep3B
cells under the selection of puromycin (0.5 μg/mL) as
1.6 × 10⁷ and 1.2 × 10⁷ transducing units/mL for TK1 and
the control, respectively. Transduction of HL-7702 and
Bel-7402 cells was carried out at a cell density of 50,000 in
a 24-well plate with 80 μL pseudovirus stock solution
plus poloxamer F108 (100 μg/mL, 10 μL) and polybrene
100 (100 μg/mL, 10 μL). After 24 h, the transduction
media were replaced with the normal DMEM growth
media, and cells were grown in a 6-well plate for 7 days.
Western blot analysis and cell viability MTT assay with
compound treatment were then carried out similarly as
described in siRNA study.
shRNA suppression of TYMP
Suppression of TYMP in cells was performed with
Amaxa Nucleofector Kit V with program T-028 (Lonza,
Germany) and SureSilencing shRNA TYMP plasmid
(25 μg, KH02651P, clone No 4, Qiagen, USA) or the
ontrol plasmid (25 μg, NEG4-P). The inserted sequence
Wei et al. BMC Cancer (2015) 15:159
in shRNA TYMP plasmid was confirmed by DNA sequencing. After electroporation, cells were plated for 60 h and
then divided into two portions for western blot and MTT
viability studies. Western blot analysis of TK1 and TYMP
levels in cells and cell viability MTT assay were carried
out at 72 h post electroporation similarly as described
above.
Page 4 of 11
was repeated one more time on day 8. During the
treatment, the growth of tumors and body weight were
monitored daily. Statistical analysis of the treatments was
performed with GraphPad Prism software using two way
ANOVA with Bonferroni posttests. No significant abnormal behavior or weight loss was observed throughout the
treatment. Images of tumors were obtained on day 18 at
the end of treatment study.
Immunohistochemical analysis
The use of human pathological tissue slides was approved by the Medical Ethnical Committee of Huazhong
University of Science and Technology. Immunohistochemical (IHC) analysis was carried out according to manufacturer’s recommendation. Briefly, after deparafinization,
antigen retrieval and protein block, tissue section slides
were incubated with rabbit TK1 (ab59271, Abcam, USA)
or TYMP polyclonal antibody (ab69120, Abcam, USA) in
Tris saline buffer with 1% BSA (1:200 dilution). Staining
was achieved using rabbit specific HRP/DAB detection
IHC kit (ab64261, Abcam, USA). Staining of nuclei was
carried out with a hematoxylin solution. Slides were
mounted, and images were captured with Olympus IX71
inverted microscope (Tokyo, Japan).
Mouse tumor model study
Animal protocol was approved by the Animal Care and
Use Committee of College of Life Science and Technology
at Huazhong University of Science and Technology. SFP
male nude BALB/c mice (approximately 24 g) were obtained from Hunan Slake Jingda Experimental Animal Co.
Ltd., China. Human liver cancer Bel-7402 cells (1x10⁷ cells
per mouse) were injected subcutaneously at the lower
back of nude BALB/c mice [30]. Once the tumor reached
to an average size of 9 × 9 mm, mice were randomly
divided into groups for the following studies. In vivo
transfection control and TYMP shRNA plasmid complex
(200 μL) were prepared in a sterile 5% glucose solution
with TurboFect agent (ThermoFisher, USA) and injected
intratumorally at a dose of 10 μg DNA, 50 μL per mouse.
In vivo suppression of TYMP in tumor tissue via intratumoral injection was first validated by western blot analysis.
After 72 h, mice were euthanized and tumor tissues
were collected and homogenized at 4°C in 750 μL RIPA
lysis buffer containing protease and phosphatase inhibitor cocktail. The supernatants were collected by centrifuge at 14,000 g × 10 min at 4°C, and western blot analysis
was carried out as described above. Treatment groups
included: a) iv injection of PBS for 4 day (3 mice); b) iv
injection of dT-QX (0.75 mg/kg body weight) for 4 days
(3 mice); c) intratumoral injection of TYMP shRNA
followed by iv injection of PBS after 2 days for 4 days
(4 mice); and d) intratumoral injection of TYMP shRNA
followed by iv injection of dT-QX (0.75 mg/kg body
weight) after 2 days for 4 days (4 mice). The treatment
Results
dT-QX exhibits varied cytotoxicity on liver cancer cells that
have different levels of TK1 and TYMP
In addition to the reported selective activity of dT-QX
[29], significant variation in the cytotoxicity of thymidine
analog dT-QX was found among five different liver cell
lines, with 70% for Hep3B cells, 60% for Bel-7404 cells,
and down to 45% and 40% for HepG2 and Bel-7402,
respectively after 24 h incubation. In contrast, only
14% cytotoxicity was observed in HL-7702 cell line
(Figure 1b). Because dT-QX is an analog of thymidine,
levels of key thymidine salvage and metabolic enzymes
such as TYMP and TK1 in these cells were investigated to
see whether there was any correlation to the levels of the
cytotoxicity. Western blot analysis revealed that there was
a significant contrast in the levels of TYMP and TK1
among these cell lines (Figure 1c). For catabolic TYMP,
only a basal level was found in Hep3B cells while low
levels of expression were observed in HL-7702, HepG2
and Bel-7404 cells. In contrast, Bel-7402 cells had significantly high levels of TYMP. Simultaneously, TK1 was
highly expressed in Hep3B, HepG2 and Bel-7404 cells,
intermediately in Bel-7402 and minimal in HL-7702 cells.
These results implied that the cell toxicity of dT-QX
might correlate with TK1 levels in cells, i.e., high in Hep3B
and Bel-7404 cells, intermediate in Bel-7402 and low in
HL-7702 cells except that HepG2 cells did not fit well
with this hypothesis. The role of TYMP on the biological
activity of dT-QX was not clear based on these data. The
possible correlation of high levels of TK1 with the cytotoxicity of dT-QX suggested that dT-QX might be significantly converted to the 5’-phosphate form in Hep3B
cells by the salvage pathway as a thymidine analog. Thus,
HPLC analysis of the Hep3B cells lysate after treatment of
50 μM dT-QX was carried out under various conditions
with HPLC separation conditions for nucleosides and
nucleotides [31]. Unfortunately, only intact dT-QX was
observed in HPLC analysis based on the unique UV absorbance signals of dT-QX at 365 nm coupled with mass
analysis. Therefore, the roles of thymidine pathways on
the dT-QX cytotoxicity needed to be determined and were
investigated by the following alternative methods.
The cellular accumulation of dT-QX was first assessed
by the fluorescent property of dT-QX. dT-QX has a
maximum excitation and emission at 398 and 483 nm,
Wei et al. BMC Cancer (2015) 15:159
respectively [see Additional file 1: Figure S1], similar to
the fluorescent dye Hoechst 34580 [32]. It was implied
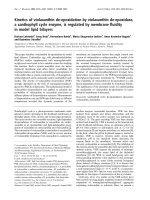
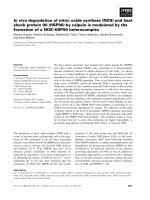
that dT-QX accumulated mostly at ER in Hep3B cells
because the blue fluorescence of dT-QX matched with
most of ER-specific red fluorescence in cells (Figure 2a).
Cellular accumulation of dT-QX was also compared
with mitochondria-specific fluorescent tracker because
mitochondrial TK2 could also phosphorylate thymidine
analogs as an additional salvage pathway besides cytosolic
TK1 [33,34]. The resulting images suggested that dT-QX
accumulated at sites other than the mitochondria
(Figure 2b), although there were some overlaps of dTQX in the mitochondria. Further studies with HepG2
and HL-7702 cells also indicated a similar ER accumulation of dT-QX by ER-specific tracker [see Additional
file 1: Figure S1]. Complementary ER-specific GFP expression using transfection method also consistently
suggested ER as the major accumulation site of dT-QX
[see Additional file 1: Figure S1]. In addition, the ER
location of dT-QX in cells did not change significantly
with extended incubation time over 10 h. These results
suggested that the cytotoxicity of dT-QX were modulated via cytosolic processes.
Page 5 of 11
Significant inhibition of DNA synthesis in cells has been
previously reported upon the treatment of Hep3B and
HepG2 cells with dT-QX for 5 h, but not in HL-7702 cells
with low TK1 and TYMP expression [29]. On the other
hand, the cellular accumulation of dT-QX was only observed in the cytosol not in the nuclei of cells (Figure 2).
In addition, no 5’-phoaphate metabolite of dT-QX was
found by HPLC analysis with Hep3B cell lysates in this
study. These results presented a dilemma on the mechanism of dT-QX because phosphorylated dT-QX was expected to be formed and observed in the nuclei of cancer
cells. The key question would be whether TK1 and TYMP
were involved in the cytotoxic action of dT-QX in cancer
cells. Thus, we focused on the following investigations
on the cell-based study to assess the impact of TK1 and
TYMP on the activity of dT-QX, rather than the purified
recombinant TK1 and TYMP protein study.
Cellular TK1 and TYMP levels regulate the selective
cytotoxicity of dT-QX
Investigation of the involvement of TYMP and TK1 in the
cytotoxicity of dT-QX was verified with transient siRNA
silencing of either protein followed by MTT viability assay
Figure 2 Fluorescence images of intracellular accumulation of dT-QX in Hep3B cells. Cells were treated with 50 μM dT-QX or DMSO for 5 h
and then stained with organelle-specific ER Tractor Red (a) or Mito-tracker Orange fluorescent dye (b). Images were representative from three
independent studies.
Wei et al. BMC Cancer (2015) 15:159
after dT-QX treatment. Hep3B and Bel-7402 cells were
investigated as representatives because TK1 protein was
predominantly expressed in Hep3B cells with basal
levels of TYMP while Bel-7402 has the highest level of
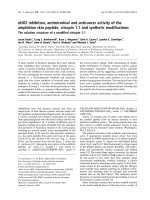
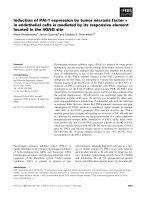
TYMP (Figure 1c). Upon transient silencing TK1 protein
in Hep3B cells, the cell viability was markedly increased at
all concentrations compared with those of siRNA-control,
e.g., from 38% to 65% at 50 μM dT-QX (Figure 3d).
Increase of the cell viability was similarly observed in
Bel-7402 cells, although at a less extent (Figure 3c). In
contrast, a reduced TYMP level in Bel-7702 cells led to
a pronounced decrease of cell viability by 15% (Figure 3c).
These results implied that TK1 was involved in the cytotoxicity of dT-QX and that high levels of TYMP counteracted the biological activity of dT-QX in cells. This
observance was also consistent with the low cytotoxicity
of dT-QX observed in HL-7702 cells where neither TK1
nor TYMP was significantly expressed (Figure 1c). Similarly, for HepG2 cells, siRNA silencing study showed that
transient suppression of TK1 led to a significant decrease
of dT-QX cytotoxicity at all concentrations whereas silencing TYMP produced a 7% increase of dT-QX activity at
50 μM [see Additional file 2: Figure S2].
To further confirm TK1 were mainly responsible for
the dT-QX cytotoxicity in cells, lentiviral overexpression
of TK1 was carried out on Bel-7402 cells and HL-7702
cell line as a comparison (Figure 4). The pseudo lentiviral
viral particles can deliver and integrate a human TK1 gene
into the genome of targeted cells without virus replication.
Page 6 of 11
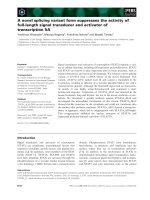
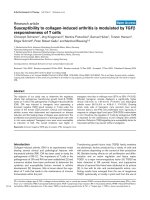
Western blot analysis confirmed that the overexpression
of TK1 was achieved in Bel-7402 cells by 1.5 folds and 9
folds in HL-7702 cells (Figure 4a-b). Consistently with
TK1 activation, the cytotoxicity of dT-QX increased by
20% at all concentrations from 10 to 50 μM versus those
of Bel-7402 cells alone (Figure 4c). More importantly, a
phenomenal cytotoxicity of dT-QX was observed in
HL-7702 cells with lentiviral overexpression of TK1
versus those of cells alone (Figure 4d). Therefore, the
results from our siRNA suppression and viral overexpression studies indicated that high levels of cytosolic
TK1 were responsible for the cytotoxicity of dT-QX in
liver cancer cells while high levels of TYMP counteracted the biological activity.
High levels of TYMP are an important clinical subtype
and can effectively be counteracted by shRNA silencing
Clinical relevance of high levels of TK1 and TYMP was
then assessed on human HCC tumor and normal liver
tissues with immunohistochemical (IHC) analysis. Normal
human liver tissue showed only low basal levels of TYMP
and TK1 protein expression as compared to those of
tumor samples (panel A versus B, C and D, Figure 5a).
This result validated that HL-7702 cells with low levels of
TYMP and TYMP was a derived normal liver cell line
for this study (Figure 1c). In contrast, TYMP and TK1
positive staining were overwhelmingly observed in the
tumor tissues, suggesting that Bel-7402 cell line indeed
represented such a subtype of liver tumors. These results
Figure 3 Silence of TK1 or TYMP expression impacted dT-QX cytotoxicity. (a) Western blot analysis of TYMP and TK1 in Bel-7402 and Hep3B
cells at 48 h post siRNA suppression; (b) Relative percent protein expression of TYMP and TK1 in western blot analysis after normalization with
that of GADPH; (c) and (d) Cell viability MTT results after 24 h treatment with dT-QX at 48 h post siRNA suppression in Bel-7402 and Hep3B cells.
Each data point in the graphs was the mean of triplicates with SEM. All experiments were independently repeated at least two times (*P < 0.05 as
compared to those under the same dT-QX concentration in controls).
Wei et al. BMC Cancer (2015) 15:159
Page 7 of 11
Figure 4 Viral overexpression of TK1 enhanced the cytotoxicity of dT-QX. (a) Western blot analysis of TYMP and TK1 level post transduction
of Bel-7402 and HL-7702 cells with either control or TK1 pseudo lentiviral particles; (b) Relative percent protein expression of TYMP and TK1 in western
blot analysis after normalization with that of GADPH; (c) and (d) Cell viability MTT results after 24 h treatment with dT-QX post viral transduction in
Bel-7402 and HL-7702 cells. Each data point in the graphs was the mean of triplicates with SEM. All experiments were independently repeated
at least two times (*P < 0.05 as compared to those under the same dT-QX concentration in cells alone).
Figure 5 High levels of TYMP and TK1 are clinically significant in liver tumor tissues. (a) IHC analysis of TK1 (top) and TYMP (below) on human
normal liver tissue sample (A) and human liver cancer tumor tissue sample (B, C and D) co-stained with hematoxylin; (b) IHC analysis of TK1
(top panels) and TYMP (bottom panels) on mouse normal liver tissue (E) and mouse Bel-7402 tumor tissue (F, G and H) co-stained with hematoxylin.
Wei et al. BMC Cancer (2015) 15:159
indicated that high expression of TYMP and TK1 in liver
tumors was an important subtype of liver cancers that was
needed to be addressed specifically for anti-cancer thymidine analog dT-QX. Moreover, induced high level of
TYMP has been found in tumor tissues due to inflammatory infiltration or after radiotherapeutic treatment
and chemotherapy such as paclitaxel, doxorubicin and
oxaliplatin [18,35,36]. Furthermore, tumor tissues from the
established Bel-7402 mouse model had consistently high
expression of TYMP and TK1 by IHC analysis, whereas
the mouse normal liver tissue showed only basal level
of either protein (panels F-H versus panels E, Figure 5b).
Thus, the Bel-7402 mouse tumor model was validated
and used for the following in vivo dT-QX treatment study.
To enhance the selective cytotoxicity of dT-QX, viral
overexpression of TK1 in cells clearly was not an effective
strategy on cancer cells due to a concurring high cytotoxicity in normal liver HL-7702 cells (Figure 4). Alternative
way was to significantly knock down the TYMP level as
indicated with siRNA suppression (Figure 3). However,
siRNA suppression was not effective to significantly lower
TYMP level in Bel-7402 cells even at a high concentration
of 400 nM (Figure 3a-b). Recently, shRNA silencing has
been shown to be an effective method for both in vitro
cellular and in vivo animal studies [37]. Thus, transfection
of shRNA TYMP plasmid on Bel-7402 was carried out.
Western blot analysis confirmed that approximately 70%
suppression of TYMP was achieved in Bel-7402 cells while
Page 8 of 11
the level of TK1 was not impacted (Figure 6a-b). Subsequent cell viability study revealed a significantly elevated
cytotoxicity of dT-QX versus those of cells alone. In contrast, no impact on TYMP or TK1 was found in HL-7702
cells under the same condition. More importantly, no
significant cytotoxicity was observed in HL-7702 cells
(Figure 6c). All these results indicated that suppression
of TYMP by shRNA is an effective approach to enhance
the selective cytotoxicity of dT-QX on cancer cells with
high levels of TYMP and TK1.
Combination of TYMP suppression plus dT-QX treatment
is effective in the liver tumor model in vivo
In vivo validation of the combined treatment of TYMP
shRNA suppression plus dT-QX was carried out in a subcutaneous tumor model of human liver cancer Bel-7402
cells. Western blot analysis indicated that intratumoral
injection of TYMP shRNA complex in vivo significantly
reduced the TYMP level in tumor tissue than those of control at 72 h post injection [see Additional file 3: Figure S3],
confirming the effectiveness of intratumoral delivery of
shRNA. The combined treatment was then carried out in
the tumor model with the intratumoral delivery of TYMP
shRNA complex first and then intravenous injection of
dT-QX or PBS (Figure 7). Clearly, TYMP shRNA plus
dT-QX significantly inhibited the tumor growth as compared to those of shRNA alone after two rounds of treatment. Consistently, three out of four tumors in the
Figure 6 ShRNA suppression of TYMP was effective to enhance the selective cytotoxicity of dT-QX. (a) Western blot analysis of TYMP and
TK1 level at 72 h post transfection of HL-7702 and Bel-7402 cells with either the control or TYMP shRNA plasmid; (b) Relative percent protein
expression of TYMP and TK1 in western blot analysis after normalization with that of GADPH; (c) and (d) Cell viability MTT results after 24 h
treatment with dT-QX at 72 h post shRNA suppression in Bel-7402 and Hep3B cells. Each data point in the graphs was the mean of triplicates
with SEM. All experiments were independently repeated at least two times (*P < 0.05 as compared to those under the same dT-QX concentration in
cells alone).
Wei et al. BMC Cancer (2015) 15:159
Page 9 of 11
Figure 7 In vivo study of TYMP shRNA plus dT-QX treatment in the subcutaneous Bel-7402 mouse tumor model. (a) Growth profile of
the tumor size over 2 repeated treatment with or without intratumoral injection of TYMP shRNA followed by intravenous injection of dT-QX or
PBS; Statistical analysis of the treatments was performed with GraphPad Prism software using two way ANOVA with Bonferroni posttests, indicating
that there was significant difference over time between the group of it-TYMP shRNA + iv dT-QX and other three groups (P < 0.05). (b) Images of the
tumors after 2 repeated treatment with intratumoral shRNA injection.
combined treatment have a much smaller cluster size
than those with shRNA alone (Figure 7b). On the other
hand, intravenous injection of dT-QX alone without
shRNA suppression showed no significant inhibition
of the tumor growth as compare with that of PBS
(Figure 7). These in vivo results demonstrated that
TYMP suppression plus dT-QX treatment was able to
control the aggressive progression of Bel-7402 tumors
and suggested that a combined treatment had a therapeutic potential on tumors with high levels of TYMP
and TK1.
Discussion
Our results indicated that high levels of TK1 were
responsible for the cytotoxicity of dT-QX and high levels
of TYMP counteracted this activity. In Hep3B cells, the
transient suppression of TK1 led to a significant reduction of dT-QX cytotoxicity (Figure 3) while the overexpression of TK1 in HL-7702 resulted in a pronounced
cytotoxicity (Figure 4). Similarly, the overexpression of
TK1 in Bel-7402 cells led to increased cytotoxicity of
dT-QX (Figure 3). These results in combined with the
ER accumulation of dT-QX implied that cytosolic TK1
played a significant role on the cytotoxicity of dT-QX
in cells. In contrast, TYMP counteracted the activity of
dT-QX, which was supported by the enhanced cytotoxicity of dT-QX observed with siRNA or shRNA suppression in Bel-7402 cells (Figures 3 and 6). The counteraction
of TYMP was further supported by the difference in cytotoxicity observed between Hep3B and other liver cancer
cells that had high levels of TYMP (Figure 1). The counteraction by TYMP on dT-QX may be attributed to the
possible catabolism of the thymidine quinoxaline conjugate to inactive metabolites, of which a recombinant enzymatic study could provide further insights. Unfortunately,
the exact molecular targets by dT-QX have not so far been
identified. In addition, the conversion of dT-QX to
activated metabolites by TK1 has not been observed as
expected by HPLC analysis in the cell treatment lysates.
These results suggested that there were additional
unknown pathways and mechanisms besides TK1 and
TYMP for the action of dT-QX in cancer cells, which
are currently under investigations.
Different levels of dT-QX cytotoxicity among these
liver cancer cell lines reflected a common challenge in
cancer chemotherapy due to the heterogeneity of tumor
cells (Figure 1). All cancer cell lines had consistently high
TK1 expression as compared to the normal liver derived
HL-7702 cell line (Figure 1c), which was validated by IHC
on human normal liver versus tumor samples (Figure 5a),
supported TK1 as a tumor-specific target. In contrast,
levels of TYMP protein varied dramatically among liver
cancer cells but remained at a low level in normal liver
cells. Clinically, induced high levels of TYMP have been
commonly observed in tumor tissues due to inflammatory infiltration or after radiotherapeutic treatment and
chemotherapy such as paclitaxel, doxorubicin and oxaliplatin [18,35,36]. Thus, high levels of TYMP in liver
tumors are important subtypes and/or variations of liver
cancers that need to be addressed specifically due to
TYMP as a growth factor in tumors [14-16]. Our results
showed that induced overexpression of TK1 via viral particles was unfortunately an ineffective approach to enhance
the selective activity of thymidine analog due to induced
cytotoxicity in the normal cells (Figure 4c vs 4d). Overexpression of herpes TK1 via viral gene delivery has been
shown to increase the efficacy of nucleoside analogs in
HCC models [38,39], while our data suggested that nonspecific cytotoxicity might concur in the liver cells. More
importantly, our in vitro studies demonstrated that the
Wei et al. BMC Cancer (2015) 15:159
suppression of TYMP by shRNA significantly enhanced
the selectivity of thymidine analog dT-QX on cancer
cells that have high levels of TYMP and TK1 (Figure 6).
In addition, our in vivo subcutaneous Bel-7402 tumor
model further supported the effectiveness of this approach
(Figure 7).
The potential of this combination strategy has recently
manifested by the result from clinical phase II trial of
TAS-102 on colorectal cancer [40], although additional
studies on refractory subtype are needed [41]. TAS-102
is a combination of antimetabolite α,α,α-trifluorothymidine plus a potent TYMP chemical inhibitor. Trifluorothymidine is activated via cytosolic TK1 phosphorylation
to block thymidylate synthase [42] yet is highly toxic and
has short plasma half-life [18]. The efficacy of TS-102 has
been shown to correlate with the ratio of TK1/TYMP [42]
and had limited responses in patients with solid tumors
[43,44]. In contrast, our dT-QX selectively blocked cellular
DNA synthesis in liver cancer cells with subsequent
mitochondrial superoxide stress, possibly via DNA intercalation [29]. More importantly, our results in this study
indicated that TYMP alone was a critical target to
enhance the selectivity of a thymidine conjugate on
cancer cells.
Conclusions
Our study demonstrated that TK1 was responsible for
anticancer activity of thymidine conjugates while TYMP
as the thymidine metabolic enzyme was responsible for
the varied biological activity. By taking advantage of low
levels of TK1 and TYMP in normal liver tissue, the use
of anticancer thymidine conjugate combined with TYMP
suppression could directly target thymidine salvage
pathway in liver cancer cells with various levels of TYMP
addressed as tumor heterogeneity to be fully inhibited.
Thus, the treatment of thymidine conjugate combined
with TYMP suppression could be a promising direction
to control the aggressive growth of liver tumors that
had high levels of TYMP and TK1. This strategy may
well be expanded in the applications of other thymidine
analogs used for cancer diagnosis and therapeutics.
Availability of supporting data
The data supporting the results of this article are included
within the article and its additional files.
Additional files
Additional file 1: Figure S1. Fluorescence spectra of dT-QX and images
in cellular accumulation studies. (a) The excitation and emission spectra
were obtained with a 0.5 mM dT-QX methanol solution with Hitachi
F-4500 fluorescence spectrometer (Tokyo, Japan) at room temperature;
the maximum fluorescence excitation and emission wavelengths are at
398 and 483 nm, respectively. (b) Fluorescence images of intracellular
accumulation of dT-QX in HepG2 and HL-7702 cells with co-staining of
Page 10 of 11
ER Tractor Red dye. Cells were treated with either DMSO (top panels) or
50 μM dT-QX (bottom panels) for 5 h and then stained with ER tracker
Red. (c) Fluorescence images of intracellular accumulation of dT-QX in
Hep3B, HepG2 and HL-7702 cells with ER-specific GFP expression. Cells
were first treated with Beckmam ER-GFF transfect agent for 24 h and
then treated with either DMSO (top panels) or 50 μM dT-QX (bottom
panels) for 5 h and then images were captured with fluorescence
microscope.
Additional file 2: Figure S2. Modulation of TYMP and TK1 by siRNA
suppression in HepG2 cells. Western blot analysis of TYMP and TK1
expression in HepG2 cells was carried out at 48 h post siRNA suppression.
Cell viability was obtained after 24 h treatment with dT-QX at 48 h post
siRNA suppression (*P < 0.05 as compared to those under the same
dT-QX concentration in cells alone).
Additional file 3: Figure S3. Western blot analysis of TYMP/TK1 expression
in mouse tumor tissues at 72 h post intratumoral injection of control or TYMP
shRNA plasmid complex.
Abbreviations
TK1: Thymidine kinase 1; TYMP: Thymidine phosphorylase;
HCC: Hepatocellular carcinoma; dT-QX: Thymidine quinoxaline conjugate;
ER: Endoplasmic reticulum; IHC: Immunohistochemical.
Competing interests
The authors declare that they have no competing interests.
Authors’ contributions
QW carried out the molecular studies on cells. HL carried out the animal
study. HZ prepared the pathological samples. DZ synthesized the conjugate
and performed the characterization. ZZ participated in preparation and
coordination of clinical samples. QZ conceived of the study, and participate
in the design and coordination and drafted the manuscript. All authors read
and approved the final manuscript.
Acknowledgements
This work is supported by the National Natural Science Foundation of China
(81372403) and the National Basic Research Program of China (2011CB933100).
Author details
1
Department of Nanomedicine & Biopharmaceuticals, National Engineering
Research Center for Nanomedicine, Huazhong University of Science and
Technology, Wuhan, Hubei, China. 2Hepatic Surgery Center, Tongji Hospital,
Tongji Medical College, Huazhong University of Science and Technology,
Wuhan, Hubei, China. 3Department of Medicinal Chemistry, Virginia
Commonwealth University, Richmond, VA, USA.
Received: 19 July 2014 Accepted: 27 February 2015
References
1. Liekens S, Bronckaers A, Pérez-Pérez MJ, Balzarini J. Targeting platelet-derived
endothelial cell growth factor/thymidine phosphorylase for cancer therapy.
Biochem Pharmacol. 2007;74:1555–67.
2. Barth RF, Yang W, Wu G, Swindall M, Byun Y, Narayanasamy S, et al.
Thymidine kinase 1 as a molecular target for boron neutron capture
therapy of brain tumors. Proc Natl Acad Sci U S A. 2008;105:17493–7.
3. Jarchow-Choy SK, Sjuvarsson E, Sintim HO, Eriksson S, Kool ET. Nonpolar
nucleoside mimics as active substrates for human thymidine kinases. J Am
Chem Soc. 2009;131:5488–94.
4. Kortylewicz ZP, Kimura Y, Inoue K, Mack E, Baranowska-Kortylewicz J.
Radiolabeled cyclosaligenyl monophosphates of 5-iodo-2'-deoxyuridine,
5-iodo-3'-fluoro-2',3'-dideoxyuridine, and 3'-fluorothymidine for molecular
radiotherapy of cancer: synthesis and biological evaluation. J Med Chem.
2012;55:2649–71.
5. Thorn CF, Marsh S, Carrillo MW, McLeod HL, Klein TE, Altman RB.
PharmGKB summary: fluoropyrimidine pathways. Pharmacogenet
Genomics. 2011;21:237–42.
6. Brockenbrough JS, Morihara JK, Hawes SE, Stern JE, Rasey JS, Wiens LW, et al.
Thymidine kinase 1 and thymidine phosphorylase expression in non-small-cell
Wei et al. BMC Cancer (2015) 15:159
7.
8.
9.
10.
11.
12.
13.
14.
15.
16.
17.
18.
19.
20.
21.
22.
23.
24.
25.
26.
27.
28.
lung carcinoma in relation to angiogenesis and proliferation. J Histochem
Cytochem. 2009;57:1087–97.
Shintani M, Urano M, Takakuwa Y, Kuroda M, Kamoshida S. Immunohistochemical
characterization of pyrimidine synthetic enzymes, thymidine kinase-1 and
thymidylate synthase, in various types of cancer. Oncol Rep. 2010;23:1345–50.
Xu Y, Shi QL, Ma H, Zhou H, Lu Z, Yu B, et al. High thymidine kinase 1 (TK1)
expression is a predictor of poor survival in patients with pT1 of lung
adenocarcinoma. Tumour Biol. 2012;33:475–83.
Alegre MM, Robison RA, O'Neill KL. Thymidine kinase 1 upregulation is an
early event in breast tumor formation. J Oncol. 2012;2012:575647.
Morinaga S, Yamamoto Y, Noguchi Y, Imada T, Rino Y, Akaike M, et al.
Platelet-derived endothelial cell growth factor (PD-ECGF) is up-regulated in
human hepatocellular carcinoma (HCC) and the corresponding hepatitis
liver. Hepatogastroenterology. 2003;50:1521–6.
Guo L, Kuroda N, Toi M, Miyazaki E, Hayashi Y, Enzan H, et al. Increased
expression of platelet-derived endothelial cell growth factor in human
hepatocellular carcinomas correlated with high Edmondson grades and
portal vein tumor thrombosis. Oncol Rep. 2001;8:871–6.
Hong SP, Shin SK, Bang S, Park SW, Chung JB, Lee WJ, et al. Prognostic
value of thymidine phosphorylase expression for pancreatic cancer.
Hepatogastroenterology. 2009;56:1178–82.
Aoki S, Yamada Y, Nakamura K, Taki T, Tobiume M, Honda N. Thymidine
phosphorylase expression as a prognostic marker for predicting recurrence
in primary superficial bladder cancer. Oncol Rep. 2006;16:279–84.
Kobayashi T, Kawahara H, Koido S, Kobayashi S, Kashiwagi H, Yanaga K.
Significance of thymidine phosphorylase expression in stromal cells around
invasive front of rectal cancer. Hepatogastroenterology. 2008;55:2045–8.
Kikuno N, Moriyama-Gonda N, Yoshino T, Yoneda T, Urakami S, Terashima
M, et al. Blockade of paclitaxel-induced thymidine phosphorylase expression
can accelerate apoptosis in human prostate cancer cells. Cancer Res.
2004;64:7526–32.
Lu H, Klein RS, Schwartz EL. Antiangiogenic and antitumor activity of
6-(2-aminoethyl)amino-5-chlorouracil, a novel small-molecule inhibitor of
thymidine phosphorylase, in combination with the vascular endothelial
growth factor-trap. Clin Cancer Res. 2009;15:5136–44.
Ciccolini J, Evrard A, Cuq P. Thymidine phosphorylase and fluoropyrimidines
efficacy: a Jekyll and Hyde story. Curr Med Chem Anticancer Agents.
2004;4:71–81.
Bronckaers A, Gago F, Balzarini J, Liekens S. The dual role of thymidine
phosphorylase in cancer development and chemotherapy. Med Res Rev.
2009;29:903–53.
Bonotto M, Bozza C, Di Loreto C, Osa EO, Poletto E, Puglisi F. Making
capecitabine targeted therapy for breast cancer: which is the role of
thymidine phosphorylase? Clin Breast Cancer. 2013;13:167–72.
Zhou J, Xiao YS, Tang ZY, Fan J, Wu ZQ, Zhao Y, et al. Transfection of
thymidine phosphorylase cDNA to human hepatocellular carcinoma cells
enhances sensitivity to fluoropyrimidine but augments endothelial cell
migration. J Cancer Res Clin Oncol. 2005;131:547–51.
von Delius S, Lersch C, Mayr M, Stock K, Schulte-Frohlinde E, Schmid RM,
et al. Capecitabine for treatment of advanced hepatocellular carcinoma.
Hepatogastroenterology. 2007;54:2310–4.
Sun W, Sohal D, Haller DG, Mykulowycz K, Rosen M, Soulen MC, et al. Phase
2 trial of bevacizumab, capecitabine, and oxaliplatin in treatment of
advanced hepatocellular carcinoma. Cancer. 2011;117:3187–92.
Shields AF, Grierson JR, Dohmen BM, Machulla HJ, Stayanoff JC,
Lawhorn-Crews JM, et al. Imaging proliferation in vivo with (F-18)FLT
and positron emission tomography. Nat Med. 1998;4:1334–6.
Leyton J, Latigo JR, Perumal M, Dhaliwal H, He Q, Aboagye EO. Early
detection of tumor response to chemotherapy by 3'-deoxy-3'-(18F)
fluorothymidine positron emission tomography: the effect of cisplatin on a
fibrosarcoma tumor model in vivo. Cancer Res. 2005;65:4202–10.
Zhang CC, Yan Z, Li W, Kuszpit K, Painter CL, Zhang Q, et al. ((18)F)FLT-PET
imaging does not always "light up" proliferating tumor cells. Clin Cancer
Res. 2012;18:1303–12.
McKinley ET, Ayers GD, Smith RA, Saleh SA, Zhao P, Washington MK, et al.
Limits of (18F)-FLT PET as a biomarker of proliferation in oncology. PLoS
One. 2013;83:e58938.
Poorter RL, Bakker PJ, Veenhof CH. Continuous infusion of chemotherapy:
Focus on 5-fluorouracil and fluorodeoxyuridine. Pharm World Sci. 1998;20:45–59.
Shindoh H, Kawashima A, Shishido N, Nakano K, Kobayashi K, Horii I.
Relationship between AUC of 5'-DFUR and toxicity of capecitabine,
Page 11 of 11
29.
30.
31.
32.
33.
34.
35.
36.
37.
38.
39.
40.
41.
42.
43.
44.
fluoropyrimidine carbamate analogs, and 5'-DFUR in monkeys, mice, and
rats. J Toxicol Sci. 2006;31:265–85.
Wei Q, Zhang D, Yao A, Mai L, Zhang Z, Zhou Q. Design, synthesis, and
in vitro and in vivo biological studies of a 3'-deoxythymidine conjugate that
potentially kills cancer cells selectively. PLoS One. 2012;7:e52199.
Mai L, Yao A, Li J, Wei Q, Yuchi M, He X, et al. Cyanine 5.5 conjugated
nanobubbles as a tumor selective contrast agent for dual ultrasoundfluorescence imaging in a mouse model. PLoS One. 2013;8:e61224.
Zhou Q, Qu Y, Mangrum JB, Wang X. DNA Alkylation with N-Methylquinolinium
Quinone Methide to N2-dG Adducts Resulting in Extensive Stops in
Primer Extension with DNA Polymerases and Subsequent Suppression of
GFP Expression in A549 Cells. Chem Res Toxicol. 2011;24:402–11.
Shapiro HM, Perlmutter NG. Violet laser diodes as light sources for
cytometry. Cytometry. 2001;44:133–6.
Wang L, Sun R, Eriksson S. The kinetic effects on thymidine kinase 2 by
enzyme-bound dTTP may explain the mitochondrial side effects of antiviral
thymidine analogs. Antimicrob Agents Chemother. 2011;55:2552–8.
Priego EM, Karlsson A, Gago F, Camarasa MJ, Balzarini J, Pérez-Pérez MJ.
Recent advances in thymidine kinase 2 (TK2) inhibitors and new
perspectives for potential applications. Curr Pharm Des. 2012;18:2981–94.
Sawada N, Ishikawa T, Sekiguchi F, Tanaka Y, Ishitsuka H. X-ray irradiation
induces thymidine phosphorylase and enhances the efficacy of capecitabine
(Xeloda) in human cancer xenografts. Clin Cancer Res. 1999;5:2948–53.
Sawada N, Ishikawa T, Fukase Y, Nishida M, Yoshikubo T, Ishitsuka H. Induction
of thymidine phosphorylase activity and enhancement of capecitabine efficacy
by taxol/taxotere in human cancer xenografts. Clin Cancer Res. 1998;4:1013–9.
Xiang S, Fruehauf J, Li CJ. Short hairpin RNA–expressing bacteria elicit RNA
interference in mammals. Nat Biotech. 2006;24:697–702.
Mohr L, Shankara S, Yoon SK, Krohne TU, Geissler M, Roberts B, et al. Gene
therapy of hepatocellular carcinoma in vitro and in vivo in nude mice by
adenoviral transfer of the Escherichia coli purine nucleoside phosphorylase
gene. Hepatology. 2000;31:606–14.
Sangro B, Mazzolini G, Ruiz M, Ruiz J, Quiroga J, Herrero I, et al. A phase I
clinical trial of thymidine kinase-based gene therapy in advanced
hepatocellular carcinoma. Cancer Gene Ther. 2010;17:837–43.
Yoshino T, Mizunuma N, Yamazaki K, Nishina T, Komatsu Y, Baba H, et al.
TAS-102 monotherapy for pretreated metastatic colorectal cancer:
a double-blind, randomised, placebo-controlled phase 2 trial. Lancet
Oncol. 2012;13:993–1001.
Sobrero A. TAS-102 in refractory colorectal cancer: caution is needed. Lancet
Oncol. 2012;13:959–60.
Emura T, Nakagawa F, Fujioka A, Ohshimo H, Kitazato K. Thymidine kinase
and thymidine phosphorylase level as the main predictive parameter for
sensitivity to TAS-102 in a mouse model. Oncol Rep. 2004;11:381–7.
Overman MJ, Varadhachary G, Kopetz S, Thomas MB, Fukushima M, Kuwata K,
et al. Phase 1 study of TAS-102 administered once daily on a 5-day-per-week
schedule in patients with solid tumors. Invest New Drugs. 2008;26:445–54.
Overman MJ, Kopetz S, Varadhachary G, Fukushima M, Kuwata K, Mita A, et al.
Phase I clinical study of three times a day oral administration of TAS-102
in patients with solid tumors. Cancer Invest. 2008;26:794–9.
Submit your next manuscript to BioMed Central
and take full advantage of:
• Convenient online submission
• Thorough peer review
• No space constraints or color figure charges
• Immediate publication on acceptance
• Inclusion in PubMed, CAS, Scopus and Google Scholar
• Research which is freely available for redistribution
Submit your manuscript at
www.biomedcentral.com/submit