A functional in vitro model of heterotypic interactions reveals a role for interferon-positive carcinoma associated fibroblasts in breast cancer
Bạn đang xem bản rút gọn của tài liệu. Xem và tải ngay bản đầy đủ của tài liệu tại đây (2.22 MB, 11 trang )
Hosein et al. BMC Cancer (2015) 15:130
DOI 10.1186/s12885-015-1117-0
RESEARCH ARTICLE
Open Access
A functional in vitro model of heterotypic
interactions reveals a role for interferon-positive
carcinoma associated fibroblasts in breast cancer
Abdel Nasser Hosein1,2, Julie Livingstone5, Marguerite Buchanan1, James F Reid6, Michael Hallett5
and Mark Basik1,3,4,7*
Abstract
Background: Cancer-associated fibroblasts (CAFs) play an important role in breast cancer pathogenesis by paracrine
regulation of breast cancer cell biology. Several in vitro and mouse models have characterized the role of cell contact
and cytokine molecules mediating this relationship, although few reports have used human CAFs from breast tumors.
Methods: Primary breast CAF cultures were established and gene expression profiles analysed in order to guide
subsequent co-culture models. We used a combination of colorimetric proliferation assays and gene expression
profiling to determine the effect of CAFs on the MCF-7 breast cancer cell in an indirect co-culture system.
Results: Using gene expression profiling, we found that a subgroup of breast CAFs are positive for a type one
interferon response, confirming previous reports of an activated type one interferon response in whole tumor datasets.
Interferon positive breast cancer patients show a poor prognostic outcome in an independent microarray dataset. In
addition, CAFs positive for the type one interferon response promoted the growth of the MCF-7 breast cancer cell line
in an indirect co-culture model. The addition of a neutralizing antibody against the ligand mediating the type one
response in fibroblasts, interferon-β, reverted this co-culture phenotype. CAFs not expressing the interferon response
genes also promoted the growth of the MCF-7 breast cancer cell line but this phenotype was independent of the type
one fibroblast interferon ligand.
Conclusions: Primary breast CAFs show inter-patient molecular heterogeneity as evidenced by interferon response
gene elements activated in a subgroup of CAFs, which result in paracrine pro-proliferative effects in a breast cancer cell
line co-culture model.
Keywords: Stroma, Carcinoma-associated fibroblasts, Breast cancer, Interferon
Background
Breast carcinoma is orchestrated by a complex series of
molecular events and biological processes involving the
contributions of several cell types [1,2]. Despite the fact
that most of our understanding of cancer centers on
those events taking place within the cancer epithelium,
the cancer-associated stroma also plays a co-dominant
role in shaping the biological and clinical fates of the
disease [3,4]. Specifically, the carcinoma-associated
* Correspondence:
1
Lady Davis Institute for Medical Research, Sir Mortimer B. Davis Jewish
General Hospital, Montreal, Canada
3
Department of Oncology, McGill University, Montreal, Canada
Full list of author information is available at the end of the article
fibroblast (CAF) has been shown to be a major player
in the stroma’s influence on tumor growth [5,6]. Many
reports have focused on the role that CAFs have in
regulating TGF-β signalling and angiogenesis through
secreted factors such as SDF-1 and VEGF [7-9]. CAFs
have shown the ability to both promote [10] and
repress [11] MCF-7 cell growth in vitro, in addition to
having no effect at all [12]. Importantly, none of these
studies took account of possible inter-patient CAF heterogeneity largely because, unlike tumor heterogeneity,
little data exists about inter-patient CAF heterogeneity.
In particular, one in vitro model using a series of
breast cancer cell lines directly co-cultured with normal
human fibroblasts demonstrated that human fibroblasts
© 2015 Hosein et al.; licensee BioMed Central. This is an Open Access article distributed under the terms of the Creative
Commons Attribution License ( which permits unrestricted use, distribution, and
reproduction in any medium, provided the original work is properly credited. The Creative Commons Public Domain
Dedication waiver ( applies to the data made available in this article,
unless otherwise stated.
Hosein et al. BMC Cancer (2015) 15:130
will induce a type-one interferon response when admixed
with tumorigenic breast cancer cell lines [13]. Furthermore, this type-one interferon response signature was
shown to be expressed in a large proportion of breast
tumors contained in the NKI breast tumor microarray
dataset [14] and its expression in whole breast tumors
was associated with a significantly poorer prognosis. In
addition, this outcome was confirmed in an independent
patient cohort in which immunohistochemical analysis of
phospho-STAT1 was used as a proxy for the presence of
the type-one interferon response.
In this report we show that there exists a subset of
CAFs which express a type one interferon response
which is stable upon ex vivo cultivation. This interferon
response can impart a paracrine growth-promoting effect on the MCF-7 breast cancer cell line. Our findings
suggest that an understanding of CAF molecular heterogeneity can be used to construct relevant preclinical
in vitro models of tumor-stromal interactions.
Methods
Tissue culture
Primary tissue culture was carried out as previously outlined [15]. Briefly, invasive breast carcinoma specimens
were surgically resected from patients at the Jewish
General Hospital (Montreal, Canada). CAFs were determined to be intratumoral by a certified pathologist.
Tissues were minced with a sterile blade and resuspended
in a solution of DMEM with 10% fetal bovine serum (FBS)
and 3% collagenase overnight at 37 degrees Celsius. The
next day samples were filtered through an 8 μm mesh in
order to remove undigested debris. The single cell suspension with viable fibroblasts was cultured in DMEM (10%
FBS) for 2–3 weeks in a 24 well plate and then transferred
to a T75 flask where it was continually maintained in a 2%
FBS medium solution. All fibroblasts were harvested
between passage doublings 3–5. Normal breast fibroblasts
from reduction mammoplasties were collected at the same
institution and in the same manner as the CAFs noted
above. All fibroblast cultures underwent immunocytochemical analyses for pan-cytokeratin and vimentin as
previously described by our group to confirm their mesenchymal identity [15]. All protocols involving human
tissues were approved by the Research Ethics Committee
of the Lady Davis Institute for Medical Research of McGill
University and were in compliance with the Helsinki
Declaration. Furthermore, all tissues procured from both
reduction mammoplasty and tumor resection surgeries
were obtained with the written informed consent of all
patients.
DNA microarray expression profiling
Gene expression profiling was carried out as described
previously [15]. Briefly, fibroblasts were harvested from
Page 2 of 11
subconfluent cultures, cultivated in DMEM with 2% FBS.
RNA was then extracted using the Mini RNA Extraction
kit (Qiagen, Venlo, Netherlands). Five micrograms of total
RNA was reversed transcribed with the Fairplay III
Microarray Labeling kit according to the instructions of
the manufacturer (Aglient Technologies, Santa Clara,
California). The resulting cDNA was then precipitated
with 70% ethanol, air-dried, resuspended in 5 μL of
coupling buffer, and dissolved at 37°C for 15 minutes.
Five microliters of Cy3 or Cy5 dye were added to the
universal reference (Aglient Technologies) or fibroblast
cDNA, respectively, and allowed to incorporate for
30 minutes at room temperature. Labeled cDNA was
cleaned-up using Fairplay columns (Aglient Technologies) according to the instructions of the manufacturer.
Labeled reference and fibroblast cDNA samples were
combined and mixed with gene expression hybridization
buffer and control targets supplied by the manufacturer
and hybridized to a 4 × 44 K two-color whole human
genome gene expression array for 17 hours at 65°C.
The array was then washed in a solution of 6× SSPE,
0.005% N-lauroylsarcosine followed by a solution of
0.06× SSPE, 0.005% lauroylsarcosine and scanned on
the Agilent DNA Microarray scanner at a resolution of
5 μm. All images were extracted and normalized with
Feature Extraction software version 9.5. The microarray
data from this study have been submitted to the NCBI
Gene Expression Omnibus (GEO) (.
nih.gov/geo) under accession number GSE29270.
Analysis of fibroblast and Co-culture expression
profiling data
Breast carcinoma derived fibroblasts were cultured and
expression profiled as outlined previously by our group
[15]. This dataset was analyzed using the straight-forward
approach demonstrated by Sorlie and colleagues [16]: any
gene that was two-fold above the median value for that
gene in at least 3 patient samples was retained. Unsupervised clustering (Pearson’s correlation) was then performed using TIGR MeV version 4.1. In the case of the
expression profiling on the MCF-7 breast cancer cell line,
the three conditions (see below) were compared in a supervised 2 × 2 × 2 manner using the SAM algorithm [17].
The samples were then clustered in the same way as the
unsupervised manner. This was also carried out by using
TIGR MeV version 4.1.
Interferon-β Enzyme Linked Immunosorbant Assay (ELISA)
Subconfluent fibroblast cultures were allowed to incubate in DMEM (2% FBS) for 48 hours at which time
the medium was collected and spun down for five
minutes at 1500 rpm in order to remove debris. An
ELISA assay was carried out as per the manufacturer’s
Hosein et al. BMC Cancer (2015) 15:130
instructions using the Human Interferon-β kit (R&D
Systems, Minneapolis, Minnesota).
In vitro co-culture model
All experiments were carried out in DMEM media
supplemented with 2% fetal bovine serum. 5000 MCF-7
cells (American Tissue Type Collection, Manassas,
Virginia) were plated into flat bottom 24-well plates and
allowed to adhere overnight. 600 μl of fresh media was
then added and a semi-permeable insert with a 0.4 μm
pore size (Millipore, Billerica, Massachusetts) was placed
over the media. 5000 fibroblasts were then seeded into
the insert, re-suspended in 400 μl of media for a total
co-culture volume of 1 ml/well. Monoclonal antibodies
(R&D Systems, Minneapolis, MN) were added at this
time if necessary. After co-cultures had incubated for
the appropriate time, inserts and fibroblasts were
removed and MTT reagent (Sigma-Aldrich, St. Louis,
Missouri) was added to the media (1:10 ratio) and
allowed to incubate for 2 hours after which the media
was aspirated and 1 ml of DMSO was added. The absorbance was measured at 570 nm. For RNA or protein
harvesting, co-cultures were performed in 6-well dishes
with appropriate transwell insert (Millipore) using 25,000
of each cell type in a total co-culture volume of 4 ml. After
the appropriate co-incubation time, cells were snap frozen
in liquid nitrogen for RNA harvesting.
Quantitative Reverse Transcription Polymerase Chain
Reaction (Q-RT-PCR)
Five micrograms of total RNA was reverse transcribed
using Stratagene’s AffinityScript Multiple Temperature
cDNA Synthesis Kit (Agilent Technologies) according to
the manufacturer’s instructions. 1 μl of oligo(dT) primer
was added to 5ug of total RNA and allowed to incubate
at 65°C for five minutes. The reaction was subsequently
cooled to room temperature. The following reactants
were then added for a total volume of 20 μl : 2.0 μl of
10× AffinityScript RT Buffer, 0.8 μl of dNTP mix
(25 mM of each dNTP), 0.5 μl of RNase Block Ribonuclease Inhibitor (40 U/μl) and 1 μl of reverse transcriptase. The reaction was carried out at 42°C for one
hour and terminated by a 15 minute incubation at 70°C.
The parameters for the interferon-associated Q-RT-PCR
were adapted from Buess et al. [13]. PCR reactions were
carried out in a final volume of 10 μl. Two micrograms
of synthesized cDNA, 5 μl of 2× SYBR ®Green PCR
Master Mix (ABI, Foster City, CA, USA) and 1 μl
(10 μM ) of each primer (sequences: OAS2, forward
GGAATACCTGAAGCCCTACGAA, reverse CCTGC
AGACGTCACAGATGGT; IFNβ, forward ACCTCCG
AAACTGAAGATCTCCTA, reverse TGCTGGTTGA
AGAATGCTTGA; GAPDH, forward GAAGGTGAAGG
TCGGAGTC, reverse GAAGATGGTGATGGGATTTC).
Page 3 of 11
Primers were purchased from Invitrogen (Carlsbad,
California) and adapted from Buess et al. All reactions
were carried out in an ABI 7700 Sequence Detection
System using the following amplification conditions: 50°C
for 2 minutes, 94°C for 10 minutes, followed by 40 cycles
of 94°C for 15 s and 60°C for 60 seconds. All reactions
were carried out in triplicate.
NKI295 database analysis
Patients were split into high and low expressers of our
IFN signature by hierarchical clustering. Hierarchical
clustering was performed using Euclidean and Ward’s
algorithm. A univariate Kaplan Meier analysis was then
carried out in order to assess the prognostic significance
of the IFN signature. Secondly, patients in the NKI patient cohort were split into two groups (high and low)
based on their expression of S100A2 using hierarchical
clustering. The low and high S100A2 expresser groups
were separately clustered with the IFN signature. Kaplan
Meier curves were subsequently generated.
Results
Gene expression profiling reveals the presence of a CAF
subtype that is positive for a type one interferon
response
We carried out gene expression profiling of primary breast
CAFs. This dataset consisted of 23 patient-derived CAFs
that were cultured for a minimum of 3 doublings and a
maximum of 6 doublings in low serum conditions. In
these analyses the data were filtered for the most variably
expressed genes [16,18]; any gene that was 2-fold above
or below the mean for that gene in at least 3 of the 23
samples was retained. This strategy yielded a filtered list of
2506 genes. Upon hierarchical clustering the CAF cohort was clearly subdivided into two distinct groups
(Figure 1A). Upon closer inspection it was evident that
a group of 5 CAFs (T35, T63, T38, T44, T65) clustered
tightly together and that this pattern was largely due to the
overexpression of a coordinated gene cluster (Figure 1B).
This expression block consisted of 101 genes and has
members such as MX1, MX2, OAS1, OAS2, IFI27 and
IFI30 greatly overexpressed within it, compared to the
other CAFs, strongly suggesting that it represents an activated type one interferon response pattern. The type one
interferon mediators were present in addition to several
cytokine and chemokine transcripts (Figure 1B). Quantitative RT-PCR analysis of two key interferon response
genes, MX1 and OAS2, validated microarray gene expression results (Additional file 1: Figure S1) showing significantly higher expression levels in CAFs found within the
activated interferon response cluster. In addition, Q-RTPCR analysis of the IFN-β gene was correlated with RNA
expression of MX1, suggesting that this particular type
one interferon response was likely due to interferon-β
Hosein et al. BMC Cancer (2015) 15:130
Figure 1 (See legend on next page.)
Page 4 of 11
Hosein et al. BMC Cancer (2015) 15:130
Page 5 of 11
(See figure on previous page.)
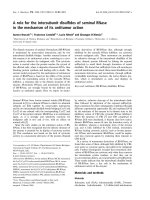
Figure 1 Hierarchical clustering of CAFs reveals interferon positive CAF subset. (A) Hierarchical clustering (HCL) of the 23 CAFs. DNA
microarray data were filtered for genes that were 2-fold above or below the mean for that gene in a minimum of 3 samples. This resulted in a
total of 2506 genes which are shown clustered above. (B) Magnification of the gene cluster highlighted by the red bar in Figure 1A. Further
inspection of this cluster shows the upregulation of many type-one interferon genes in addition to a host of cytokines in five of the CAFs analyzed.
(C) An IFN-β ELISA of DMEM (2% FBS) cultured with sub-confluent fibroblasts (3 normal breast fibroblast, 3 IFN-negative CAFs and 3 IFN-positive CAFs)
for 48 hours. IFN-β ligand was only detected in the 3 IFN-positive CAF supernatents. (D) Q-RT-PCR analysis on frozen whole tumor sections
corresponding to two IFN-positive and two IFN-negative CAFs. The IFN-positive CAFs (T35 and T44) showed a greatly increased level of both
IFN markers IFN-β and OAS2 relative to the IFN-negative tumors (T77 and T79) (p < 0.001, by way of Bonferroni Multiple comparison test
following a one-way ANOVA).
(IFN-β) ligand expression (Additional file 2: Figure S2).
Specifically, by Q-PCR, the five highest expressers of
IFN-b were T65, T63, T73, T44, T38 which had an average MX1/GAPDH QPCR ratio of 3.19 versus a ratio of
0.05 in the rest of the cohort (p = 0.005). Four of these
five CAFs grouped closely in the microarray clustering
data with the one that did not (T73CAF) still showing
positivity for much of the IFN gene expression cluster
(Figure 1). Next, by way of ELISA, we confirmed the
presence of the IFN-β ligand in the tissue culture supernatants of activated IFN-response CAFs and lack of the
ligand in normal breast fibroblasts and IFN-negative
CAFs (Figure 1C). We then found that RNA extracted
from two whole tumor sections whose CAFs were deemed
negative for the type one interferon response via microarray and Q-RT-PCR analyses, showed considerably lower
levels of both IFN-β and OAS2 as compared to whole
tumors from two patients from whom activated interferon
response CAFs were obtained (Figure 1D). These findings
suggest that the interferon response we observed in our
CAFs was unlikely due to an ex vivo tissue culture artefact.
Finally, we used our 101 gene CAF-derived cytokineenriched interferon signature to interrogate the NKI295
breast cancer microarray dataset (Figure 2). Consistent
with Buess et al’s findings, our cytokine enriched interferon signature was deemed to be over expressed in 154
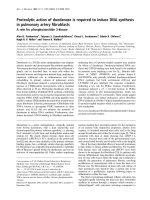
Figure 2 Interrogation of the NKI295 breast cancer microarray dataset for the clinical significance of the IFN signature shown in Figure 1.
(A) the IFN signature was able to divide the cohort into two groups; one consisting of 154 patients (high IFN expressers) and the second
consisting of 141 patients (low IFN expressers). Bars at the bottom of the figure indicate various histopathological characteristics of the tumors/
patients whose microarray data appear in the corresponding column. ‘Outcome’: red denotes recurrence, white denotes no recurrence. ‘Grade’
refers to the histological grade of the breast carcinoma: red is grade 3, pink is grade 2 and white is grade 1. ‘Lymph node’: red indicates that the
patient has axillary lymph node dissemination of the breast carcinoma, whereas white is negative for lymph node dissemination. ‘HER2’: orange
indicates that the patient’s carcinoma was positive for HER2 over-expression, and white indicates negativity. ‘ER’: green indicates estrogen
positive disease and white indicates estrogen receptor negative disease. ‘Interferon’: red are patients who cluster in the interferon positive
group and blue are patients who do not overexpress the interferon cluster of genes. ‘Wound’: red denotes patients who are positive for the
wound response signature of Chang et al. [19] and blue are those that do not overexpress the wound response. (B) These two distinct groups
had a significantly different outcome with the high expressers of IFN displaying a greater rate of recurrence than the low IFN expressers.
Hosein et al. BMC Cancer (2015) 15:130
of the 295 patients and patients with tumors showing such
over-expession showed a worse outcome than those with
tumors that fell into the interferon negative group (hazard
ratio = 0.56, p = 0.0037).
Carcinoma-associated fibroblasts impart pro-cancer
effects on the MCF-7 breast cancer cell line in an indirect
heterotypic co-culture system
In order to test the effects of IFN-positive CAFs on the
growth of breast cancer cells we developed an in vitro
co-culture model in which fibroblasts were indirectly
co-cultured with the MCF-7 breast cancer cell line for
120 hours. The fibroblasts and MCF-7 cells were separated by a semi-permeable membrane (pore size of
0.4 μm) with the MCF-7 cells being cultured on the
bottom layer. At the desired time point, the transwell
insert containing the fibroblasts was discarded and the
MCF-7 s were either assayed by way of the MTT cell
viability reagent or harvested for RNA and/or protein.
Fibroblasts from three of each type of patient (IFNnegative, IFN-positive and normal reduction mammoplasty) were co-cultured with the breast cancer cell
line. We found that co-culturing CAFs with MCF-7
Page 6 of 11
breast cancer cells increased the proliferation rate of the
latter, unlike co-culturing with normal breast fibroblasts
(NBF) (Figure 3). Interestingly, one of the IFN-negative
CAFs (T48CAF) was not capable of promoting MCF-7
proliferation, while the other two IFN-negative CAFs
increased MCF-7 cell proliferation to an equal or greater
degree as compared to the three IFN-positive CAFs.
The pro-MCF-7 effects by IFN-positive CAFs are dependent
on the continued action of the IFN-β ligand whereas this is
not a requirement for the pro-MCF-7 effects of the
IFN-negative CAFs
To determine if the type-one interferon response in
CAFs is responsible for their ability to promote MCF-7
growth, we repeated the co-culture proliferation assays
in the presence of a neutralizing monoclonal antibody
against the IFN-β ligand in the co-culture medium
(Figure 4). When IFN-β antibody was added to the culture medium, all 3 co-cultures involving the IFN-positive
CAFs demonstrated a significant reversion of the phenotype, to proliferation levels very near that of MCF-7 cells
cultured in the absence of CAFs. Thus the proproliferative effect on MCF-7 cells of the IFN-positive
Figure 3 MCF-7-CAF co-culture phenotype. Three types of fibroblasts were involved in co-cultures with the MCF-7 breast cancer cell line. Normal breast fibrobasts are denoted in green, IFN-negative CAFs in blue and IFN-positive CAFs in red. All experiments were performed in triplicate.
A single 120 hour time point is shown. Statistical differences were ascertained by an analysis of variance. Double asterisks represent samples that
were deemed to be significantly different (p < 0.01) from the MCF-7 grown in mono-culture (post-hoc test: Dunnett’s multiple comparison test).
Five of six CAFs showed significant growth promotion of the MCF-7 breast cancer cell line in this model.
Hosein et al. BMC Cancer (2015) 15:130
Page 7 of 11
Figure 4 IFN-β is responsible for the positive effect of IFN-positive CAFs on MCF-7 proliferation. Three IFN-positive CAFs, T38, T44, T65,
were co-cultured as previously described. In this experiment, two new conditions where added: once triplicate for each day was reserved for the
addition of 20 μg of an IgG1 isotype control antibody (second darkest shade) and another for 20 μg of neutralizing IFN-β antibody (darkest
shade). A Bonferonni multiple comparison test was carried out after a one-way ANOVA was performed on the four conditions at 120 hours. The
asterisks represent the significant difference between the co-culture with the IgG isotype control and the co-culture with the neutralizing IFN-β
antibody (*, p < 0.05; ***, p < 0.001).
CAFs is dependent on the presence of IFN-β. Of note,
the addition of the anti-IFN-β antibody did not result
in reversal of growth promoting effects in co-cultures
with IFN-negative CAFs (Additional file 3: Figure S3).
Microarray analysis of the IFN-positive-CAF-MCF-7
co-cultures reveals the presence of the candidate
tumor suppressor gene S100A2 as a putative
mediator of the pro-cancer heterotypic phenotype
In order to gain a greater understanding of the molecular mediator(s) of the pro-proliferative effects of the
IFN-positive CAFs, we carried out gene expression profiling of the MCF-7 breast cancer cell line under various
co-culture and mono-culture conditions. The MCF-7
breast cancer cell line was grown alone or co-cultured
with the IFN-positive CAFs T38 and T44, in the presence of IgG1 or neutralizing IFN-β monoclonal antibodies for 72 hours at which point RNA was harvested
from the breast cancer cell line. We carried out a supervised clustering approach comparing three different
groups of samples in a 2x2x2 study design; MCF-7
breast cancer cell line with IgG1 isotype control antibody, MCF-7 co-cultured with the two IFN-positive
CAFs and the IgG1 antibody and lastly, MCF-7 cocultured with the two IFN-positive CAFs and treated with
the IFN-β neutralizing antibody. There were a total of 995
differentially expressed genes when a false discovery rate
of 5% was applied to the SAM analysis (Figure 5A). Notably, the overwhelming majority of differentially expressed
genes were between mono-culture and co-culture conditions. There was however a group of genes that was significantly down-regulated under co-culture conditions but
reverted back to higher expression levels when the IFN-β
neutralizing antibody was added to the co-culture. This
group consisted of 19 transcripts of which 12 were annotated genes. Given that the lower expression of these
genes correlated with the pro-growth phenotype (Figures 4
and 5A) we reasoned that any putative effector gene in
this cluster should function in a tumor-suppressor-like
manner if it is to modulate the phenotype we observed.
Hosein et al. BMC Cancer (2015) 15:130
Figure 5 (See legend on next page.)
Page 8 of 11
Hosein et al. BMC Cancer (2015) 15:130
Page 9 of 11
(See figure on previous page.)
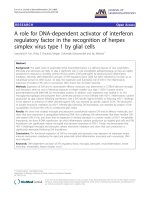
Figure 5 Gene expression analysis shows that S100A2 expression in MCF-7 cells is modulated by the activity of IFN-positive CAFs. (A)
A 2 × 2 × 2 SAM analysis was carried out to compare MCF-7 s under three different conditions: MCF-7 monocultured with only the IgG1 antibody,
MCF-7 co-cultured with two IFN-positive CAFs and the IgG1 antibody, and MCF-7 co-cultured with the same two IFN-positive CAFs in addition to
the neutralizing IFN-β monoclonal antibody. 995 modulated genes and corresponding clustering are displayed. (B) The 19 transcripts that are
significantly different between the second condition and both the first and third conditions are magnified. S100A2 (red arrow) is highlighted.
(C) S100A2’s differential mRNA expression was confirmed by Q-RT-PCR. An ANOVA analysis followed by a Bonferonni multiple comparison test
was performed to show that S100A2 expression rose when the IFN-β neutralizing antibody was added to the IFN-positive co-culture. (D) The
Kaplan Meir analysis on the NKI295 cohort when S100A2 expression is low (left) shows that IFN-positive patients (red) have a significantly shorter
survival duration when compared to IFN-negative (blue) patients. Conversely, when S100A2 expression is high (plot on right), the IFN-positive and
negative groups have statistically indistinguishable survival profiles.
One of these genes , S100A2, had already been identified
as a putative tumor suppressor in breast as well as in other
types of cancers [20,21]. These microarray finds were
confirmed by way of Q-RT-PCR (Figure 5C). We then
interrogated the NKI295 database in order to evaluate the
S100A2 gene as a univariate predictor; there was no correlation between outcome and expression levels (data not
shown). Next, we separated the entire cohort into the respective high and low expressers of S100A2 according to
the median values of S100A2 expression, and recalculated
the Kaplan-Meir curves based on our interferon signature.
In the low S100A2 group (Figure 5D, left), the high and
low IFN expressers were split precisely in half (n = 88 in
each group), with the high expressers of the IFN signature
showing a poorer prognostic outcome as compared to the
low expressers (HR = 0.54, p = 0.023), consistent with our
previous analyses. However, when S100A2 was relatively
overexpressed this poor outcome associated with the
interferon response was not observed, with the high and
low expressers of the interferon signature showing a
statistically indistinguishable survival outcome (Figure 5D,
right). In addition, regarding the molecular subtypes of
breast cancers in the NKI295 database, the basal and
HER2 positive subtypes carry a significantly increased
proportion of IFN positive patients versus the other
three classical subtypes (chi squared = 82.8539, df = 4,
p-value < 2.2e-16). Interestingly, even after segregating
the cohort based on IFN status, which enriches for
HER2 and basal poor outcome patients, S100A2 status
is still able to demonstrate survival differences in the
cohort (Figure 5D). Additional file 4: Figure S4 shows
the overlap in molecular subtype, IFN status and
S100A2 status in the NKI295 cohort. These above analyses
are consistent with our in vitro findings (Figure 5A and B)
suggesting that lower S100A2 expression is associated
with the pro-tumorigenic effects of the type one interferon
response within the breast cancer microenvironment.
Discussion
The tumor microenvironment has been recognized as a
major player in the development and progression of
solid tumors, including breast cancer. Recently, targeting
immune cells within the tumor microenvironment has
led to spectacular successes in the treatment of melanomas [22,23]. The role of interferons in modulating the
immune response to viruses is well known, but the role
of interferons in modulating the immune response to
tumors is less well defined. Early experimental models
have uncovered potent direct cytotoxic and/or antiproliferative effects of interferons [24-27], although the
translation of these findings into their use as anti-cancer
therapeutics [28-30] has been met with only limited success in breast cancer [30] and other carcinomas [31]. In
fact, there were even early indications that the administration of IFN-β to cancer patients could lead to an
increase in the number of hormone receptors in the cancerous tissue [32]. More recently, the presence of aberrantly expressed IFN-related genes in cancer were first
noticed in the initial molecular portraits of breast cancer
[18]. Later an IFN signature was observed in several human cancers; 15% of childhood lymphoblastic leukemias,
20% of ovarian and 40% of breast cancers were positive
for an IFN-related signature [33].
In the current study we have shown that a subset of
breast CAFs (5 of 23 tested CAFs) strongly expresses a
type one interferon response and that this response,
chiefly through the IFN-β cytokine, can impart a proproliferative effect on MCF-7 breast cancer cells in vitro.
It should be noted that direct fibroblast-breast cancer
cell line contact was necessary when the interferon
response was previously induced artificially in vitro [13].
We show that an interferon response is identifiable even
after ex-vivo culturing in some CAFs grown alone, and
that its pro-proliferative effect on co-cultured breast
cancer cells is mediated through the action of soluble
IFN-β ligand. Our IFN response can be detected in
whole breast tumors as an expression signature conveying
poor prognosis. Additionally, we showed that S100A2 is a
candidate mediator of the IFN response’s effect on patient
outcome. S100A2 is a calcium binding protein that has
been repeatedly shown to be down regulated in a variety
of cancers such as breast [34], and prostate [35] and is
considered to be a candidate tumor suppressor gene.
In light of recent findings that interferon positivity
correlates with a poor clinical outcome in breast cancer
[13], it is probable that interferons may actually be
Hosein et al. BMC Cancer (2015) 15:130
pro-tumorigenic, as suggested also by our findings.
Type one interferon signaling has also been correlated
with resistance to doxorubicin and topoisomerase-II
inhibitors in vitro [36] and confer resistance to DNA
damage in cancer cell lines [37]. Taken together, this
would suggest that type one interferon neutralization
within the tumor microenvironment should be pursued in lieu of their supplementation at least in cases
in which interferon signalling is active and detectable
in the tumor microenvironment [6]. Moreover, on
close inspection of the interferon response gene set we
have identified there are many cytokines present (CXCL1,
CXCL2, CXCL6, CXCL10, CXCL11, IL6, IL8, CSF2,
CCL11), any one of which could be mediating the phenotype seen herein.
Conclusion
We have identified a subset of CAFs and perhaps breast
tumors, which may be particularly vulnerable to such
therapeutic approaches. These data will need to be
further expanded to include in vivo models of human
CAFs co-implanted with breast cancer cell lines. Taken
together, these results provide a better understanding of
the potential value of targeted anti-IFN-β therapy in
breast cancer patients whose tumors show a gene
expression profile reflecting a type-one IFN response.
Protein biomarkers such as S100A2, OAS2 and/or IFNβ
RNA expression in breast tumors may prove to be useful
guides in predicting the response of IFN-positive patients
to anti-interferon therapeutics.
Additional files
Additional file 1: Figure S1. Q-RT-PCR corroboration of the type-one
interferon signature revealed by way of microarray analysis. Microarray
values for the genes MX1 (left) and OAS2 (right) are shown to significantly
correlate with Q-RT-PCR values with R2 values of 0.825 and 0.445
respectively.
Additional file 2: Figure S2. Q-RT-PCR analysis of fibroblast interferon
(IFN-β) versus the MX1 Q-RT-PCR values indicating a significant role of
IFN-β in this interferon response.
Additional file 3: Figure S3. All three IFN-negative CAFs’ were
co-cultured in the presence of the IFN-β neutralizing antibody and a
decrease in MCF-7 proliferation was not observed. A single time point
(120 hours) is shown and all co-culture conditions are compared to the
MCF-7 mono-culture absorbance readings.
Additional file 4: Figure S4. Overlap between S100A2, IFN status and
molecular subtype of breast cancer in the NKI295 database. Black
denotes positivity for S100A2 and IFN status. Regarding molecular
subtype: dark blue: luminal A, light blue: luminal B, red: basal, pink: her2,
green: normal-like. See results section for further commentary.
Competing interests
The authors declare that they have no competing interests.
Authors’ contributions
ANH: Conceived this study, designed and carried out experiments, analysed
data and wrote the manuscript. JL: carried out bioinformatic analyses. MB:
carried out the ex vivo culturing of the carcinoma-associated fibroblasts. JFR:
Page 10 of 11
carried out bioinformatic analyses. MH: supervised bioinformatic analyses.
MB: Conceived this study, designed experiments, analysed data and wrote
the manuscript. All authors read and approved the final manuscript.
Acknowledgments
We would like to thank the FRQS Reseau de Recherche sur le Cancer and
the Jewish General Hospital Foundation-Weekend to End Breast Cancer Fund
for their generous funding of this work.
Author details
Lady Davis Institute for Medical Research, Sir Mortimer B. Davis Jewish
General Hospital, Montreal, Canada. 2Department of Pharmacology &
Therapeutics, McGill University, Montreal, Canada. 3Department of Oncology,
McGill University, Montreal, Canada. 4Department of Surgery, McGill
University, Montreal, Canada. 5McGill Centre for Bioinformatics, Montreal,
Canada. 6Fondazione IFOM Istituto FIRC di Oncologia Molecolare, Milan, Italy.
7
Department of Oncology, Lady Davis Institute, 3755 Cote Ste Catherine,
Montreal, QC H3T1E2, Canada.
1
Received: 27 May 2014 Accepted: 23 February 2015
References
1. Hanahan D, Weinberg RA. The hallmarks of cancer. Cell. 2000;100(1):57–70.
2. Hanahan D, Weinberg RA. Hallmarks of cancer: the next generation. Cell.
2011;144(5):646–74.
3. Finak G, Bertos N, Pepin F, Sadekova S, Souleimanova M, Zhao H, et al.
Stromal gene expression predicts clinical outcome in breast cancer. Nat
Med. 2008;14(5):518–27.
4. Farmer P, Bonnefoi H, Anderle P, Cameron D, Wirapati P, Becette V, et al. A
stroma-related gene signature predicts resistance to neoadjuvant
chemotherapy in breast cancer. Nat Med. 2009;15(1):68–74.
5. Kalluri R, Zeisberg M. Fibroblasts in cancer. Nat Rev Cancer. 2006;6(5):392–401.
6. Madar S, Harel E, Goldstein I, Stein Y, Kogan-Sakin I, Kamer I, et al. Mutant
p53 attenuates the anti-tumorigenic activity of fibroblasts-secreted
interferon beta. PLoS One. 2013;8(4):e61353.
7. Bhowmick NA, Chytil A, Plieth D, Gorska AE, Dumont N, Shappell S, et al.
TGF-beta signaling in fibroblasts modulates the oncogenic potential of
adjacent epithelia. Science. 2004;303(5659):848–51.
8. Orimo A, Gupta PB, Sgroi DC, Arenzana-Seisdedos F, Delaunay T, Naeem R,
et al. Stromal fibroblasts present in invasive human breast carcinomas
promote tumor growth and angiogenesis through elevated SDF-1/CXCL12
secretion. Cell. 2005;121(3):335–48.
9. Kojima Y, Acar A, Eaton EN, Mellody KT, Scheel C, Ben-Porath I, et al.
Autocrine TGF-beta and stromal cell-derived factor-1 (SDF-1) signaling
drives the evolution of tumor-promoting mammary stromal myofibroblasts.
Proc Natl Acad Sci U S A. 2010;107(46):20009–14.
10. Adams EF, Newton CJ, Braunsberg H, Shaikh N, Ghilchik M, James VH.
Effects of human breast fibroblasts on growth and 17 beta-estradiol
dehydrogenase activity of MCF-7 cells in culture. Breast Cancer Res Treat.
1988;11(2):165–72.
11. van Roozendaal KE, Klijn JG, van Ooijen B, Claassen C, Eggermont AM,
Henzen-Logmans SC, et al. Differential regulation of breast tumor cell
proliferation by stromal fibroblasts of various breast tissue sources.
Int J Cancer. 1996;65(1):120–5.
12. Dong-Le Bourhis X, Berthois Y, Millot G, Degeorges A, Sylvi M, Martin PM,
et al. Effect of stromal and epithelial cells derived from normal and
tumorous breast tissue on the proliferation of human breast cancer cell
lines in co-culture. Int J Cancer. 1997;71(1):42–8.
13. Buess M, Nuyten DS, Hastie T, Nielsen T, Pesich R, Brown PO.
Characterization of heterotypic interaction effects in vitro to deconvolute
global gene expression profiles in cancer. Genome Biol. 2007;8(9):R191.
14. van de Vijver MJ, He YD, van’t Veer LJ, Dai H, Hart AA, Voskuil DW, et al. A
gene-expression signature as a predictor of survival in breast cancer. N Engl
J Med. 2002;347(25):1999–2009.
15. Hosein AN, Wu M, Arcand SL, Lavallee S, Hebert J, Tonin PN, et al. Breast
carcinoma-associated fibroblasts rarely contain p53 mutations or chromosomal
aberrations. Cancer Res. 2010;70(14):5770–7.
16. Sorlie T, Tibshirani R, Parker J, Hastie T, Marron JS, Nobel A, et al. Repeated
observation of breast tumor subtypes in independent gene expression data
sets. Proc Natl Acad Sci U S A. 2003;100(14):8418–23.
Hosein et al. BMC Cancer (2015) 15:130
17. Tusher VG, Tibshirani R, Chu G. Significance analysis of microarrays applied
to the ionizing radiation response. Proc Natl Acad Sci U S A.
2001;98(9):5116–21.
18. Perou CM, Sorlie T, Eisen MB, van de Rijn M, Jeffrey SS, Rees CA, et al. Molecular
portraits of human breast tumours. Nature. 2000;406(6797):747–52.
19. Chang HY, Sneddon JB, Alizadeh AA, Sood R, West RB, Montgomery K, et al.
Gene expression signature of fibroblast serum response predicts human
cancer progression: similarities between tumors and wounds. PLoS Biol.
2004;2(2):E7.
20. Lee SW, Tomasetto C, Swisshelm K, Keyomarsi K, Sager R. Down-regulation
of a member of the S100 gene family in mammary carcinoma cells and
reexpression by azadeoxycytidine treatment. Proc Natl Acad Sci U S A.
1992;89(6):2504–8.
21. Liu D, Rudland PS, Sibson DR, Platt-Higgins A, Barraclough R. Expression of
calcium-binding protein S100A2 in breast lesions. Br J Cancer.
2000;83(11):1473–9.
22. Hodi FS, O’Day SJ, McDermott DF, Weber RW, Sosman JA, Haanen JB, et al.
Improved survival with ipilimumab in patients with metastatic melanoma. N
Engl J Med. 2010;363(8):711–23.
23. Weber JS, Kudchadkar RR, Yu B, Gallenstein D, Horak CE, Inzunza HD, et al.
Safety, efficacy, and biomarkers of nivolumab with vaccine in
ipilimumab-refractory or -naive melanoma. J Clin Oncol.
2013;31(34):4311–8.
24. Song MM, Shuai K. The suppressor of cytokine signaling (SOCS) 1 and
SOCS3 but not SOCS2 proteins inhibit interferon-mediated antiviral and
antiproliferative activities. J Biol Chem. 1998;273(52):35056–62.
25. Demers GW, Johnson DE, Machemer T, Looper LD, Batinica A, Beltran JC,
et al. Tumor growth inhibition by interferon-alpha using PEGylated protein
or adenovirus gene transfer with constitutive or regulated expression. Mol
Ther. 2002;6(1):50–6.
26. Endou M, Mizuno M, Nagata T, Tsukada K, Nakahara N, Tsuno T, et al. Growth
inhibition of human pancreatic cancer cells by human interferon-beta gene
combined with gemcitabine. Int J Mol Med. 2005;15(2):277–83.
27. Ozzello L, Habif DV, DeRosa CM. Antiproliferative effects of natural interferon
beta alone and in combination with natural interferon gamma on human
breast carcinomas in nude mice. Breast Cancer Res Treat. 1990;16(2):89–96.
28. Sikora K. Does interferon cure cancer? Br Med J. 1980;281(6244):855–8.
29. Borden EC, Balkwill FR. Preclinical and clinical studies of interferons and
interferon inducers in breast cancer. Cancer. 1984;53(3 Suppl):783–9.
30. Macheledt JE, Buzdar AU, Hortobagyi GN, Frye DK, Gutterman JU, Holmes
FA. Phase II evaluation of interferon added to tamoxifen in the treatment of
metastatic breast cancer. Breast Cancer Res Treat. 1991;18(3):165–70.
31. Bulbul MA, Huben RP, Murphy GP. Interferon-beta treatment of metastatic
prostate cancer. J Surg Oncol. 1986;33(4):231–3.
32. Pouillart P, Palangie T, Jouve M, Garcia-Giralt E, Fridman WH, Magdelenat H,
et al. Administration of fibroblast interferon to patients with advanced
breast cancer: possible effects on skin metastasis and on hormone
receptors. Eur J Cancer Clin Oncol. 1982;18(10):929–35.
33. Einav U, Tabach Y, Getz G, Yitzhaky A, Ozbek U, Amariglio N, et al. Gene
expression analysis reveals a strong signature of an interferon-induced
pathway in childhood lymphoblastic leukemia as well as in breast and
ovarian cancer. Oncogene. 2005;24(42):6367–75.
34. Ilg EC, Schafer BW, Heizmann CW. Expression pattern of S100 calcium-binding
proteins in human tumors. Int J Cancer. 1996;68(3):325–32.
35. Gupta S, Hussain T, MacLennan GT, Fu P, Patel J, Mukhtar H. Differential
expression of S100A2 and S100A4 during progression of human prostate
adenocarcinoma. J Clin Oncol. 2003;21(1):106–12.
36. Rickardson L, Fryknas M, Dhar S, Lovborg H, Gullbo J, Rydaker M, et al.
Identification of molecular mechanisms for cellular drug resistance by
combining drug activity and gene expression profiles. Br J Cancer.
2005;93(4):483–92.
37. Cheon H, Holvey-Bates EG, Schoggins JW, Forster S, Hertzog P, Imanaka N,
et al. IFNbeta-dependent increases in STAT1, STAT2, and IRF9 mediate
resistance to viruses and DNA damage. EMBO J. 2013;32(20):2751–63.
Page 11 of 11
Submit your next manuscript to BioMed Central
and take full advantage of:
• Convenient online submission
• Thorough peer review
• No space constraints or color figure charges
• Immediate publication on acceptance
• Inclusion in PubMed, CAS, Scopus and Google Scholar
• Research which is freely available for redistribution
Submit your manuscript at
www.biomedcentral.com/submit