The prognostic value of combined TGF-β1 and ELF in hepatocellular carcinoma
Bạn đang xem bản rút gọn của tài liệu. Xem và tải ngay bản đầy đủ của tài liệu tại đây (807.02 KB, 11 trang )
Ji et al. BMC Cancer (2015) 15:116
DOI 10.1186/s12885-015-1127-y
RESEARCH ARTICLE
Open Access
The prognostic value of combined TGF-β1 and
ELF in hepatocellular carcinoma
Fei Ji1†, Shun-Jun Fu2†, Shun-Li Shen3, Long-Juan Zhang4, Qing-Hua Cao5, Shao-Qiang Li3, Bao-Gang Peng3,
Li-Jian Liang3 and Yun-Peng Hua3*
Abstract
Background: Tumor suppression of Transforming Growth Factor (TGF-β) signaling pathway requires an adaptor
protein, Embryonic Liver Fodrin (ELF). Disruption of ELF expression resulted in miscolocalization of Smad3 and
Smad4, then disruption of TGF-β signaling. However, the prognostic significance of ELF for hepatocellular carcinoma
(HCC) hasn’t been clarified. This study aimed to investigate whether measuring both TGF-β1 and ELF provides a
more powerful predictor for HCC prognosis than either marker alone.
Methods: TGF-β1 and ELF protein were detected by immunohistochemistry. The relationship between TGF-β1/ELF
expression and patients’ clinicopathologic factors was analyzed. The association between TGF-β1/ELF expression
and disease-free survival and overall survival was analyzed by Kaplan-Meier curves, the log-rank test, and Multivariate
Cox regression analyses.
Results: The expression of TGF-β1 in HCC tissues was significantly higher than that in normal liver tissues. Conversely,
the expression of ELF in HCC tissues declined markedly. ELF protein was correlated with HBsAg, tumor size, tumor
number, TNM and recurrence. Data also indicated a significant negative correlation between ELF and TGF-β1. Patients
with high TGF-β1 expression or/and low ELF expression appeared to have a poor postoperative disease-free survival
and overall survival compared with those with low TGF-β1 expression or/and high ELF expression. Furthermore, the
predictive range of ELF combined with TGF-β1 was more sensitive than that of either one alone.
Conclusions: TGF-β1 and ELF protein are potential and reliable biomarkers for predicting prognosis in HCC patients
after hepatic resection. Our current study has demonstrated that the prognostic accuracy of testing can be enhanced
by their combination.
Keywords: Transforming growth factor, Embryonic liver fodrin, Hepatocellular carcinoma, Prognosis, Biomarkers
Background
Hepatocellular cancer (HCC) is one of the most
common, aggressive malignancies, the third leading
cause of cancer-related deaths worldwide (World Health
Organization Report, 2006) [1-3]. Although surgical resection, percutaneous ablation and liver transplantation
are considered as the curative treatments for HCC, the
long-term prognosis of patients undergoing potentially
curative treatments is still poor. Fully 60% to 70% of patients develop recurrence or metastasis within 5 years
after resection [4,5]. It is therefore a very important and
* Correspondence:
†
Equal contributors
3
Department of Liver Surgery, the First Affiliated Hospital, Sun Yat-sen
University, Guangzhou 510080, P. R. China
Full list of author information is available at the end of the article
urgent task to find an effective biomarker to identify patients with a high risk of recurrence or metastases, and
provide personalized therapy according to the predicted
risk of recurrence.
The transforming growth factor β (TGF-β) signaling
pathway is known to play an important role in multiple
cellular processes, including cell growth, differentiation,
adhesion, migration, apoptosis, extracellular matrix formation and immunosuppressant [6-9]. TGF-β signals are
conveyed from type I and type II transmembrane serine/
threonine kinase receptors to the intracellular mediatorsSmad2 and Smad3, which further complex with Smad4,
translocate to the nucleus and bind to Smad-binding elements (SBE) in target gene promoters, thereby activating
its targets, such as p21, p15, p16, p27 [10-14]. TGF-β is
© 2015 Ji et al.; licensee BioMed Central. This is an Open Access article distributed under the terms of the Creative Commons
Attribution License ( which permits unrestricted use, distribution, and
reproduction in any medium, provided the original work is properly credited. The Creative Commons Public Domain
Dedication waiver ( applies to the data made available in this article,
unless otherwise stated.
Ji et al. BMC Cancer (2015) 15:116
particularly active as a profound tumor suppressor by prohibiting cell cycle progression and arresting cells in early
G1 phase. However, misregulation of TGF-β signaling promotes tumor growth and invasion, evasion of immune
surveillance, and cancer cell dissemination and metastasis
[11-14]. In HCC tissues, the overexpression of TGF-β1
was found and correlated with carcinogenesis, progression, and prognosis of HCC, while normal hepatocytes
had not any TGF-β1 staining [15]. In our previous study,
we found hepatocarcinogenesis could be closely related to
the low expression of Smad4 and phosphorylated Smad2,
and the high expression of TGF-β1 and Smad7 in advanced stage of liver cirrhosis [16].
Embryonic Liver Fodrin (ELF), also named as β2spectrin (β2SP), first isolated from foregut endodermal
stem cell libraries, functions as a Smad3/4 adaptor protein, plays critical roles in the proper control of Smad
access to activating receptors involved in regulation of
TGF-β signaling [17-19]. Interestingly, ELF is a key suppressor of tumorigenesis [20,21]. Disruption of ELF expression by gene knockout was found to result in
miscolocalization of Smad3 and Smad4, and disruption
of TGF-β signaling [22]. About half of mice with heterozygous deletion of ELF developed hepatocellular carcinoma, and 90% of ELF+/−/Smad4+/− mice developed gastric
cancer and other gastrointestinal cancers [23,24]. Loss of
ELF may play a role in the malignant transformation of
hepatic progenitor/stem cells [22]. However, the prognostic
value of ELF for HCC is not well-known. Testing the combination of TGF-β1 and ELF as a predictor for HCC prognosis is also merits study.
In the present study, we examined the pattern of expression of TGF-β1 and ELF in HCC tumor tissues and
normal tissues. Together with the known function, it is
therefore of interest to investigate that TGF-β1 and ELF
protein are potential and reliable biomarker for predicting prognosis in HCC patients after hepatic resection,
and prognostic accuracy of testing can be enhanced by
their combination in the patients with HCC.
Methods
Patients and tissue samples
A total of 84 adult patients with HCC who underwent
hepatic resection in the Department of Hepatobiliary
Surgery, First Affiliated Hospital of Sun Yat-sen University
between June 2007 and October 2009, were enrolled
in this study, including 68 males and 16 females with
an average age of 48 years (range 23 to 75 years).
Written informed consent was obtained from all patients, and the study was conducted in accordance
with the protocol approved by the Declaration of Helsinki
and the guidelines of the Ethics Review Committee of First
Affiliated Hospital of Sun Yat-sen University. In addition,
normal liver tissues were collected from patients with
Page 2 of 11
cavernous hemangioma of liver or patients with intrahepatic stones.
The diagnosis of HCC met the criteria of the American
Association for the study of Liver Disease [25]. The volume of liver resection and the surgical procedures were
decided by tumor size, tumor location, and liver functional
reserve based on a multidisciplinary team meeting every
week. Tumor stages were classified according to the
tumor-node-metastasis (TNM) system of the International
Union Against Cancer by the American Joint Committee
[26]. The histologic grade of tumor was assigned according to the Edmondson Steiner grading system [27]. Fresh
HCC tissues and HCC adjacent tissues were collected
within 30 minutes after resection. These tissues were fixed
with 10% formalin and then embedded in paraffin.
Immunohistochemical analysis
The techniques have been described previously [16]. The
sections were incubated with pre-diluted primary Rabbit
polyclonal anti-ELF antibody (ab72239, Abcam, USA) at
a dilution of 1:100, with Rabbit monoclonal anti-TGF-β1
antibody (Y369, Bioworld, USA) at dilution of 1:100, at
4°C overnight. Negative controls were treated the same
way, omitting the primary antibodies.
Evaluation of immunohistochemical staining
The immunohistochemical staining in the tissue was
scored independently by 2 pathologists blinded to the
clinical data, by applying a semiquantitative immunoreactivity score (IRS) reported elsewhere [28-30]. Category A
documented the intensity of immunostaining as 0–3
(0, negative; 1, weak; 2, moderate; 3, strong). Category
B documented the percentage of immunoreactive cells
as 0 (less than 5%),1 (6%–25%), 2 (26%–50%), 3 (51%–
75%), and 4 (76%–100%). Multiplication of category A
and B resulted in an IRS ranging from 0 to 12 for each
tumor or nontumor. Sections with a total score of 0 or 1
or 2 were defined as negative (−), score of 3 or 4 were defined as weakly positive (+), score of 6 or 8 were defined
as moderately positive (++), score of 9 or 12 were defined
as strongly positive (+++). For categorical analyses, the immunoreactivity was graded as low level (total score < =4)
or high level (total score >4).
Follow-up
The postoperative patients were followed up once a
month during the first half year post-operatively and
every 3 months thereafter. Serum AFP level and abdominal ultrasonography were done routinely during the
postoperative review. Computed tomography (CT) was
performed every 3 to 6 months together with chest
radiographic examination. The endpoint of study was
December 2013. Survival time was calculated from
the date of surgery to the date of death or to the last
Ji et al. BMC Cancer (2015) 15:116
Page 3 of 11
Table 1 The expression of ELF in HCC
Group
n
Table 2 The expression of TGF-β1 in HCC
Expression of ELF
Group
High
Low
n
Expression of TGF-β1
High
Low
Normal liver tissues
20
20(100.0%)
0(0.0%)
Normal liver tissues
20
0(0.0%)
20(100.0%)
Adjacent tissues*
84
65(77.4%)
19(22.6%)
Adjacent tissues*
84
39(46.4%)
45(53.6%)
HCC tissues*#
84
40(47.6%)
44(52.4%)
HCC tissues*
84
50(59.5%)
34(40.5%)
*compared with Normal liver tissues, P < 0.001 (by chi-square test).
#
compared with Adjacent tissues, P < 0.001 (by chi-square test).
follow-up. Date of death was obtained from patient
records or patients’ families through follow-up telephone calls. Date of death for each case was double
verified by local civil affairs department and public
security department. The median follow-up period
was 39 months (range 3 to 81 months).
Recurrence or metastasis was detected by imaging
examination such as ultrasonography, contrast-enhanced
ultrasonography, CT, magnetic resonance imaging (MRI),
hepatic arterial angiography, or positron emission tomography -CT (PET-CT). Isolated increases in serum AFP
were not regarded as recurrent events. Once tumor recurrence was verified, patients received the appropriate further
treatments, including repeat liver resection, radiofrequency
*compared with Normal liver tissues, P < 0.001 (by chi-square test).
ablation, percutaneous ethanol injection, chemoembolization, and/or molecular targeting therapy by sorafenib.
Statistical analysis
Statistical analyses were carried out using the SPSS v 13.
0 software (Chicago, IL, USA). The Wilcoxon W rank
sum test and chi-square test was used to compare
qualitative variables. Spearman correlation was used to
investigate the correlation between ELF and TGF-β1 expression. Survival curves were calculated using the
Kaplan-Meier method and were compared by a log-rank
test, illustrated by survival plots. The Cox proportional
hazards model was used to determine the independent
risk factors associated with prognosis. P < 0.05 was considered statistically significant.
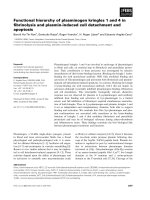
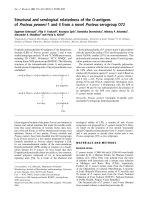
Figure 1 Expression of ELF and TGF-β1 protein. (A) Immunohistochemical staining in different tissues is shown. Normal liver tissues (Aa and Ad),
HCC adjacent tissues (Ab and Ae), HCC tissues (Ac and Af) (original magnification × 400). (B) and (C) Case distribution of ELF/TGF-β1 expression in
normal liver tissues (Normal), HCC adjacent tissues (Para-T) and HCC tissue (Tumor).
Ji et al. BMC Cancer (2015) 15:116
Page 4 of 11
Table 3 Correlation between the clinicopathological characteristics and expression of ELF and TGF-β1 in the
84 HCC patients
Variables
Cases
ELF expression
P value
Low
High
TGF-β1 expression
P value
Low
High
9(54.4%)
7(54.4%)
29(42.6%)
39(57.4%)
27(39.7%)
41(60.3%)
7(43.8%)
9(56.2%)
3(50.0%)
3(50.0%)
31(39.7%)
47(60.3%)
29(40.3%)
43(59.7%)
5(41.7%)
7(58.3%)
1(11.1%)
8(88.9%)
33(44.0%)
42(56.0%)
28(37.8%)
46(62.2%)
6(60.0%)
4(40.0%)
Age(yrs)
> = 60
16
7(43.8%)
9(56.2%)
<60
68
37(54.4%)
31(45.6%)
Male
68
37(54.4%)
31(45.6%)
Female
16
7(43.8%)
9(56.2%)
0.442
0.325
Sex
0.44
0.77
HCC family history
Yes
6
2(33.3%)
4(66.7%)
No
78
42(53.8%)
36(46.2%)
Positive
72
41(56.9%)
31(43.1%)
Negative
12
3(25.0%)
9(75.0%)
0.83
0.95
HbsAg
0.04
0.93
ALT(U/L)
≥80
9
3(33.3%)
6(66.7%)
<80
75
41(54.7%)
34(45.3%)
>100
74
41(55.4%)
33(44.6%)
≤100
10
3(30.0%)
7(70.0%)
Yes
64
32(50.0%)
32(50.0%)
No
20
12(60.0%)
8(40.0%)
≥20
48
28(58.3%)
20(41.7%)
<20
36
16(44.4%)
20(55.6%)
≥5
50
32(64.0%)
18(36.0%)
<5
34
12(35.3%)
22(64.7%)
Single
62
26(41.9%)
36(58.1%)
Multiple
22
18(81.8%)
4(18.2%)
I-II
62
31(50.0%)
31(50.0%)
III-IV
22
13(59.1%)
9(40.9%)
I-II
55
24(43.6%)
31(56.4%)
III-IV
29
20(69.0%)
9(31.0%)
Yes
11
8(72.7%)
3(27.3%)
No
73
36(49.3%)
37(50.7%)
Complete
64
30(46.9%)
34(53.1%)
None
20
14(70.0%)
6(30.0%)
0.39
0.12
PLT(×109)
0.24
0.32
Cirrhosis
0.43
27(42.2%)
37(57.8%)
7(35.0%)
13(65.0%)
19(39.6%)
29(60.4%)
15(41.7%)
21(58.3%)
0.57
AFP(ug/L)
0.21
0.85
Tumor size (cm)
0.01
13(26.0%)
37(74.0%)
21(61.8%)
13(38.2%)
31(50.0%)
31(50.0%)
3(13.6%)
19(86.4%)
0.001
Tumor number
0.001
0.003
Differentiation
0.46
27(43.5%)
35(56.5%)
7(31.8%)
15(68.2%)
29(52.7%)
26(47.3%)
5(17.2%)
24(82.8%)
2(18.2%)
9(81.8%)
32(43.8%)
41(56.2%)
29(45.3%)
35(54.7%)
5(25.0%)
15(75.0%)
0.34
TNM stage
0.03
0.002
PVTT
0.15
0.11
Tumor encapsulation
0.07
0.11
Ji et al. BMC Cancer (2015) 15:116
Page 5 of 11
Table 3 Correlation between the clinicopathological characteristics and expression of ELF and TGF-β1 in the
84 HCC patients (Continued)
Recurrence
Yes
56
39(69.6%)
17(30.4%)
No
28
5(17.9%)
23(82.1%)
No
73
41(56.2%)
32(43.8%)
Yes
11
3(27.3%)
8(72.7%)
<0.001
12(21.4%)
44(78.6%)
22(78.6%)
6(21.4%)
31(42.5%)
42(57.5%)
3(27.3%)
8(72.7%)
<0.001
Complication
0.07
0.34
AFP, Alpha-fetoprotein; HBsAg, hepatitis B surface antigen; PLT, platelet; PVTT, portal vein tumor thrombi.
Results
The low expression of ELF and the high expression of
TGF-β1 in HCC tissues
Using immunohistochemical staining, we examine expression of ELF and TGF-β1 on 20 normal liver tissues,
84 HCC samples and adjacent tissues. All normal liver
tissues expressed high level of ELF (20/20). In HCC
adjacent tissues, there was a 77.4% high expression
rate for ELF (65/84). However, the ELF high expression rate declined to 47.6% (40/84) in HCC tissues.
There was significant difference among the groups examined (P < 0.001) (Table 1, Figure 1A, B). On the
contrary, the expression rate of TGF-β1 in HCC tissues (59.5%, 50/84) was significantly higher than that
in the normal liver tissues (0, 0/20, P < 0.001), but not
in HCC adjacent tissues (46.4%, 39/84, P = 0.089,
Table 2, Figure 1A, C). These results suggested that
there was the low expression of ELF and high expression of TGF-β1 in HCC tissues.
Correlation between TGF-β1/ELF expression and 16
clinico-pathologic characteristics in HCC
In order to further understand the prognostic value of
TGF-β1/ELF expression for HCC after resection, the relationships between the expression of these proteins and
16 clinico-pathologic characteristics, such as age, gender,
HCC family, HBsAg, ALT, AFP, cirrhosis, ascites, PVTT,
tumor size, tumor number, tumor differentiation, tumor
encapsulation, TNM stage, recurrence and complication, were analyzed. The expression level of ELF was
negatively correlated with HBsAg (P =0.04), tumor
size (P = 0.010), tumor number (P = 0.001), TNM stage
(P = 0.027) and recurrence (P < 0.001). As predicted,
Table 4 The correlationship between ELF and TGF-β1
in HCC
ELF
TGF-β1
+++
++
-~+
+++
7
4
12
++
4
1
12
-~+
20
14
10
r
P value
−0.271
0.013
TGF-β1 expression was positively associated with the
tumor size (P = 0.001), tumor number (P = 0.003), TNM
stage (P = 0.002) and recurrence (P < 0.001), too (Table 3).
In addition, we found the significant negative correlation
between ELF and TGF-β1 expression patterns by using
Spearman correlation (r = −0.271, P = 0.013, Table 4).
Independent prognostic factors of HCC
To further identify the risk factors linked to postoperative Disease Free Survival (DFS) and Overall Survival
(OS), ELF, TGF-β1 and 16 clinicopathologic factors were
evaluated by univariate analysis and the Cox regression
model. The univariate analysis showed that the significant prognostic factors for DFS of HCC were tumor
number, portal vein tumor thrombus (PVTT), tumor encapsulation, TNM stage, ELF expression, and TGF-β1
expression. Similarly, the analysis showed that the significant factors for OS of HCC were tumor number,
PVTT, tumor size, resection margin, tumor differentiation, TNM stage, ELF expression, and TGF-β1 expression (all P < 0.05). Using the Cox regression multivariate
analysis, we found that PVTT, ELF expression, and
TGF-β1 expression were the significant independent related factors for DFS (all P < 0.05), in addition, tumor
differentiation (P = 0.029), PVTT (P = 0.011), ELF expression (P = 0.042) and TGF-β1 expression (P < 0.001)
were the significant independent related factors for OS
(Tables 5 and 6).
Low expression of ELF and high expression of TGF-β1
predict HCC patients’ poor prognosis
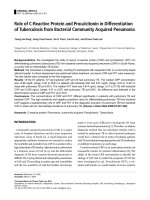
Firstly, we divided 84 patients with HCC into 2 groups
according to their ELF expression profiles: the lowexpression group (n = 44) and the high-expression group
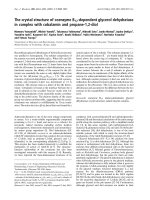
(n = 40). Using the Kaplan-Meier method to analyze patients’ survival, we found that the 1-, 3- and 5-year DFS
rates of the high-expression ELF group were remarkably
higher than the low-expression group (75.0%, 60.0% and
57.5% vs 25.0%, 15.9% and 10.2%, respectively, P < 0.001)
(Figure 2A), while the 1-, 3- and 5-year OS rates of the
high-expression ELF group were significantly higher
than those of the low-expression group (90.0%, 72.5%
Ji et al. BMC Cancer (2015) 15:116
Page 6 of 11
Table 5 Prognostic factors for DFS and OS by univariate analysis
Variables
n
P
DFS
1-yr
3-yrs
5-yrs
OS
1-yr
P
3-yrs
5-yrs
Sex
Male
68
54.4%
36.8%
30.7%
Female
16
56.3%
37.5%
37.5%
<60
68
45.6%
32.4%
29.3%
≥60
16
62.5%
56.3%
42.2%
Yes
6
50.0%
33.3%
16.7%
No
78
48.7%
37.2%
33.3%
<100
10
80.0%
60.0%
60.0%
≥100
74
44.6%
33.8%
28.2%
0.53
79.4%
50.0%
41.2%
87.5%
56.3%
50.0%
82.4%
48.5%
39.7%
75.0%
62.5%
56.3%
0.48
Age(yrs)
0.15
0.39
HCC family history
0.57
83.3%
50.0%
50.0%
79.5%
51.3%
42.3%
100.0%
80.0%
70.0%
78.4%
47.3%
39.2%
0.63
PLT(×109)
0.07
0.08
HBsAg
Positive
72
47.2%
38.9%
33.3%
Negative
12
58.3%
25.0%
25.0%
<20
36
52.8%
38.9%
38.9%
≥20
48
45.8%
35.4%
26.7%
0.90
79.2%
50.0%
44.4%
91.7%
58.3%
33.3%
83.3%
50.0%
44.4%
79.2%
52.1%
41.7%
0.88
AFP(μg/L)
0.34
0.75
Ascites
No
68
52.9%
39.7%
34.1%
Yes
16
31.3%
25.0%
25.0%
No
24
45.0%
35.0%
30.0%
Yes
60
50.0%
37.5%
32.9%
0.14
83.8%
51.5%
44.1%
68.8%
50.0%
37.5%
95.0%
60.0%
45.0%
76.6%
48.4%
42.2%
0.55
Cirrhosis
0.78
0.49
Tumor number
Single
62
59.7%
43.5%
36.9%
Multiple
22
18.2%
18.2%
18.2%
No
73
54.8%
41.1%
35.4%
Yes
11
9.1%
9.1%
9.1%
<5
34
64.7%
47.1%
39.2%
≥5
50
38.0%
30.0%
28.0%
None
20
30.0%
25.0%
15.0%
Complete
64
54.7%
40.6%
37.7%
<2 cm
45
40.0%
26.7%
24.4%
≥2 cm
39
59.0%
48.7%
39.6%
No
73
49.3%
38.4%
33.1%
Yes
11
45.5%
27.3%
27.3%
0.003
85.5%
61.3%
51.6%
68.2%
22.7%
18.2%
87.7%
56.2%
47.9%
36.4%
18.2%
9.1%
<0.001
PVTT
<0.001
<0.001
Tumor size (cm)
0.05
97.1%
67.6%
52.9%
70.0%
40.0%
36.0%
60.0%
45.0%
30.0%
87.5%
53.1%
46.9%
80.0%
40.0%
28.9%
82.1%
64.1%
59.0%
84.9%
53.4%
45.2%
54.5%
36.4%
27.3%
0.04
Tumor encapsulation
0.01
0.08
Resection margin
0.07
0.01
Complication
Tumor differetiation
0.37
0.10
Ji et al. BMC Cancer (2015) 15:116
Page 7 of 11
Table 5 Prognostic factors for DFS and OS by univariate analysis (Continued)
I-II
62
54.8%
41.9%
35.1%
III-IV
22
31.8%
22.7%
22.7%
I-II
55
60.0%
43.6%
38.0%
III-IV
29
27.6%
24.1%
20.7%
Low
44
25.0%
15.9%
10.2%
High
40
75.0%
60.0%
57.5%
Low
34
79.4%
73.5%
62.0%
High
50
28.0%
12.0%
12.0%
0.16
85.5%
56.5%
48.4%
68.2%
36.4%
27.3%
90.9%
60%
52.7%
62.1%
34.5%
24.1%
0.04
TNM stage
0.01
0.001
ELF expression
<0.001
72.7%
31.8%
23.7%
90.0%
72.5%
65.0%
94.1%
85.3%
76.5%
72.0%
28.0%
20.0%
<0.001
TGFβ1 expression
<0.001
<0.001
AFP, Alpha-fetoprotein; HBsAg, hepatitis B surface antigen; PLT, platelet; PVTT, portal vein tumor thrombi.
and 65.0% vs 72.7%, 31.8% and 23.7%, respectively,
P < 0.001) (Figure 2B). Our findings therefore indicated that ELF expression levels were positively correlated
with patients’ DFS and OS.
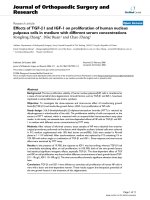
Similarly, Two groups were divided from 84 HCC patients according to their TGF-β1 expression profiles: the
low-expression group (n = 34) and the high-expression
group (n = 50). We observed that the 1-, 3- and 5-year
DFS rates of the low-expression TGF-β1 group were
markedly higher than the high-expression group (79.4%,
73.5% and 62.0% vs 28.0%, 12.0% and 12.0%, respectively,
P < 0.001) (Figure 3A). Also, the 1-, 3- and 5-year OS
rates of the low-expression TGF-β1 group were significantly higher than those of the high-expression group
(94.1%, 85.3% and 76.5% vs 72.0%, 28.0% and 20.0%, respectively, P < 0.001) (Figure 3B). These data suggested
that TGF-β1 expression levels were negatively correlated
with patients’ DFS and OS.
The combination of TGF-β1 and ELF exhibits the
improved prognostic accuracy for HCC
To analyze the prognostic value of combining TGF-β1
and ELF levels for HCC, we divided patients into the following four groups, such as: TGF-β1 high expressionELF high expression group, TGF-β1 low expression- ELF
high expression group, TGF-β1 high expression - ELF
low expression group, TGF-β1 low expression- ELF low
expression group. The data showed that the TGF-β1 low
expression- ELF high expression group had the best DFS
and OS rates, TGF-β1 low expression- ELF low expression group was the second best, the next was TGF-β1
high expression- ELF high expression group, whereas
TGF-β1 high expression- ELF low expression group had
the worst prognosis.
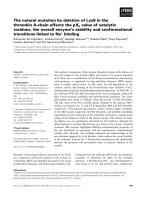
The 1-, 3- and 5-year DFS rates of TGF-β1 low
expression- ELF high expression group (87.5%, 79.2%
and 75.0%) were significantly higher than those of
TGF-β1 high expression- ELF high expression group
(56.3%, 31.3% and 31.3%, P = 0.003) and TGF-β1 high
expression- ELF low expression group (26.5%, 2.9%
and 2.9%, P < 0.001). The 1-, 3- and 5-year OS rates of
TGF-β1 low expression- ELF high expression group
(95.8%, 91.7% and 83.3%) were also significantly higher
than those of TGF-β1 high expression- ELF high expression group (81.3%, 43.8% and 37.5%, P = 0.001) and TGFβ1 high expression- ELF low expression group (67.6%,
20.6% and 11.8%, P < 0.001) (Figure 4A and B).
Furthermore, we found that the 1-, 3- and 5-year DFS
rates of TGF-β1 high expression-ELF low expression
(26.5%, 2.9% and 2.9%) were remarkably lower than TGFβ1 high expression- ELF high expression (56.3%, 31.3%
and 31.3%, P = 0.002) and TGF-β1 low expression-ELF
Table 6 Prognostic factors for disease-free and overall survival by the multivariate Cox proportional hazards
regression model
Variables
DFS
HR
OS
95% CI
P
Tumor differentiation
PVTT
0.405
0.199-0.824
0.013
P
HR
95% CI
0.498
0.266-0.932
0.029
0.398
0.195-0.812
0.011
ELF expression
2.135
1.115-4.088
0.022
1.989
1.024-3.862
0.042
TGFβ1 expression
0.219
0.099-0.486
<0.001
0.210
0.093-0.474
<0.001
HR, hazard ratio; CI, confidence interval; PVTT, portal vein tumor thrombi.
Ji et al. BMC Cancer (2015) 15:116
Page 8 of 11
Figure 2 Kaplan-Meier curves are shown for time to disease recurrence (A) and overall survival (B) among patients with high or low
intratumoral ELF expression.
low expression (60.0%, 60.0% and 37.5%, P = 0.002). Also,
the 1-, 3- and 5-year OS rates of TGF-β1 high expressionELF low expression (67.6%, 20.6% and 11.8%) were
markedly lower than TGF-β1 low expression-ELF low
expression group (90.0%, 70.0% and 60.0%, P = 0.003).
However, there was no significant difference of OS rates
between TGF-β1 high expression-ELF low expression
and TGF-β1 high expression- ELF high expression
(67.6%, 20.6% and 11.8% vs 81.3%, 43.8% and 37.5%,
respectively, P = 0.058). We also found no significant difference of DFS and OS rates between TGF-β1 low
expression-ELF high expression group and TGF-β1 low
expression- ELF low expression group, or between TGFβ1 low expression-ELF low expression group and TGFβ1 high expression-ELF high expression group (Figure 4A
and B). Collecting, the results indicated that the combination of TGF-β1 elevation and ELF reduction in HCC tissues appears to be predictive of the poorest prognosis.
Discussion
In the past few decades, great efforts have been made to
explore the molecular mechanism of HCC to identify
biomarkers for prediction and to develop effective treatments. In this study, we focused on investigating the
prognostic significance of TGF-β1 and ELF, in particular
their combination, for HCC. Our first finding showed
that the TGF-β1 protein was upregulated in human
HCC tissues and no normal liver tissues with strong
cytoplasmic TGF-β1 protein immunostaining. The results were consistent with our previous study that the
low-expression of TGF-β1 in normal rat liver tissues and
the high-expression of TGF-β1 in rat HCC tissues [16].
Like others reports [31,32]. We also found the positive
correlation between TGF-β1 and several clinicopathological characteristics: tumor size, tumor number, TNM
stage and recurrence. A shorter post-operative survival
of HCC patients with high level of TGF-β1 had been
Figure 3 Kaplan-Meier curves are shown for time to disease recurrence (A) and overall survival (B) among patients with high or low
intratumoral TGF-β1 expression.
Ji et al. BMC Cancer (2015) 15:116
Page 9 of 11
Figure 4 The combination of ELF and TGF-β1 was found to enhance prognostic accuracy for HCC. Disease-free survival curves (A) and
overall survival curves (B).
documented in this study. The 1-, 3- and 5-year DFS
rates and OS rates of HCC patients with high level of
TGF-β1 were markedly lower than the low-expression
group.
Why do the functions of TGF-β switch from tumor
suppression to tumor promotion? Mishra L et al. indicated that proper control of TGF-β signaling tumor suppressor function requires an additional adaptor protein,
ELF. Research from that group indicated that disruption
of ELF expression results in miscolocalization of Smad3
and Smad4, then disruption of TGF-β signaling, allowing
normal cells to escape from the regulation of proliferation in carcinogenesis [21,33-36]. However, it was not
reported if ELF expression level correlated with survival
of HCC patients.
It is therefore of interest to investigate the expression
and clinical significance of ELF in patients with HCC.
We found that ELF was lost or underexpressed in the
majority of HCC tissues, and that a high level of ELF expression predicted a favorable DFS rate and OS rate for
HCC patients. Our data showed that the expression of
ELF negatively correlated with HbsAg, tumor size,
tumor number, TNM and recurrence. The 1-, 3- and 5year DFS rates of HCC patients with the high level of
ELF expression were remarkably higher than those of
HCC patinets with the low levels. Similarly, the 1-, 3and 5-year OS rates of HCC patients with the high level
of ELF expression were significantly higher than those of
HCC patients with the low levels. These data were consistent with previous studies, which showed that significant ELF reduction was found in HCC, gastric cancer
and lung cancer [33-36].
Further, we studied the correlation between ELF and
TGF-β1 in HCC patients, and demonstrated their
significant negative correlation. Then we used univariate
analysis and the Cox regression mode to study the role
of ELF and TGF-β1 on HCC, finding that the expression
of ELF and TGF-β1 were both significant and independent prognostic factors for DFS or OS of HCC. These
data further verified that ELF and TGF-β1 were important and promising candidate tumor biomarker for predicting the prognosis of patients with HCC, and we
hypothesized if combination of ELF and TGF-β1 could
give us a more sensitive way to predict HCC patients’
outcome.
It is widely understood that a combination of multiple
markers might yield more information for predicting
clinical outcome of HCC patients [37]. Elevation of
TGF-β1 or reduction of ELF in HCC tissues appears to
be predictive of a poor prognosis. The combination of
TGF-β1 and ELF expression were therefore used as a
predictor of clinical outcome. The results indicated that
their combination has a better prognostic value compared with either one alone. For example, those patients
with low ELF expression and high TGF-β1 expression
had the poorest OS and DFS rates, whereas those patients with high ELF expression and low TGF-β1 expression had the most favorable OS and DFS rates. The
second best prognosis belonged to these patients with
low ELF expression and low TGF-β1 expression. In
addition, we found that high level of ELF could partially
rescue TGF-β1 related tumor promotion, but TGFβ1still was the more important factor for prognosis of
patient with HCC.
Conclusions
Our study determined that loss or reduction of ELF
and elevation of TGF-β1 was correlated with disease
Ji et al. BMC Cancer (2015) 15:116
progression and metastasis in patients with HCC. And
the most interesting finding was that the predictive range
of ELF levels combined with TGF-β1 expression was
more sensitive than that of either ELF or TGF-β1 alone
with regard to OS and cumulative disease recurrence in
patients with HCC. From a diagnostic viewpoint, our results suggest that the detection of tumor ELF alone or
the combined evaluation of ELF/ TGF-β1 levels could be
used as a new prognostic marker in patients with HCC.
However, the exact mechanisms of ELF and TGF-β1 expression regulation and function in HCC should been
elucidated further. In the future, ELF might be used as
potentially powerful target for treatment of HCC through
enhancing the tumor suppression of TGF-β pathway.
Page 10 of 11
4.
5.
6.
7.
8.
9.
10.
11.
Abbreviations
HCC: Hepatocellular cancer; TGF-β: The transforming growth factor β;
SBE: Smad-binding elements; ELF: Embryonic Liver Fodrin; β2SP: β2-spectrin;
TNM: Tumor-node-metastasis; IRS: Immunoreactivity score; CT: Computed
tomography; MRI: Magnetic resonance imaging; PET-CT: Positron emission
tomography -CT; DFS: Disease Free Survival; OS: Overall Survival; AFP: Alphafetoprotein; HBsAg: Hepatitis B surface antigen; PLT: Platelet; PVTT: Portal vein
tumor thrombi. HR, hazard ratio; CI: Confidence interval.
12.
13.
14.
Competing interests
The authors declare that they have no competing interests.
15.
Authors’ contributions
FJ, SJF and YPH were the main authors of the manuscript. They were
involved in the conception, design and coordination of the study as well as
in data analysis, interpretation of results and drafting the manuscript. YPH
was in charge of all experimental procedures. SLS, LJZ, QHC, SQL, BGP, and
LJL participated in the experimental procedures and revised critically the
content of the manuscript. All authors contributed to the interpretation of
data and critically revised the manuscript. All authors read and approved the
final manuscript.
16.
Acknowledgments
This study was supported by grants from the National Natural Science
Foundation of China (NO. 81201918), Science and Technology Project of
Guangdong Province (No.2012B031800099), Doctorial Fellowship of Higher
Education of China (NO.200805581172). The funders had no role in study
design, data collection and analysis, decision to publish, or preparation of
the manuscript.
Author details
1
Organ Transplant Center, the First Affiliated Hospital, Sun Yat-sen University,
Guangzhou 510080, P. R. China. 2Department of Hepatopancreaticobiliary
Surgery, The Second Affiliated Hospital of Guangzhou University of Chinese
Medicine (Guangdong Provincial Hospital of TCM), Guangdong Provincial
Hospital of Traditional Chinese Medicine, Guangzhou 510120, P. R. China.
3
Department of Liver Surgery, the First Affiliated Hospital, Sun Yat-sen
University, Guangzhou 510080, P. R. China. 4Laboratory of Surgery, the First
Affiliated Hospital, Sun Yat-sen University, Guangzhou 510080, P. R. China.
5
Department of Pathology, the First Affiliated Hospital, Sun Yat-sen University,
Guangzhou 510080, P. R. China.
17.
18.
19.
20.
21.
22.
23.
24.
Received: 19 November 2014 Accepted: 24 February 2015
25.
References
1. EI-serag HB, Rudolph KL. Hepatocellular carcinoma:epidemiology and
molecular carcinogenesis. Gastroenterology. 2007;132:2557–76.
2. Tang ZY. Hepatocellular carcinoma-cause, treatment, and metastasis. World
J Gastroenterol. 2001;7:445–54.
3. World Health Organization: The world health report 2006. .
int/whr/2006/en/
26.
27.
28.
Ng KK, Lo CM, Liu CL, Poon RT, Chan SC, Fan ST. Survival analysis of patients
with transplantable recurrent hepatocellular carcinoma: implications for
salvage liver transplant. Arch Surg. 2008;143:68–74.
Kim DY, Paik YH, Ahn SH, Youn YJ, Choi JW, Kim JK, et al. PIVKA-II is a useful
tumor marker for recurrent hepatocellular carcinoma after surgical resection.
Oncology. 2007;72:52–7.
Zarzynska JM. Two Faces of TGF-Beta1 in Breast Cancer. Mediators Inflamm.
2014;2014:141747.
Heldin CH, Landström M, Moustakas A. Mechanism of TGF-β signaling to
growth arrest, apoptosis, and epithelialmesenchymal transition. Curr Opin
Cell Biol. 2009;21:166–76.
Ikushima H, Miyazono K. Biology of transforming growth factor-β signaling.
Curr Pharm Biotechnol. 2011;12:2099–107.
Moses H, Barcellos-Hoff MH. TGF-β biology in mammary development and
breast cancer. Cold Spring Harb Perspect Biol. 2011;3:a003277.
Parvani JG, Taylor MA, Schiemann WP. Noncanonical TGF-β signaling
during mammary tumorigenesis. J Mammary Gland Biol Neoplasia.
2011;16:127–46.
Katz LH, Li Y, Chen JS, Muñoz NM, Majumdar A, Chen J, et al. Targeting
TGF-β signaling in cancer. Expert Opin Ther Targets. 2013;17:743–60.
Bierie B, Moses HL. Transforming growth factor beta (TGF-β) and
inflammation in cancer. Cytokine Growth Factor Rev. 2010;21:49–59.
Kajdaniuk D, Marek B, Borgiel-Marek H, Kos-Kudła B. Transforming
growth factorβ1 (TGFβ1) in physiology and pathology. Endokrynol Pol.
2013;64:384–96.
Zu X, Zhang Q, Gao R, Liu J, Zhong J, Wen G. Transforming growth factor-β
signaling in tumor initiation, progression and therapy in breast cancer: an
update. Cell Tissue Res. 2012;347:73–84.
Malaguarnera G, Giordano M, Paladina I, Berretta M, Cappellani A,
Malaguarnera M. Serum markers of hepatocellular carcinoma. Dig Dis Sci.
2010;55:2744–55.
Hua YP, Li SQ, Lai JM, Liang LJ, Peng BG, Liang HZ, et al. Changes in TGF-β/
Smads signaling pathway in rats with chemical hepatocarcinogenesis.
J South Med Univ. 2008;28:1848–52.
Baek HJ, Lim SC, Kitisin K, Joqunoori W, Tang Y, Marshall MB, et al.
Hepatocellular cancer arises from loss of transforming growth factor beta
signaling adaptor protein embryonic liver fodrin through abnormal
angiogenesis. Hepatology. 2008;48:1128–37.
Thenappan A, Shukla V, Abdul Khalek FJ, Thenappan A, Shukla V, Abdul
Khalek FJ, et al. Loss of transforming growth factor β adaptor protein β-2
spectrin leads to delayed liver regeneration in mice. Hepatology.
2011;53:1641–50.
Wang Z, Song Y, Tu W, He X, Lin J, Liu F. β-2 spectrin is involved in
hepatocyte proliferation through the interaction of TGFβ/Smad and
PI3K/AKT signaling. Liver Int. 2012;32:1103–11.
Tang Y, Katuri V, Srinivasan R, Foqt F, Redman R, Anand G, et al.
Transforming growth factor-beta suppresses nonmetastatic colon
cancer through Smad4 and adaptor protein ELF at an early stage of
tumorigenesis. Cancer Res. 2005;65:4228–37.
Mishra L, Katuri V, Evans S. The role of PRAJA and ELF in TGF-beta signaling
and gastric cancer. Cancer Biol Ther. 2005;4:694–9.
Tang Y, Kitisin K, Jogunoori W, Li C, Deng CX, Mueller SC, et al. Progenitor/
stem cells give rise to liver cancer due to aberrant TGF- beta and IL-6 signaling.
Proc Natl Acad Sci U S A. 2008;105:2445–50.
Kim SS, Shetty K, Katuri V, Kitisin K, Baek HJ, Tang Y, et al. TGF-beta signaling
pathway inactivation and cell cycle deregulation in the development of
gastric cancer: role of the beta-spectrin, ELF. Biochem Biophys Res Commun.
2006;344:1216–23.
Kitisin K, Ganesan N, Tang Y, Joqunoori W, Volpe EA, Kim SS, et al.
Disruption of transforming growth factor-beta signaling through betaspectrin ELF leads to hepatocellular cancer through cyclin D1 activation.
Oncogene. 2007;26:7103–10.
Bruix J, Sherman M. Management of hepatocellular carcinoma: an update.
Hepatology. 2011;53:1020–2.
Sobin LH, Wittekind C. UICC (International Union against Cancer) TNM
classification of malignant tumors. 6th ed. New York: John Wiley; 2002.
p. 1–264.
Edmondson HA, Steiner PE. Primary carcinoma of the liver: a study of 100
cases among 48,900 necropsies. Cancer. 1954;7:462–503.
Weichert W, Röske A, Gekeler V, Beckers T, Ebert MP, Pross M, et al.
Association of patterns of class I histone deacetylase expression with
Ji et al. BMC Cancer (2015) 15:116
29.
30.
31.
32.
33.
34.
35.
36.
37.
Page 11 of 11
patient prognosis in gastric cancer: a retrospective analysis. Lancet Oncol.
2008;9:139–48.
Wu F, Liu SY, Tao YM, Ou DP, Fang F. Decreased expression of methyl
methansulfonate and UV sensitive gene clone 81 is related to poor prognosis
of patients with hepatocellular carcinoma. Cancer. 2008;112:2002–10.
Wu F, Yang LY, Li YF, Ou DP, Chen DP, Fan C. Novel role for epidermal
growth factor-like domain 7 in metastasis of human hepatocellular carcinoma.
Hepatology. 2009;50:1839–50.
Tripsianis G, Papadopoulou E, Romanidis K, Katotomichelakis M,
Anagnostopoulos K, Kontomanolis E, et al. Overall Survival and
Clinicopathological Characteristics of Patients with Breast Cancer in
Relation to the Expression Pattern of HER-2, IL-6, TNF-α and TGF-β1.
Asian Pac J Cancer Prev. 2013;14:6813–20.
de Kruijf EM, Dekker TJ, Hawinkels LJ, Putter H, Smit VT, Kroep JR, et al. The
prognostic role of TGF-β signaling pathway in breast cancer patients. Ann
Oncol. 2013;24:384–90.
Song S, Maru DM, Ajani JA, Chan CH, Honjo S, Lin HK, et al. Loss of TGF-β
adaptor β2SP activates notch signaling and SOX9 expression in esophageal
adenocarcinoma. Cancer Res. 2013;73:2159–69.
Baek HJ, Pishvaian MJ, Tang Y, Kim TH, Yang S, Zouhairi ME, et al. Transforming
growth factor-β adaptor, β2-spectrin, modulates cyclin dependent kinase 4 to
reduce development of hepatocellular cancer. Hepatology. 2011;53:1676–84.
Katuri V, Tang Y, Marshall B, Rashid A, Jogunoori W, Volpe EA, et al.
Inactivation of ELF/TGF-beta signaling in human gastrointestinal cancer.
Oncogene. 2005;24:8012–24.
Baek HJ, Kim SS, da Silva FM, Volpe EA, Evans S, Mishra B, et al. Inactivation
of TGF-beta signaling in lung cancer results in increased CDK4 activity that
can be rescued by ELF. Biochem Biophys Res Commun. 2006;346:1150–7.
Li SX, Tang GS, Zhou DX, Pan YF, Tan YX, Zhang J, et al. Prognostic
significance of cytoskeleton- associated membrane protein 4 and its
palmitoyl acyltransferase DHHC2 in hepatocellular carcinoma. Cancer.
2014;120:1520–31.
Submit your next manuscript to BioMed Central
and take full advantage of:
• Convenient online submission
• Thorough peer review
• No space constraints or color figure charges
• Immediate publication on acceptance
• Inclusion in PubMed, CAS, Scopus and Google Scholar
• Research which is freely available for redistribution
Submit your manuscript at
www.biomedcentral.com/submit