COP1, the negative regulator of ETV1, influences prognosis in triple-negative breast cancer
Bạn đang xem bản rút gọn của tài liệu. Xem và tải ngay bản đầy đủ của tài liệu tại đây (1.43 MB, 10 trang )
Ouyang et al. BMC Cancer
DOI 10.1186/s12885-015-1151-y
RESEARCH ARTICLE
Open Access
COP1, the negative regulator of ETV1, influences
prognosis in triple-negative breast cancer
Mao Ouyang1,2†, Hua Wang1†, Jieyi Ma1†, Weiming Lü3, Jie Li3, Chen Yao3, Guangqi Chang3, Jiong Bi1,
Shenming Wang3* and Wenjian Wang1*
Abstract
Background: ETS variant 1 (ETV1) and E3 ubiquitin ligase constitutive photomorphogenetic 1 (COP1) have been
proposed to be a pair of oncogene and tumor suppressor. However, the co-existing status of ETV1 and COP1 in
triple-negative breast cancer (TNBC) and their predictive role in determining the patient’s outcome are uncertain.
Methods: We examined the abundance of COP1 and ETV1 proteins and their clinicopathologic significance in
archival TNBC tissues from 105 patients by tissue microarray. The potential function link between COP1 and ETV1
was observed in MDA-MB-231 cells by cell proliferation, invasion and migration assays.
Results: ETV1 expression was higher in TNBC tissues compared to normal tissues, while COP1 was lower. ETV1
expression was negatively associated with COP1 abundance in TNBCs. Overexpression of COP1 led to significant
reduction of ETV1 in MDA-MB-231 cells, and suppressed the cells migration and invasion. Rescue of ETV1 expression
in the presence of COP1 notably regained the cells behaviors. ETV1-positive group was associated with a markedly
poor overall survival. Meanwhile, we had observed favourable prognosis in COP1-positive cases for the first time.
Multivariate analysis showed that COP1 together with ETV1 were independent risk factors in the prognosis of TNBC
patients.
Conclusions: COP1 might be a tumor suppressor by negative regulating ETV1 in patients with TNBCs. COP1 and
ETV1 are a pair of independent predictors of prognosis for TNBC cases. Thus, targeting them might be a potential
strategy for personalized TNBC treatment.
Keywords: ETV1, COP1, Triple-negative breast cancer, Overall survival, Prognosis
Background
Triple-negative breast cancer (TNBC) is a subtype of
breast cancer defined as tumors that lack the expression
of estrogen receptors (ER), progesterone receptors (PR),
and HER2, and accounts for 15% of all breast cancer cases
[1]. TNBC is a challenging disease with the worst outcome
among all breast cancer subtypes because it does not
respond to endocrine therapy or other available targeted
agents [2-4]. A minority among all TNBC patients is
sensitive to chemotherapy [5]. Although the metastatic
* Correspondence: ;
†
Equal contributors
3
Department of Vascular, Thyroid and Breast Surgery, First Affiliated Hospital,
Sun Yat-sen University, 58 Zhongshan Rd II, Guangzhou, Guangdong 510080,
People’s Republic of China
1
Laboratory of Department of Surgery, First Affiliated Hospital, Sun Yat-sen
University, 58 Zhongshan Rd II, Guangzhou, Guangdong 510080, People’s
Republic of China
Full list of author information is available at the end of the article
potential of all subtypes of breast cancer is ultimately
similar, TNBC is associated with a shorter median time of
relapse and death [3,6]. Therefore, identification of the
prognostic factors or markers to reliably select high and
low risk subsets of TNBC cases is an urgent need for personalized therapies.
The PEA3 subfamily of ETS transcription factors is
composed of ETV1, 4 and 5 [7,8]. Their association with
cancer was first noted over a decade ago in Ewing tumors, in which the EWS gene can be translocated onto
the three member genes and the resultant fusion proteins exerts oncogenic properties [9]. Thereafter, it was
found that the PEA3 group could play a tumorigenic
role in melanoma, prostate cancer, gastrointestinal stromal tumor and breast cancer [10-14]. The proposed
mechanisms of breast tumorigenesis by PEA3 group
partly include that they promote breast cancer incidence,
© 2015 Ouyang et al.; licensee BioMed Central. This is an Open Access article distributed under the terms of the Creative
Commons Attribution License ( which permits unrestricted use, distribution, and
reproduction in any medium, provided the original work is properly credited. The Creative Commons Public Domain
Dedication waiver ( applies to the data made available in this article,
unless otherwise stated.
Ouyang et al. BMC Cancer
progression and invasion through transcriptional activation of several genes, such as HER2, smad7, matrix metalloproteinases (MMPs) and cyclooxygenase (COX)-2 by
interaction with the coactivators CBP and p300, and an
associated kinase [1,15,16].
COP1 (also known as RFWD2) is a member of the
COP–DET–FUS protein family. COP1 possesses E3 ubiquitin ligase activity, which is involved in the ubiquitylation
of various protein substrates to trigger their proteasomal
degradation [17]. As a tumor suppressor, partial or tissuespecific loss of COP1 function causally contributes to
tumorigenesis [18-20]. The accumulative list of COP1
substrates identified so far includes p53, c-Jun, and PEA3
family members [21]. ETV1, ETV4 and ETV5 have highly
conserved COP1-binding motifs, which can recognize
COP1 [17,22]. COP1 regulates the stability and the transcriptional activity of PEA3 factors, which is dependent on
the RING domain of COP1 [16]. COP1hypo/hypo mice were
reported to spontaneously develop malignancies at a high
frequency [19]. Also, COP1 deficiency in mouse prostate
elevated ETV1 and increased cell proliferation, hyperplasia, and early prostate intraepithelial neoplasia [18]. It is
unclear whether dysregulation of PEA3 factors and COP1
happens concurrently in TNBCs. Therefore, it would be
of great interest to investigate the potential function link
between PEA3 factors and COP1, as well as the prognostic
value of their expression status in TNBCs.
In the present study, we analyzed the correlation between COP1 and ETV1 expression status, and clinicopathological features, as well as the clinical outcome in a
retrospective study cohort of post-resection patients with
TNBC. Our data suggest that ETV1 is negatively regulated
by COP1. They might be a pair of potential independent
biomarkers and perhaps therapeutic targets for TNBCs.
Page 2 of 10
Ethics Committee of the First Affiliated Hospital of Sun
Yat-sen University for use of these clinical materials in this
study. Most tumors (n = 93) were invasive ductal carcinomas. The remaining tumors were 3 cases of invasive
lobular carcinoma, 3 cases of mucinous carcinoma, 2
cases of medullary carcinoma, 2 tubular carcinoma and 2
invasive micropapillary carcinoma. Tumor stages and clinicopathological classification were defined with the pathologic tumor-node-metastasis (pTNM) classification [23].
The overall survival was defined as the time from the date
of surgery to the date of death as a result of any cause.
The patients who were alive on the date of the last followup were censored on that date. The median duration of
follow-up was 78.6 months (range, 6.0 to 145.3 months).
The clinicopathologic characteristics of the patients are
summarized in Table 1.
Cell culture, plasmids, lentivirus and siRNAs
TNBC cell line, MDA-MB-231, was purchased from
American Type Culture Collection (ATCC). The cells were
cultured using DMEM (Gibco, USA) supplemented with
10% fetal bovine serum (Gibco, USA) at 37°C and 5% CO2.
Full-length human ETV1 coding sequence was cloned into
GV141 vector (GV141-ETV1) and lentivirus containing
Table 1 Clinicopathologic characteristics of the patients
Factor
No.
%
Age (years)
≤50
63
60
>50
42
40
Invasive ductal carcinomas
93
88.6
Others
12
11.4
Pathological type
Stage
Methods
I
6
5.7
Patients and tumor samples
II
34
32.4
III
65
61.9
Archived and paraffin-embedded samples were obtained
from 105 TNBC patients who underwent surgical resection between January 1997 and December 2007 in the
Department of Vascular, Thyroid and Breast Surgery, the
First Affiliated Hospital of Sun Yat-sen University. Four
pairs of fresh TNBC tissues and adjacent non-tumor tissues were obtained recently from four TNBC cases.
Among all the 105 patients, the ages ranged from 24 to
82 years (mean age, 51.2 years). Ultrasonography and
X-ray scans were conducted for all the patients before
operation. All cases had been confirmed by hematoxylineosin staining and immunohistochemical detection of ER,
PR and HER2 (Additional file 1: Figure S1). All patients
had received anthracyclines or taxanes-based adjuvant
chemotherapy after surgery dependent of age or general
condition. We obtained the patients’ prior written informed consent and approval via the Institute Research
Tumor size
≤2 cm
19
18.1
>2 cm
86
81.9
Yes
38
36.2
No
67
63.8
0-4
45
42.9
5-8
39
37.1
≥9
21
20.0
Relapse
Lymph node metastasis
Status
Dead
67
63.8
Alive
38
36.2
Ouyang et al. BMC Cancer
full-length human COP1 coding sequence and GFP (LVCOP1)
was constructed using GV287 vector and packed by Genechem
(Genechem Co., China). Lentivirus with empty vector was
used as negative control (LV-NC). siRNAs against ETV1
or COP1 (Additional file 2: Table S1) and negative control
siRNAs were purchased from Ribobio (Ribobio Co.,
China). Transfection efficiency of MDA-MB-231 cells
was detected by qRT-PCR assay and western blotting
(Additional file 3: Figure S2, Additional file 4: Figure S3
and Additional file 5: Figure S4).
Page 3 of 10
(TaKaRa, China) according to the manufacture’s instruction. qRT-PCR assays were then performed on CFX96
(Bio-Rad Laboratories, USA) utilizing SYBR® Premix Ex
Taq™ II (Tli RNaseH Plus) (TaKaRa, China). To normalize
the target gene’s expression levels in different groups, βactin was chosen as an internal control. Primer sequences
used in this study were listed in Additional file 6: Table S2.
The relative mRNA expression levels of target genes were
calculated using the 2-ΔΔCt method.
Western blotting analysis
Cell proliferation assay
To determine the effect of enforced COP1 expression
and suppression of ETV1 on cell proliferation, MDAMB-231 cells were infected with 1 × 10⁸TU/ml LV-NC
or LVCOP1 in enhanced infection solution containing
5 μg/μl polybrene (Genechem Co., China) and screened
by flow cytometry to obtained positive infected cell lines
to expand culture for further investigation. For cell proliferation assay, MDA-MB-231 and lentiviruses infected
cells were seeded at a density of 3000 cells/well in 96
well plate. Then, siRNAs and GV141-ETV1 were transfected into cells with Lipofectamine 2000 (Invitrogen,
USA) according to the manufacture’s instruction. After
72 h, cells were subjected to cell counting kit-8 (CCK8)
assay. Cell proliferation was determined by reading plates
at 450 nm.
Cell invasion and migration assays
The cancer cell invasion assay was performed in BD
BioCoat™ Matrigel™ Invasion Chamber (8 μm pore size)
(BD Bioscience, USA) and transwell migration assay was
performed in cell culture inserts with PET membrane
(Corning, USA). Assays were performed as instructed by
the manufacturer’s protocols. Briefly, cells (1 × 10⁵ cells)
suspended in serum free medium were added to the upper
chamber of an insert, and the insert was placed in a 24well plate with DMEM supplemented with 10% fetal
bovine serum. Migration assays were carried out for 6 h
and invasion assays were carried out for 16 h. After the
cells were incubated for exact time at 37°C, the inserts
were washed with PBS, and cells on the upper surface of
the insert were removed with a cotton swab. Cells adhering to the lower surface were fixed with 4% formaldehyde
for 30 minutes, stained with 0.1% crystal violet solution
and captured under a microscope.
Total RNA isolation and qRT-PCR assay
The samples were stored in liquid nitrogen until RNA
extraction. The total RNA from each sample was extracted using Trizol reagent (Invitrogen, USA) according
to the manufacturer’s instruction. 2 μg RNA from each
sample was used to synthesize the first-strand cDNA
using the PrimeScript™ II 1st Strand cDNA Synthesis Kit
To perform western blotting analysis, the samples were
lysed in RIPA protein lysis buffer (Beyotime, China) supplemented with 1 mM PMSF. Protein concentration was
measured by BCA protein assay kit (Beyotime, China).
20 μg of target protein was applied to each well of 10%
SDS-polyacrylamide gel (SDS-PAGE), separated electrophoretically and transferred onto polyvinylidene difluoride
membranes (Millipore Corporation, USA). The transblotted membrane was incubated with anti-ETV1 rabbit
polyclonal antibodies (1:1000; ABCAM, USA) and antiCOP1 mouse monoclonal antibody (1:1000; ABCAM, USA)
at 4°C overnight, respectively. Expression of ETV1 or
COP1 was detected by horseradish peroxidase (HRP) conjugated secondary antibody (1:5000; CST, USA) and an
enhanced chemiluminescence kit (Amersham Pharmacia
Biotech, UK) according to the manufacturer suggested
protocols. An anti-GAPDH mouse monoclonal antibody
(1:2000; Kangcheng, China) was used as a loading control.
Tissue microarray preparation
For tissue microarray block construction, a hematoxylin and
eosin section from formalin-fixed and paraffin-embedded
tumor tissues was reviewed to confirm the diagnosis and to
define representative tumor regions. Thereafter, two 1 mmsized core biopsies were taken from the morphologically
representative areas using a precision instrument (MicroDigital Co., Korea) and then arrayed onto a recipient paraffin
block. The core biopsies were reviewed by two pathologists.
In total, 2 tissue microarray blocks were constructed from
105 TNBC cases. Each of the recipient blocks included
one core of normal breast tissue for internal control, and
two cores of palatine tonsil and placenta for proper tissue
array orientation and universal control. After construction, two 4 μm sections were removed from each block
and transferred onto glass slides for immunohistochemical
staining. The quality of morphologic preservation in the
tissue array sections were assessed against the whole tissue
sections of the same cases. A valid case was defined as a
tumor occupying more than 10% of the core area [24].
Immunohistochemical analysis
Immunohistochemical staining of ETV1 or COP1 was
carried out according to the manufacture’s protocol on
Ouyang et al. BMC Cancer
all four TNBC tissue microarrays, respectively. In briefly,
the sections were incubated overnight in a moist box with
antibodies of ETV1 (1:100; ABCAM, USA) or COP1
(1:200; ABCAM, USA) in PBS at 4°C. Poly peroxidaseanti-mouse/rabbit IgG (GSGB-BIO, China) was subjected
to the sections for 30 minutes at room temperature after
washing with PBS. Diamindobenzidine was used for colorimetric detection and the sections were counterstained
with haematoxylin and mounted with distyrene plasticizer
xylene (DPX). Negative controls were performed by replacing the primary antibody with preimmune rabbit
serum. Positive controls were conducted according to the
manufacture’s suggestion. For each run of immunohistochemistry, negative and positive controls were performed.
Immunostained tissue array sections were reviewed
under a microscope by two pathologists, who were blinded
regarding the clinicopathological characteristics and outcome of the patients, while visually scoring each individual
tissue core. An immunoreactivity score method based on
the proportion and intensity of positively stained tumor
cells was employed. For positively stained cells: 0 (negative)
was denoted for < 10% positive cells, 1 (weak) for < 25%
positive cells, 2 (moderate) for < 50% positive cells, and 3
(strong) for > 50% positive cells. The staining intensity was
defined as: 0 for no stain, 1 for weak-positive (faint yellow),
2 for moderate-positive (yellowish-brown), and 3 for
strong-positive (brown). Scores of the proportion and intensity of positively stained tumor cells were added and
stratified as having negative (−) expression (0–3 score) and
positive (+) expression (4–6 score) [25]. If no tumor was
detected, or staining could not be evaluated for all four
cores, the status of ETV1 or COP1 was noted as missing.
Page 4 of 10
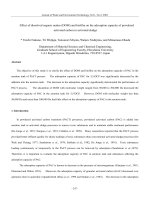
tissues. Our results showed that the expression levels of
ETV1 mRNA and protein in TNBC tissues (T) were significantly higher than those of the paired adjacent noncancerous tissues (N). Whereas, expression levels of COP1
mRNA and protein in TNBC tissues (T) were markedly
lower than those of the paired adjacent non-cancerous tissues (N) (Figure 1). Our data revealed that TNBC tissues
with relatively higher ETV1 expression displayed much less
COP1 abundance, indicating that there might be an inverse
relationship between ETV1 and COP1 in TNBC.
The expression status of ETV1 and COP1 is related with
clinical factors and prognosis of TNBC patients
105 TNBC patients were involved in this retrospective
study. The median age at breast cancer diagnosis was
50 years old (range, 24–82 years). The median duration
of follow-up after surgery was 78.57 months (range, 6.0145.3 months), with 67 deaths at the end of follow up.
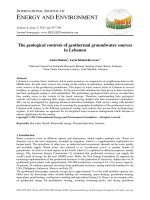
Among the 105 cases of TNBC, 79 cases (75.2%) were
ETV1-positive and 26 (24.7%) were ETV1-negative, whereas
30 cases (28.6%) were COP1-positive and 75 were negative
(Figure 2). ETV1 expression status according to COP1
expression and their corresponding clinicopathological
characteristics are summarized in Table 2. There was a
significant negative correlation between ETV1 and COP1
expression (χ2 test, γ = − 0.960, χ2 = 52.678; P < 0.001), indicating potential interaction between the two proteins.
Either ETV1 or COP1 expression status was significantly
associated with TNM stages of TNBC, the number of
lymph nodes involved and tumor relapse. Age, tumor size
Statistical analysis
All statistical analyses were carried out using the SPSS
16.0 statistical software package. The χ2 test or Fisher’s
exact test were used to analyze the relationship between
ETV1 and COP1 expression and clinicopathological parameters. Survival curves were evaluated by the KaplanMeier method and compared using the log-rank test
between the positive and negative expression of ETV1 or
COP1 cases. Cox proportional hazard regression models
were used to evaluate the association of ETV1 and COP1
status with survival outcomes after adjusting for covariates. Forward: LR multivariate Cox regression analysis was
used to find independent prognostic factors. All statistical
tests were two sided and P < 0.05 was considered statistically significant.
Results
The expression level of ETV1 is inverse with COP1 in
clinical TNBC samples
We utilized qRT-PCR and western blotting to quantify
the expression levels of both ETV1 and COP1 in TNBC
Figure 1 ETV1 and COP1 expression levels in four pairs of
tumor (T) and normal (N) breast tissues were detected by
qRT-PCR (A, B) and western blotting (C). Data represented
relative mRNA expression levels (mean ± SEM) to one of the normal
samples. (Students t tests, *P < 0.05; **P < 0.01).
Ouyang et al. BMC Cancer
Page 5 of 10
Figure 2 Immunohistochemical staining of ETV1 and COP1 in human TNBC tissues. A, Positive expression of ETV1 in TNBC. B, Negative
expression of ETV1 in TNBC. C, Positive expression of COP1 in TNBC. D, Negative expression of COP1 in TNBC. E, Negative control of ETV1 or
COP1 in TNBC. Scale bar, 50 μm.
and pathological types had not been found to be associated with ETV1 or COP1 expression status. These results
suggest that both ETV1 and COP1 were aberrantly
expressed in TNBC tissues, and might influence the outcomes of patients.
Then, the proteins expression status of ETV1 or COP1
in TNBC tissues were investigated for associations with
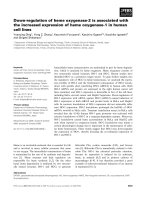
overall survival using Kaplan–Meier analysis, and logrank test for significance estimates. Figure 3A showed
that women with ETV1-positive tumors had a shorter
overall survival time than women with ETV1-negative
tumors (log-rank test, P < 0.05). However, compared to
tumors with negative COP1 expression, positive COP1 expression was correlated with a significant decrease of
breast cancer overall mortality during the follow-up period
(log-rank test, P < 0.001) (Figure 3B). Among women with
ETV1-positive tumors, the estimated 5-year and 10-year
TNBC specific overall survival was 62.8% and 7.0%, respectively, whereas among women with ETV1-negative
tumors, the rates were 100% and 81.3%, respectively
(Figure 3A). Meanwhile, among women with COP1positive tumors, the estimated 5-year and 10-year TNBC
specific overall survival was 100% and 95.7%, respectively,
and for women with COP1-negative tumors, the rates
were 59.8% and 0%, respectively (Figure 3B). In 79 ETV1positive tumors, COP1-positive cases showed significantly
higher survival rate than that of patients in the COP1negative group (log-rank test, P < 0.001) (Figure 3C and D).
The Kaplan–Meier curves and log-rank test showed that
women with ETV1-negative/COP1-positive tumors had
the best survival relative to women with the other subtypes
(log-rank test, P < 0.001) (Figure 3C and D). These results
Ouyang et al. BMC Cancer
Page 6 of 10
Table 2 Comparison between ETV1 and COP1 expression, and clinicopathologic parameters in 105 TNBC cases
Characteristics
χ2
ETV1
Negative
P
value
Positive
COP1
Negative
χ2
P
value
0.213
0.645
0.182
0.443
1.337
0.204
−7.466
0.024▲*
−10.405
0.006▲*
−11.590
0.000▲*
Positive
Age (y)
≤50
14
49
>50
12
30
≤2 cm
5
14
>2 cm
21
65
Invasive ductal carcinomas
21
72
Others
5
7
3
3
0.545
0.460
41
17
35
12
13
6
63
23
Tumor Size
0.535▲
−0.030
Pathological type
0.139▲
−2.078
69
24
7
5
2
4
TNM Stage
I
0.045▲*
−6.220
II
12
22
22
12
III
11
54
52
13
17
28
31
22
Lymph node metastasis
0-4
0.028▲*
−16.986
5-8
6
33
29
5
≥9
3
18
16
2
No
23
44
41
26
Yes
3
35
3
Relapse
*means P < 0.05; − means χ2 of Fisher exact test;
9.094
0.002
35
▲
means P value of Fisher exact test.
indicate that ETV1 is a poor prognostic factor, and COP1
is a favourable prognostic factor for TNBCs.
In multivariate Cox regression analysis, the Cox proportional hazards model was adjusted for age, pathological
type, TNM stage, number of lymph node metastasis, relapse, and tumor size. The results (Table 3) showed that
the COP1 and ETV1 expression status, and TNM stage
were significantly associated with patients overall survival.
However, patients’ age, the number of lymph nodes involved, tumor size and tumor relapse were not significantly
associated with overall survival. Furthermore, forward: LR
multivariate Cox regression analysis confirmed that ETV1
(RR = 1.502; 95% CI: 1.100 – 2.044; P < 0.05) and COP1
(RR = 0.650; 95% CI: 0.149 – 6.732; P < 0.001) expression
status were independent prognostic predictors of overall
survival of TNBC patients.
COP1 might suppress TNBC cell invasion, migration by
targeting ETV1
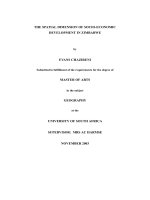
To further study the effect of COP1 on ETV1, we carried out the trials in a TNBC strain, MDA-MB-231 cell
line. First of all, we observed COP1 and ETV1 expression status in several breast cancer cell lines, and found
that breast cancer cell lines with relatively higher ETV1
expression displayed less COP1 abundance (Figure 4A).
We found that MDA-MB-231 cell had high expression
level of ETV1 and low expression of COP1. Thereafter,
we chose MDA-MB-231 cell line to perform further investigation. Our results showed that there was an inverse
relationship between COP1 and ETV1 expression. Overexpression of COP1 significantly decreased ETV1 protein level. COP1 knock-down or proteasome inhibition
with Bortezomib in the presence of COP1 notably increased ETV1 expression (Figure 4B and C). CCK8 assay
showed that siETV1 markedly decreased the cell proliferation while overexpression of COP1 did not influence
the cell proliferation of MDA-MB-231 (Figure 4D). To
substantiate the potential interaction between COP1 and
ETV1, we performed cancer cell invasion assays and
transwell assays using MDA-MB-231 cells. Results indicated that suppressing ETV1 expression or up-regulating
COP1 decreased the migration (Figure 4E) and invasion
(Figure 4F and G) ability of MDA-MB-231 cells. Rescue
of ETV1 expression in the presence of COP1 significantly recovered the invasion and migration capacity of
MDA-MB-231 cells. These results suggested that COP1
might suppress TNBC cell invasion and migration by targeting ETV1.
Ouyang et al. BMC Cancer
Page 7 of 10
Figure 3 Overall survival of patients with TNBCs according to ETV1 and COP1 protein expression statuses. A, Significant difference in
overall survival time was observed between ETV1-positive and ETV1-negative group (P < 0.001). B, COP1-positive TNBC patients had longer overall
survival time than that of COP1-negative TNBC patients (P < 0.001). C, In 26 cases of ETV1-negative TNBCs, COP1-positive cases had significant
higher survival rate than that of COP1-negative group (P < 0.001). D, In 79 cases of ETV1-positive TNBCs, COP1-positive cases had significant higher
survival rate than that of COP1-negative group (P < 0.001).
Discussion
ETV1 (also called ER81), is an oncogene for a variety of
human malignant diseases. Several lines of evidence showed
that ETV1 is aberrantly overexpressed in triple-negative
breast tumor cells or tissues, which presented the causative role of ETV1 in breast tumorigenesis [13,26,27]. Our
results revealed that ETV1 was predominantly overexpressed in TNBC tissues. Knock-down ETV1 could significantly depress invasion, migration and proliferation
behavior of MDA-MB-231 cells. These data are in good
accordance with the previous studies [13,26]. We found
that ETV1-positive expression was significantly correlated
with TNM stages of TNBCs, lymph node metastasis and
tumor relapse. Furthermore, our results showed that
women with ETV1-positive tumors had shorter survival
times than women with ETV1-negative tumors during the
period of follow-up, indicating that ETV1 might be a poor
predictor of TNBC prognosis. Multivariate analysis revealed that ETV1 was independent risk factor in predicting prognosis of TNBC patients. These results support an
earlier hypothesis that dysregulation of ETV1 might be
causally involved in breast tumorigenesis [27,28]. Of note,
it is well established that activation of ETV1 is regulated
by HER2/KIT-RAS-RAF-MEK-MAPK pathway [7,12,29].
Ouyang et al. BMC Cancer
Page 8 of 10
Table 3 Multivariate analysis of patients’ survival
Regression coefficient
SE
Relative risk (RR)
P
95.0% CI for RR
Lower
Upper
TNM stage
0.514
0.088
1.672
1.407
1.987
0.009*
Relapse
−0.780
0.586
0.458
0.145
1.446
0.183
Lymph node
0.434
0.406
1.544
0.696
3.425
0.285
ETV1
0.405
0.158
1.502
1.100
2.044
0.028*
COP1
−0.431
0.753
0.650
0.149
6.732
0.000*
Age
0.291
0.268
1.338
0.792
2.261
0.276
Tumor size
0.449
0.610
1.566
0.474
5.175
0.462
Pathological type
0.857
0.677
2.357
0.626
8.879
0.205
*For ETV1 or COP1, positive was labeled as 1, and negative was labeled as 0. Stage I, II, III were labeled as 1, 2, 3, respectively.
However, TNBC is lack of HER2. Whether transcriptional
activation of ETV1 in TNBCs is stimulated by KIT-RASRAF-MEK-MAPK or other pathways needs to be further
validated.
COP1 has been confirmed as a tumor suppressor in
series cancer diseases [18-20]. However, there is no report of COP1 referred to clinical TNBC cases. In our
study we found that COP1 expression in TNBC tissues
was obviously lower than that of normal breast tissues.
COP1 expression status was associated with TNM stages
of TNBCs, lymph node metastasis and tumor relapse.
Our data showed that overexpression of COP1 could depress invasion and migration capacity of MDA-MB-231
cells. Moreover, patients with COP1-positive tumors had
Figure 4 The potential function link between COP1 and ETV1 in MDA-MB-231 cells. A, Expression of ETV1 and COP1 in breast cancer cell
lines. B, MDA-MB-231 cells were infected with recombinant COP1 lentivirus (LV-COP1) or lentivirus with empty vector (LV-NC). LV-COP1 infected
cells were further transfected with siCOP1, a non-specific RNA (siNC) as a negative control. Western blotting showed inverse relationship between
COP1 and ETV1 expression. C, LVCOP1 infected MDA-MB-231 cells were treated with DMSO or 2 μM Bortezomib for 2 h and then subjected to
western blotting. D, MDA-MB-231 cells were transfected with siETV1 or siNC, or were infected with LV-NC or LV-COP1 for 72 h. Normal MDA-MB-231
cells were considered to be control group. CCK8 assay showed that siETV1 significantly decreased the cell proliferation while overexpression of COP1
did not influence the cell proliferation of MDA-MB-231. E-G, MDA-MB-231 cells were treated as showed in the figures and cultured for 48 h.
Cell migration and invasion assays were performed using cell culture inserts with PET membrane and BD matrigel invasion chamber, respectively.
Results indicated that suppressing ETV1 or up-regulating COP1 decreased the migration (E) and invasion (F, G) ability of MDA-MB-231 cells. Turnover
ETV1 expression in LV-COP1 infected cells partly rescued the migration and invasion function of cells. Scale bar, 100 μm. (Students t tests, ***P < 0.001
versus MDA-MB-231 control group; #P < 0.05, ##P < 0.01, versus LV-COP1 group).
Ouyang et al. BMC Cancer
longer survival times than COP1-negative cases, indicating that COP1 might be a favourable predictor of TNBC
prognosis. Furthermore, multivariate analysis demonstrated that COP1 was independent risk factor in predicting prognosis of the patients. These results suggest
that decrease of COP1 might be causatively involved in
TNBC tumorigenesis.
ETV1 is known to be degraded after being ubiquitinated by COP1 [17]. Therefore, loss of COP1 expression
or COP1 deficiency may be an important mechanism
that leads to overexpression of ETV1 in cancer, promoting tumorigenesis [18,22]. Truncated ETV1 lacking the
COP1 binding motifs were shown to be 50-fold more
stable than the wild-type ETV1. In addition, COP1 deficiency increased cell proliferation, hyperplasia, and early
prostate intraepithelial neoplasia by elevating ETV1 expression in mouse prostate [18]. In the present study, we
found that ETV1 abundance was inversely associated with
COP1 expression status, which is consistent with the previous reports [18,22]. To confirm their potential function
link, we constructed COP1 overexpression MDA-MB-231
strains by lentivirus infection. The results revealed that
up-regulation of COP1 led to significant reduction of
ETV1 in MDA-MB-231 cells, and refrained the cells invasion and migration capacity. Turnover ETV1 abundance
in recombinant COP1 lentivirus infected cells partly rescued the migration and invasion behaviours of the cells.
These results suggested that COP1 might suppress TNBC
cell invasion and migration by regulating ETV1. Escape of
ETV1 from COP1-mediated degradation could underlie
breast tumorigenesis [18,22]. Moreover, it has been confirmed that COP1 has other substrates besides ETV1
[17,18]. As a substrate of COP1, c-Jun was found to be
constitutively kept at low levels by COP1. Furthermore,
COP1 deficiency stimulated cell proliferation in a c-Jun–
dependent manner [19]. When expressed as a mutant,
COP1 could no longer interact with c-Jun [30]. In our
study, among ETV1-negative cases, women with COP1positive tumors had the most favourable survival compared
to women with the other subtypes. The results support the
hypothesis that COP1 might play a role in tumor suppression by degrading or ubiquitinating multiple substrates, besides ETV1. A conflicting report showed that COP1 acted
as an E3 ubiquitin ligase for p53 and inhibited p53dependent transcription and apoptosis [31,32]. However, a
recent study did not show increase of p53 abundance and
transcriptional activity in cells or tissues from COP1deficient mice [19]. Whether there are other interactive
molecules of COP1, and if so, their functional or pathogenic role in TNBC occurrence needs further investigation.
This study had several limitations. First, it was a retrospective study. Second, we did not employ an animal model
to confirm that COP1 might suppress TNBC cell invasion
and migration by targeting ETV1.
Page 9 of 10
Conclusions
In conclusion, we demonstrated that COP1 might be a
tumor suppressor by negatively regulating ETV1 in patients
with TNBC. For the first time we observed a favourable
prognosis in COP1-positive cases from a cohort of TNBC
patients. Our data suggest that COP1 and ETV1 may function as a pair of valuable independent prognostic biomarkers for TNBCs. Whether ETV1 and COP1 might be
effective therapeutic targets towards changing TNBC patient outcome is worth to be explored. Further investigation is essential to determine the concurrent status of
COP1 and the other two PEA3 factors in TNBCs.
Additional files
Additional file 1: Figure S1. Microphotographs of a representative
breast cancer case diagnosed as triple-negative. (A) Hematoxylin-Eosin
staining. (B–D) Immunohistochemical detection for ER, PR and HER-2,
respectively. It is obviously that this case is negative for ER, PR and HER-2.
Scale bar, 50 μm.
Additional file 2: Table S1. siRNA sequences used in this article. The
non-specific RNA (siNC) severed as a negative control are purchased from
Ribobio (Ribobio Co., China).
Additional file 3: Figure S2. Estimation of recombinant COP1 lentivirus
(LVCOP1) infection efficiency in MDA-MB-231 cells. (A) LVCOP1 infected
MDA-MB-231 was revealed by fluorescence microscopy via detecting the
expression of GFP. (B) The same location of Figure 1A was observed
under phase-contrast microscopy. (C) qRT-PCR and western blotting
showed that COP1 expression was significantly increased in MDA-MB-231
cells infected with LVCOP1. Scale bar, 100 μm. (Students t tests, ***P < 0.001
versus MDA-MB-231 control group).
Additional file 4: Figure S3. Detection of the efficiency of ETV1 siRNA
in MDA-MB-231 cells. Cells were transfected with siRNA against ETV1 or a
non-specific RNA (siNC) as a negative control. The efficiency of siRNA was
analyzed by qRT-PCR (A) and western blotting (B). Results showed that
siETV1 could significantly decreased the expression of ETV1. (Students
t tests, *P < 0.001 versus MDA-MB-231 control group).
Additional file 5: Figure S4. Detection of the transfection efficiency of
ETV1 expression vector in MDA-MB-231 cells. Full-length human ETV1
coding sequence was cloned into GV141 vector (GV141-ETV1). Cells were
transfected with ETV1 expression vector or an empty GV141 vector. The
efficiency of transfection was detected by qRT-PCR (A) and western
blotting (B). Results showed that the expression of ETV1 was significantly
up-regulated by GV141-ETV1. (Students t tests, **P < 0.05 versus
control group).
Additional file 6: Table S2. Primer sequences used in this article.
Abbreviations
COP1: Constitutive photomorphogenic 1; ETV1: ETS variant 1; TNBC: Triplenegative breast carcinoma; TNM: Tumor-node-metastasis; RR: Relative risk;
CI: Confidence interval.
Competing interests
The authors declare that they have no competing interests.
Authors’ contributions
WW and WS conceived and designed the study. WW supervised the project.
WH, LW, LJ, YC and CG participated in managing patients, collecting the
formalin-fixed and paraffin-embedded TNBC patient samples and related
clinic pathologic information. OM, WH and MJ carried out quantitative
real-time PCR assay, Western blotting analysis and the immunohistochemistry
assays. WH, BJ and MJ performed the statistical analysis. All authors were
involved in writing, review, and/or revision of the manuscript. All authors
read and approved the final manuscript.
Ouyang et al. BMC Cancer
Acknowledgements
This work was supported by a grant from the program of “One Hundred
Talented People” of Sun Yat-sen University (2009-80000-3126131), the Natural
Science Foundation of Guangdong Province (No. S2013010016539) and the
National Natural Science Foundation of China (No. 81072047). Funders had
no role in study design, data collection, analysis, decision to publish, or
preparation of the manuscript.
Author details
1
Laboratory of Department of Surgery, First Affiliated Hospital, Sun Yat-sen
University, 58 Zhongshan Rd II, Guangzhou, Guangdong 510080, People’s
Republic of China. 2Department of Clinical Laboratory, First Affiliated Hospital,
Sun Yat-sen University, 58 Zhongshan Rd II, Guangzhou, Guangdong 510080,
People’s Republic of China. 3Department of Vascular, Thyroid and Breast
Surgery, First Affiliated Hospital, Sun Yat-sen University, 58 Zhongshan Rd II,
Guangzhou, Guangdong 510080, People’s Republic of China.
Received: 19 September 2014 Accepted: 27 February 2015
References
1. Maegawa ROB, Tang S-C. Triple-negative breast cancer: unique biology and
its management. Cancer Investig. 2010;28:878–83.
2. Foulkes WD, Smith IE, Reis-Filho JS. Triple-negative breast cancer. N Engl J
Med. 2010;363:1938–48.
3. Hudis CA, Gianni L. Triple-negative breast cancer: an unmet medical need.
Oncologist. 2011;16 suppl 1:1–11.
4. Ismail-Khan R, Bui MM. A review of triple-negative breast cancer. Cancer
Control. 2010;17(3):173–6.
5. Podo F, Buydens LMC, Degani H, Hilhorst R, Klipp E, Gribbestad IS.
Triple-negative breast cancer: present challenges and new perspectives.
Mol Oncol. 2010;4:209–29.
6. Cheang MCU, Voduc D, Bajdik C, Leung S, McKinney S, Chia SK, et al. Basal-like
breast cancer defined by five biomarkers has superior prognostic value than
triple-negative phenotype. Clin Cancer Res. 2008;14:1368–76.
7. Oh S, Shin S, Janknecht R. ETV1, 4 and 5: an oncogenic subfamily of ETS
transcription factors. Biochim Biophys Acta. 1826;2012:1–12.
8. Brown TA, McKnight SL. Specificities of protein–protein and protein–DNA
interaction of GABP alpha and two newly defined ets-related proteins.
Genes Dev. 1992;6:2502–12.
9. Jeon IS, Davis JN, Braun BS, Sublett JE, Roussel MF, Denny CT, et al. A variant
Ewing's sarcoma translocation (7;22) fuses the EWS gene to the ETS gene
ETV1. Oncogene. 1995;10:1229–34.
10. Jané-Valbuena J, Widlund HR, Perner S, Johnson LA, Dibner AC, Lin WM,
et al. An oncogenic role for ETV1 in melanoma. Cancer Res. 2010;70
(5):2075–84.
11. Tomlins SA, Rhodes DR, Perner S, Dhanasekaran SM, Mehra R, Sun XW, et al.
Recurrent fusion of TMPRSS2 and ETS transcription factor genes in prostate
cancer. Science. 2005;310(5748):644–8.
12. Chi P, Chen Y, Zhang L, Guo X, Wongvipat J, Shamu T, et al. ETV1 is a
lineage survival factor that cooperates with KIT in gastrointestinal stromal
tumours. Nature. 2010;467:849–55.
13. Wang Y, Wang L, Chen Y, Li L, Yang X, Li B, et al. ER81 expression in breast
cancers and hyperplasia. Patholog Res Int. 2011;2011:980513–8.
14. Yun Z, Dai T, Wang S, Peng R, Li X, Qin T, et al. Overexpression of ETV4
protein in triple-negative breast cancer is associated with a higher risk of
distant metastasis. OncoTargets Ther. 2014;7:1733–42.
15. Dowdy SC, Mariani A, Janknecht R. HER2/Neu- and TAK1-mediated
up-regulation of the transforming growth factor beta inhibitor Smad7
via the ETS protein ER81. J Biol Chem. 2003;278:44377–84.
16. Papoutsopoulou S, Janknecht R. Phosphorylation of ETS transcription factor
ER81 in a complex with its coactivators CREB-binding protein and p300.
Mol Cell Biol. 2000;20(19):7300–10.
17. Marine JC. Spotlight on the role of COP1 in tumorigenesis. Nat Rev Cancer.
2012;12:455–64.
18. Vitari A, Leong KG, Newton K, Yee C, O’Rourke K, Liu J, et al. COP1 is a
tumour suppressor that causes degradation of ETS transcription factors.
Nature. 2011;474:403–8.
19. Migliorini D, Bogaerts S, Defever D, Vyas R, Denecker G, Radaelli E, et al.
Cop1 constitutively regulates c-Jun protein stability and functions as a
tumor suppressor in mice. J Clin Invest. 2011;121(4):1329–43.
Page 10 of 10
20. Shao J, Teng Y, Padia R, Hong S, Noh H, Xie X, et al. COP1 and GSK3β
cooperate to promote c-Jun degradation and inhibit breast cancer cell
tumorigenesis. Neoplasia. 2013;15(9):1075–85.
21. Wei W, Kaelin Jr WG. Good COP1 or bad COP1? In vivo veritas. J Clin Invest.
2011;121(4):1–3.
22. Baert JL, Monte D, Verreman K, Degerny C, Coutte L, de Launoit Y. The E3
ubiquitin ligase complex component COP1 regulates PEA3 group member
stability and transcriptional activity. Oncogene. 2010;29:1810–20.
23. Zurrida S, Veronesi U. A new TNM classification for breast cancer to meet
the demands of he present and the challenges of the future. Women's
Health. 2011;7(1):41–9.
24. Lee HS, Cho SB, Lee HE, Kim MA, Kim JH, Park do J, et al. Protein expression
profiling and molecular classification of gastric cancer by the tissue array
method. Clin Cancer Res. 2007;13:4154–63.
25. Sun B, Zhang S, Zhang D, Li Y, Zhao X, Luo Y, et al. Identification of
metastasis-related proteins and their clinical relevance to triple-negative
human breast cancer. Clin Cancer Res. 2008;14:7050–9.
26. Baert J-L, Monte D, Musgrove EA, Albagli O, Sutherland RL, Launoit Y.
Expression of the PEA3 group of ETS-related transcription factors in human
breast-cancer cells. Int J Cancer. 1997;70:590–7.
27. Trimble MS, Xin JH, Guy CT, Muller WJ, Hassell JA. PEA3 is overexpressed in
mouse metastatic mammary adenocarcinomas. Oncogene. 1993;8(11):3037–42.
28. Shin S, Bosc DG, Ingle JN, Spelsberg TC, Janknecht R. Rcl is a novel ETV1/ER81
target gene upregulated in breast tumors. J Cell Biochem. 2008;105:866–74.
29. Holbro T, Civenni G, Hynes NE. The ErbB receptors and their role in cancer
progression. Exp Cell Res. 2003;284:99–110.
30. Wertz IE, O’Rourke KM, Zhang Z, Dornan D, Arnott D, Deshaies RJ, et al.
Human De-etiolated-1 regulates c-Jun by assembling a CUL4A ubiquitin
ligase. Science. 2004;303(5662):1371–4.
31. Dornan D, Bheddah S, Newton K, Ince W, Frantz GD, Dowd P, et al. COP1,
the negative regulator of p53, is overexpressed in breast and ovarian
adenocarcinomas. Cancer Res. 2004;64:7226–30.
32. Dornan D, Wertz I, Shimizu H, Arnott D, Frantz GD, Dowd P, et al. The
ubiquitin ligase COP1 is a critical negative regulator of p53. Nature.
2004;429:86–92.
Submit your next manuscript to BioMed Central
and take full advantage of:
• Convenient online submission
• Thorough peer review
• No space constraints or color figure charges
• Immediate publication on acceptance
• Inclusion in PubMed, CAS, Scopus and Google Scholar
• Research which is freely available for redistribution
Submit your manuscript at
www.biomedcentral.com/submit