A population-based study of breast cancer prevalence in Australia: Predicting the future health care needs of women living with breast cancer
Bạn đang xem bản rút gọn của tài liệu. Xem và tải ngay bản đầy đủ của tài liệu tại đây (901.62 KB, 9 trang )
Yu et al. BMC Cancer 2014, 14:936
/>
RESEARCH ARTICLE
Open Access
A population-based study of breast cancer
prevalence in Australia: predicting the future
health care needs of women living with
breast cancer
Xue Qin Yu1,2*, Roberta De Angelis3, Qingwei Luo1, Clare Kahn1, Nehmat Houssami2 and Dianne L O’Connell1,2,4,5
Abstract
Background: Breast cancer places a heavy burden on the Australian healthcare system, but information about the
actual number of women living with breast cancer and their current or future health service needs is limited. We
used existing population-based data and innovative statistical methods to address this critical research question in
a well-defined geographic region.
Methods: Breast cancer data from the New South Wales (NSW) Central Cancer Registry and PIAMOD (Prevalence
and Incidence Analysis MODel) software were used to project future breast cancer prevalence in NSW. Parametric
models were fitted to incidence and survival data, and the modelled incidence and survival estimates were then
used to estimate current and future prevalence. To estimate future healthcare requirements the projected
prevalence was then divided into phases of care according to the different stages of the survivorship trajectory.
Results: The number of women in NSW living with a breast cancer diagnosis had increased from 19,305 in 1990 to
48,754 in 2007. This number is projected to increase further to 68,620 by 2017. The majority of these breast cancer
survivors will require continued monitoring (31,974) or will be long-term survivors (29,785). About 9% will require
active treatment (either initial therapy, or treatment for subsequent metastases or second cancer) and 1% will need
end of life care due to breast cancer.
Conclusions: Extrapolating these projections to the national Australian population would equate to 209,200
women living with breast cancer in Australia in 2017, many of whom will require active treatment or post-treatment
monitoring. Thus, careful planning and development of a healthcare system able to respond to this increased demand
is required.
Keywords: Breast cancer, Cancer survivorship, Cancer prevalence, Incidence, Statistical projection, Epidemiology,
Australia
Background
Breast cancer is currently the most common cancer
among women worldwide [1], and is expected to remain
so in the foreseeable future [2,3]. In Australia, the risk of
a woman developing breast cancer before the age of 85
is 1 in 8 [4], and the number of new diagnoses is
* Correspondence:
1
Cancer Research Division, Cancer Council New South Wales, Sydney,
Australia
2
Sydney School of Public Health, University of Sydney, Sydney, Australia
Full list of author information is available at the end of the article
expected to continue to increase in the future [5]. Fortunately however, advances in diagnosis and treatment
mean that breast cancer survival is now very high [6]:
the 5-year relative survival in Australian women was
89.4% in 2006–2010, and for those diagnosed with small
tumours (the majority of the screen-detected tumours)
5-year relative survival was over 98% [4]. As a consequence of these trends of rising incidence and survival,
it is almost certain that the number of Australian
women living with breast cancer will keep increasing in
the near future. Understanding the health-care needs of
© 2014 Yu et al.; licensee BioMed Central Ltd. This is an Open Access article distributed under the terms of the Creative
Commons Attribution License ( which permits unrestricted use, distribution, and
reproduction in any medium, provided the original work is properly credited. The Creative Commons Public Domain
Dedication waiver ( applies to the data made available in this article,
unless otherwise stated.
Yu et al. BMC Cancer 2014, 14:936
/>
this growing population and the subsequent demands on
health-care will enable better allocation of resources and
the provision of better care, and is therefore of increasing importance.
Despite these predictions, there is currently only very
limited information available about breast cancer prevalence and the current or future health service needs of
breast cancer patients in Australia. Information available
tends to be restricted to the number of prevalent cancer
patients at a past date [7,8], which is of limited use in
predicting future health service requirements. Current
and future estimates of prevalence would be more useful
for health service planning, but as estimating cancer
prevalence is a complex process, reliant on accurate incidence and survival modelling, this information is rarely
available.
Predicting future breast cancer health service needs is
further complicated by the widely varied treatment and
follow-up requirements of these women [9,10]. The
population of survivors consists of individuals with varying needs: some may be in remission (needing follow-up
care and surveillance), others may be receiving primary
treatment after initial diagnosis, while others may be receiving treatment for metastases and some may be dying
from breast cancer. Thus, estimates of cancer prevalence
for relatively homogeneous populations of survivors defined by phase of the disease and who are likely to have
similar healthcare needs would be informative for health
service planning purposes. The aim of this study was to
estimate the number of women living with breast cancer
in Australia at different phases of the disease trajectory,
and to predict their current and future health service
needs.
Methods
Overview
There were three principal activities involved in this
study: the estimation and projection of the prevalence of
breast cancer, the analysis of phase of care prevalence,
and the estimation of additional care needs for women
with disease progression or second breast cancer. The
data and methods involved in each of these activities will
be described in detail below. In brief, to estimate and
project complete prevalence of breast cancer we used the
PIAMOD software (Prevalence and Incidence Analysis
MODel) [11], with the primary input being first primary
breast cancer incidence data for cases diagnosed in
New South Wales (NSW) Australia. We then divided the
estimated complete prevalence into four phases of care according to the different stages of the survivorship trajectory, and finally incidence data for subsequent metastases
or second primary breast cancer were used to estimate the
future prevalence of such events and the associated
additional treatment requirements.
Page 2 of 9
Ethics statement
This study involves analysis of routinely collected data
and the records were de-identified (name, address,
date of birth had been removed) before being provided
to the research team. The ethics committee waived the
conditions for consent because it is impracticable to
seek consent as a large proportion of the individuals
would likely have moved or died since their diagnosis
of cancer which could be up to 40 years ago. Ethics
approval was obtained from the NSW Population and
Health Service Research Ethics Committee (reference
number: 2009/03/139).
Estimation and projection of prevalence
The PIAMOD software was used to estimate the observed prevalence (1972–2007) and project future prevalence (2008–2017). The PIAMOD method, described in
detail by Verdecchia et al. [11], estimates and projects
cancer prevalence and mortality through transition rate
equations that relate prevalence and mortality to incidence and relative survival functions. It has been used to
estimate and project cancer prevalence for many populations [3,12-16]. The input files required by PIAMOD are
population data, all-cause mortality, cancer-specific incidence and model-based survival estimates.
Incidence data for first primary female breast cancer
(ICD-O3 C50) [17] diagnosed in 1972–2007 were extracted from the NSW Central Cancer Registry database.
We included cases aged 18–84 years at diagnosis, and
excluded cases who were reported to the registry
through death certificate only, or who were first identified post-mortem. All-cause mortality data for NSW by
single year of age (up to 84 years old), and calendar year
(1972–2007), and corresponding mid-year NSW residential female population data by single year of age and calendar year were obtained from the Australian Bureau of
Statistics.
Modelling incidence data
Age, period and cohort (APC) models were fitted to
the incidence data using a log-linear regression model
implemented in the PIAMOD software. Nine relatively
simple models (APC101, 102, 201, 202, 103, 301, 203,
302 and 303) were fitted and the most appropriate
model was selected based on the likelihood ratio statistic (LRS) combined with knowledge of the epidemiology of breast cancer in Australia. The parameters of
the chosen APC model were estimated using observed
incidence for 1972–2007 and then this model was
used for forward (after 2007) and backward (before
1972) projections. The resulting fitted incidence estimates were used as inputs for estimating future prevalence (for 2008–2017).
Yu et al. BMC Cancer 2014, 14:936
/>
Page 3 of 9
Modelling survival data
Validation of PIAMOD estimates
Incident cases were followed up for survival status to 31
December 2007 (the most recent data available to us)
through record linkage of the cancer cases in the Cancer
Registry with the death records from the NSW Register
of Births, Deaths and Marriages and the National Death
Index. A two-step procedure was used to model the
survival data. First, relative survival was estimated and
tabulated, and then a mixture cure model was fitted to
the tabulated relative survival estimates. Relative survival
was tabulated using the Pohar Perme actuarial estimator
[18], with the classic cohort approach for five calendar
periods of diagnosis (1972–1980, 1981–1989, 1990–1995,
1996–2001, 2002–2007) and three age groups (18–49, 50–
69, and 70–84 years). A mixture cure model was fitted to
these tabulated survival data [19], and the survival
estimates obtained from the model were then projected
backward assuming a constant trend before 1972 and extrapolated forwards for 2008–2017 assuming that cancer
survival trends will continue as previously observed. The
model-based estimates of survival from the mixture cure
model were used as inputs into PIAMOD for the next step
of the analysis.
A validation of the overall estimation procedure was performed using external data that were not used in the
modelling. In this case we compared the expected breast
cancer mortality derived by PIAMOD with the observed
mortality in NSW. This offers an overall validation of
both the incidence APC model and of the relative survival function. Good agreement between the expected
mortality and the observed mortality means that the
relative survival function correctly modulates the relationship between incidence and mortality.
Prevalence estimation
Using the PIAMOD software and the prepared input
data for the estimated incidence and survival, as well
as all-cause mortality and population data we were
then able to calculate the prevalence of first primary
breast cancer for 1972–2007 and to estimate the future prevalence for 2008–2017. Because PIAMOD can
only provide results for closed age groups and populations, and as the available data for the older population were grouped for those aged 85 years and
over, our prevalence estimates include cases up to age
84 years only. Population projections after 2007 were
derived in PIAMOD by assuming birth rate and mortality for causes other than the specific cancer to be
stable over time [11].
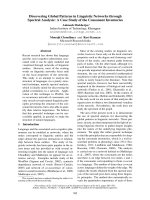
Figure 1 Pathways of the breast cancer survivorship journey.
Phase of care analysis
The estimated complete prevalence was decomposed into
four primary phases of care according to time since diagnosis, year of death and cause of death. These phases of
care were the initial care phase, the post-treatment monitoring phase, long-term survivors and the last year of life
phase, as illustrated in Figure 1.
The initial care phase was defined as care provided in
the first 12 months after diagnosis (excluding cases who
died within the first year after diagnosis). The post-treatment monitoring phase was defined as the period after
initial care and before being considered a long-term
survivor.
The definition of long-term survivors varies in the literature and across cancer types. Long-term survivors are
often considered to be cancer patients who have lived
beyond 5 years after diagnosis [20-22], but the patterns
of breast cancer survival and recurrence indicate that a
longer time since diagnosis may be more appropriate
for defining long term survival of breast cancer. Thus,
similar to other researchers [23], we defined long-term
survivors as those who survived at least 10 years after
diagnosis.
The last year of life phase was defined as the last
12 months of life for those who died of breast cancer.
Cases with short survival (less than 12 months) were
considered to be in the last year of life phase. We used
Yu et al. BMC Cancer 2014, 14:936
/>
information on cause of death to identify those patients
who had died from breast cancer in a given year, and
who would therefore be in the last year of life phase of
care in that year. Future numbers of cases in the last
year of life phase for 2008–2017 were determined by the
projected breast cancer mortality trend (derived from
PIAMOD method).
In addition to these four primary phases of care, an
additional sub-phase of care (treatment for metastases/
second cancer) was created to account for cases in the
post-treatment monitoring and long-term survivor phases
who require more treatment at some point during followup due to tumour spread or the development of a second
breast cancer.
Estimation and projection of metastases or second
primary breast cancer
Cases diagnosed with first primary breast cancer in
1972–2007 were followed up for subsequent metastatic
spread or second breast cancer to the end of 2007.
The development of metastases was identified using
subsequent notifications from 120 days after the first
diagnosis. As it is challenging to identify and accurately distinguish between subsequent metastases and
second primaries using population datasets, and it is
likely that all such cases will require further treatment,
we combined the counts of second breast cancer and
metastatic tumours.
To estimate the number of these events in the future,
we first calculated the proportion of cases in the posttreatment monitoring and long-term survivor phases
who presented with subsequent metastasis or second
breast cancer in 2006. We then applied this proportion
to the number of projected cases in the post-treatment
monitoring and long-term survivor phases in 2008–
2017. Those patients who survived at least one year after
the diagnosis of subsequent metastases or new primary
breast cancer were categorised into the treatment for
metastases/second cancer phase. Those who died within
one year after the diagnosis of a metastases or new primary breast cancer were considered to be in the last year
of life phase.
While each patient can contribute to more than one
phase of care over time, at any one specific point in
time a patient can only be in one phase of care in the
analysis.
Results
Incidence trends
A total of 89,768 cases of first primary breast cancer diagnosed in 1972–2007 were included in the incidence
and prevalence analyses. The observed incidence trend
can be summarised with four different patterns: a relatively stable period (1972–1985), a moderate increase
Page 4 of 9
(1986–1992), a more rapid increase (1993–1995), and
then stabilisation at a high level after 1996. During the
more stable period from 1996 there are a few fluctuations in incidence, likely due to random variation and
the reduction in hormone-replacement therapy use that
occurred in Australia [24,25], and in many other developed countries [26], after the publication in 2002 of the
results of the Women’s Health Initiative randomised trial
[27]. The increased incidence between 1985 and 1996
was most likely the result of mammographic screening,
with informal screening occurring between 1985 and
1992 [28] and a population-based screening program introduced in NSW from 1992 [29] (Figure 2). We plotted
the estimated incidence from nine APC models against
the observed incidence (Figure 2). Based on national
breast cancer projections [4] and more recent NSW data
[30], the APC model 303 (age3 and cohort3) was considered to be the most appropriate model with which to
project incidence for 2008–2017. This was supported by
model 303’s much smaller LRS value than those of APC
models 203 and 302 (Additional file 1), which indicates
that it is a better fitting model. Thus, estimated and projected incidence from this model (shown in Figure 3)
were used as inputs for the projection of prevalence.
Survival trends
Observed and fitted five-year breast cancer relative
survival trends over time (assuming a constant trend
before 1972 and dynamic trend after 2007) are shown
in Figure 4. It can be seen that survival improved
markedly from 1985 to 1997, followed by a slower increasing trend after 1997.
Validation of PIAMOD incidence and survival estimates
Validation of the chosen APC incidence model and the
modelled relative survival estimates (Figure 5) indicates
that the APC model fitted the observed incidence data
well, which is supported by the reasonably good agreement of the expected mortality with the observed
mortality.
Projected prevalence
Since 1990, the number of breast cancer survivors aged
18–84 years in NSW has increased over 150%; from
19,305 in 1990, to 35,538 in 2000, and then to 48,754 in
2007. This number is projected to increase further to
reach 68,620 in 2017, with an annual rate of increase
of 4.07% (Table 1) from 2007 to 2017. The expected
increase in the number of prevalent cases was greatest
for the oldest age group, with a 61.7% increase from
2007 to 2017. Those aged 50–69 years showed an expected 40.9% increase. The effect of population ageing
can also be seen in Table 1: the youngest age group
made up about 13% of the total prevalent cases in
Yu et al. BMC Cancer 2014, 14:936
/>
Page 5 of 9
Figure 2 Comparison of Age-Period-Cohort incidence models and observed age-standardised incidence rates for breast cancer in
NSW Australia.
2007, but this proportion is expected to decrease to
8% by 2017, while the proportion of prevalent cases
aged 50–69 years is expected to remain unchanged
over the same period.
Estimates of phase of care prevalence in 2017 are presented in Table 2, and show that the majority of breast
cancer survivors in 2017 will require post-treatment
monitoring (31,974) or will be long-term survivors
(29,785) who will need relatively less intensive follow-up.
Age-specific estimates indicate that the majority of the
cohort (54%) will be those aged 50–69 years and the largest single group will be those under post-treatment
monitoring aged 50–69 years, representing 28% of the
total cohort in 2017.
Figure 3 Observed breast cancer incidence in NSW Australia for 1972–2007, and projected incidence for 2008–2017.
Yu et al. BMC Cancer 2014, 14:936
/>
Page 6 of 9
Figure 4 Comparison of fitted five-year breast cancer relative survival with observed for 1972–2007 and projected survival for
2008–2017 in NSW Australia.
Care for subsequent metastases or second breast cancer
Among the 89,768 women diagnosed with first primary
breast cancer between 1972 and 2007 in NSW, there
were 13,585 women (15.1%) who developed metastatic
disease by the end of 2007. In addition, 9390 women
had a second primary breast cancer. After excluding
those who died within 12 months of the diagnosis of either second primary or metastatic disease, 491 (2.1%)
women in post-treatment monitoring and 292 (1.5%)
long-term survivors in 2006 would require additional
treatment for their metastases or second primaries.
Thus, by applying these two estimated proportions to
the numbers of projected cases in the post-monitoring
and long-term survivor phases in 2017, it is estimated
that 1122 women would need further treatment due to
their metastases/second primaries in 2017 (Table 2).
Figure 5 Comparison of fitted crude breast cancer incidence and mortality with observed crude incidence and mortality for
1972–2007 and projected incidence and mortality for 2008–2017 in NSW Australia.
Yu et al. BMC Cancer 2014, 14:936
/>
Page 7 of 9
Table 1 Age and year-specific estimates of prevalence of
breast cancer in NSW Australia
Year
Number (%) of woman living with breast cancer
<50 years
50-69 years
70-84 years
Total
2007
6204
(12.7%)
26,265
(53.9%)
16,285
(33.4%)
48,754
2011
5774
(10.5%)
29,881
(54.3%)
19,373
(35.2%)
55,028
2013
5609
(9.4%)
32,606
(54.9%)
21,185
(35.7%)
59,400
2015
5420
(8.5%)
35,062
(54.9%)
23,429
(36.7%)
63,912
2017
5292
(7.7%)
37,003
(53.9%)
26,325
(38.4%)
68,620
Discussion
By estimating current breast cancer prevalence and providing projections of this prevalence in the future, this
study fills a gap in Australian cancer research and provides a broad measure of the future health care needs of
women with breast cancer in Australia. Our projected
trends in prevalence indicate that the number of women
living with breast cancer in NSW will increase by more
than 40% from 2007 to 2017. Extrapolating these projections to the national Australian population would equate
to 209,200 women living with a previous breast cancer
diagnosis in 2017, many of whom will require treatment
or post-treatment monitoring and related care [9,10].
This information is useful for health policy makers and
health service planners, ensuring that planning for future
cancer care requirements is guided by appropriate evidence. It is also relevant to clinicians who provide care
to breast cancer survivors throughout these phases, and
may be of interest to the increasing population of breast
cancer survivors.
Our prevalence estimate for 2007 in NSW using the
direct counting method (1435 per 100,000) was consistent with the most updated national breast cancer prevalence estimate (1416 per 100,000) in 2007 reported by
the Australian Institute of Health and Welfare (AIHW)
[7]. The small difference between these estimates is
likely to be because the AIHW used 26-year prevalence
while ours was an estimate of 36-year prevalence. The
similar definition of prevalence used in our study and
the AIHW report (persons with multiple cancers being
only counted once in the calculation) and the overall
consistency of our prevalence estimate for 2007 (the
most recent data available to us) with the most updated
national breast cancer prevalence [7] provides indirect
confirmation of our estimate. However, our study extended these results by using a valid statistical model
(PIAMOD) to project future prevalence, which is more
useful for health service planning for cancer patients.
Studies of breast cancer prevalence in the United
States (USA) using SEER data have reported projected
increases in prevalence comparable to our results, with
the number of women with breast cancer in the USA expected to increase by an annual rate of 3.11% from 2010
to 2020 [3]. It is not surprising that these results are
similar, as the main factor in breast cancer prevalence
modelling is the incidence rate, and in both our study
and the USA study incidence rates were predicted to remain at the current high level in the foreseeable future
[31]. Also, the population age structures of the USA and
Australia are broadly similar [32], and this is another important contributor to prevalence estimates.
This study is unique in its inclusion of data on subsequent cancer spread and second breast cancers to allow
for the projection of prevalence according to phase of
care. These two groups of patients with distant metastases or a new primary breast cancer constitute over 1100
women who will require active cancer treatment in 2017
in NSW, so it is essential that they be included when estimating future prevalence to inform cancer care needs.
Furthermore, it is possible that due to the issue of incomplete episode data the reported number of patients
with subsequent metastatic disease is an under estimate of
the true figure [15,33]. Data on cancer spread after initial
diagnosis are not routinely collected by population-based
cancer registries worldwide, but where possible the use of
such data in research is a useful step towards providing
clinically relevant information for patients, clinicians
and health policy makers. Our results also provide
some support for the ongoing surveillance of breast
cancer survivors given the observed numbers with
subsequent metastases from the first cancer and the
Table 2 Estimated numbers of women living with breast cancer in NSW Australia in 2017 by phases of care and age
group
Phase of care
Number (%) of breast cancer survivors
<50 years
Initial care
Post-treatment monitoring
50-69 years
788
(14.9%)
2881
3531
(66.7%)
19,171
14,031
Long-term survivor
807
(15.2%)
Last year of life care
77
(1.5%)
Subsequent metastases /second tumour
Total
336
70-84 years
Total
(7.8%)
1296
(4.9%)
(51.8%)
9272
(35.2%)
31,974
(37.9%)
14,947
(56.8%)
29,785
(0.9%)
361
(1.4%)
4965
774
89
(1.7%)
584
(1.6%)
449
(1.7%)
1122
5292
(8.0%)
37,003
(54%)
26,325
(38%)
68,620
(7.2%)
(46.6%)
(43.4%)
(1.1%)
(1.6%)
(100%)
Yu et al. BMC Cancer 2014, 14:936
/>
emergence of second breast cancers, although also
noting that these represented a modest proportion of
women living with breast cancer. Oncologists and
clinical researchers may be interested in our projected
increased proportion of older breast cancer survivors,
a group typically not included in clinical trials, and
might consider expanding age criteria for current and
future clinical trials.
Cancer prevalence is a function of cancer incidence
and survival. As indicated by our model, the number of
new breast cancer diagnoses will keep rising in the future (although the rates had started to stabilise), and survival is likely to continue to show some improvement,
meaning that prevalence will inevitably also increase in
the future. Our assumptions of future incidence and survival trends appear to be reasonable as they were based
on 36 years of data and our understanding of the epidemiology of breast cancer in Australia. Our validation
using external mortality data suggests that our projections for incidence and survival are likely to be appropriate (Figure 5). Most international studies, including
those from the UK, Europe and the USA, indicated an
increase in breast cancer prevalence in the future
[2,3,34]. Therefore, these projections are likely to be
relatively reliable, although as with all statistical predictions some uncertainties will remain.
While we have attempted to provide a robust estimation of breast cancer prevalence by phase of care we are
aware that there are several limitations to this study.
First, the PIAMOD software does not provide measures
of uncertainty for projections of relative survival, population size and mortality, so we cannot assess the potential range of results. Second, not all changes in trends of
cancer incidence and survival can be fully captured by
our models, particularly for survival data (that even
10 years after diagnosis the probability of survival does
not reach that of the general population) [35,36]. However, different assumptions of future survival trends only
had a small impact on the predicted prevalence (data
not shown) because survival has less room for further
improvement (five-year relative survival being over 90%).
Third, we are aware that our projections are likely to
underestimate future prevalence because we did not include cases aged 85 years or over (approximately 4% of
the total patient population). We were unable to include
these older cases because the PIAMOD software can
only provide estimates for 1-year age groups, while the
population was grouped as 85 years and over. Finally, although the phases of care definition used here is useful
to infer future health care needs, the phases are often
not as discrete as the categories imply, and some of
them are cross-cutting, so that there are actually many
different possible pathways cancer patients may experience from diagnosis to survival or end of life.
Page 8 of 9
Conclusions
As the Australian population ages the number of women
living with breast cancer will increase, and consequently
demands on health care services will also increase. In
order to ensure adequate access to quality care for all future patients, careful planning and development of a
healthcare system able to respond to this increased demand is required. Such preparation is critical, especially
as the consequences of not providing appropriate cancer
care and follow-up are already becoming apparent [37],
and indeed, any shortfall in the oncology workforce
could threaten the quality of patient care and safety [38].
In addition, a major investment in the infrastructure required to deliver cancer care is needed [39], and the rapidly increasing cost of cancer care must also be
considered. A 27% increase in the national cost of cancer
care was projected from 2010 to 2020 in the USA, with
the largest increases being for female breast cancer and
prostate cancer [3]. Australia must begin to consider
how it will afford to provide quality cancer care for a
large and increasing cancer survivor population in the
future.
Additional file
Additional file 1: Appendix Evaluation of the model-fit for
age-period-cohort models for breast cancer incidence in NSW
Australia 1972-2007.
Abbreviations
PIAMOD: Prevalence and Incidence Analysis MODel; NSW: New South Wales;
APC: age-period-cohort; LRS: likelihood ratio statistic; SEER: Surveillance,
Epidemiology, and End Results program; AIHW: Australian Institute of Health
and Welfare.
Competing interests
The authors declare that they have no competing interests.
Authors’ contributions
XQY and DO’C conceived the project; RDA provided technical advice/
support on the study design and data analysis; XQY led the project; QL
performed the data analysis, XQY provided oversight of the data analysis
with inputs from RDA and DO’C; XQY drafted the manuscript with important
inputs from CK; RDA, QL, CK, NH and DO’C revised the manuscript. All
authors read and approved the final version of the manuscript.
Acknowledgements
We would like to thank the NSW Central Cancer Registry for providing the
data for the study. Xue Qin Yu was supported by an Australian National
Health & Medical Research Council Training Fellowship (Ref: 550002).
Nehmat Houssami is supported by a National Breast Cancer Foundation
(NBCF Australia) Practitioner Fellowship.
Author details
1
Cancer Research Division, Cancer Council New South Wales, Sydney,
Australia. 2Sydney School of Public Health, University of Sydney, Sydney,
Australia. 3Centro Nazionale di Epidemiologia Sorveglianza e Promozione
della Salute (CNESPS), Istituto Superiore di Sanità, Rome, Italy. 4School of
Public Health and Community Medicine, University of NSW, Sydney, Australia.
5
School of Medicine and Public Health, University of Newcastle, Newcastle,
Australia.
Yu et al. BMC Cancer 2014, 14:936
/>
Received: 8 September 2014 Accepted: 6 December 2014
Published: 11 December 2014
References
1. Jemal A, Bray F, Center MM, Ferlay J, Ward E, Forman D: Global cancer
statistics. CA Cancer J Clin 2011, 61(2):69–90.
2. Maddams J, Utley M, Moller H: Projections of cancer prevalence in the
United Kingdom, 2010–2040. Br J Cancer 2012, 107(7):1195–1202.
3. Mariotto AB, Yabroff KR, Shao Y, Feuer EJ, Brown ML: Projections of the
cost of cancer care in the United States: 2010–2020. J Natl Cancer Inst
2011, 103(2):117–128.
4. Australian Institute of Health and Welfare & Cancer Australia: Breast Cancer
in Australia: An Overview. Australia AIoHaWC: AIHW; 2012.
5. Australian Institute of Health and Welfare: Cancer incidence projections:
Australia, 2011 to 2020, In. vol. Cancer Series no. 66. Cat. No. CAN 62.
Canberra.
6. Yu XQ, O’Connell DL, Gibberd RW, Coates AS, Armstrong BK: Trends in
survival and excess risk of death after diagnosis of cancer in 1980–1996
in New South Wales, Australia. Int J Cancer 2006, 119(4):894–900.
7. Australian Institute of Health and Welfare: Cancer survival and prevalence
in Australia: period estimates from 1982 to 2010. Asia Pac J Clin Oncol
2013, 9(1):29–39.
8. Brameld KJ, Holman CD, Threlfall TJ, Lawrence DM, De Kierk NH: Increasing
‘active prevalence’ of cancer in Western Australia and its implications for
health services. Aust N Z J Public Health 2002, 26(2):164–169.
9. Brennan ME, Houssami N: Overview of long term care of breast cancer
survivors. Maturitas 2011, 69(2):106–112.
10. McCabe MS, Faithfull S, Makin W, Wengstrom Y: Survivorship programs
and care planning. Cancer 2013, 119(Suppl 11):2179–2186.
11. Verdecchia A, De Angelis G, Capocaccia R: Estimation and projections
of cancer prevalence from cancer registry data. Stat Med 2002,
21(22):3511–3526.
12. Parry C, Kent EE, Mariotto AB, Alfano CM, Rowland JH: Cancer survivors:
a booming population. Cancer Epidemiol Biomarkers Prev 2011,
20(10):1996–2005.
13. Simonetti A, Gigli A, Capocaccia R, Mariotto A: Estimating complete
prevalence of cancers diagnosed in childhood. Stat Med 2008,
27(7):990–1007.
14. Verdecchia A, De Angelis R, Francisci S, Grande E: Methodology for
estimation of cancer incidence, survival and prevalence in Italian
regions. Tumori 2007, 93(4):337–344.
15. Yu XQ, Clements M, O’Connell D: Projections of cancer prevalence by
phase of care: a potential tool for planning future health service needs.
J Cancer Surviv 2013, 7(4):641–651.
16. Yu XQ, Smith DP, Clements MS, Patel MI, McHugh B, O’Connell DL:
Projecting prevalence by stage of care for prostate cancer and
estimating future health service needs: protocol for a modelling study.
BMJ Open 2011, 1(1):e000104.
17. Fritz A, Percy C, Jack A, Shanmugaratnam K, Sobin L, Parkin D, Whelan S
(Eds): International Classification of Diseases for Oncology. 3rd edition.
Geneva, Switzerland: World Health Organisation; 2000.
18. Perme MP, Stare J, Esteve J: On estimation in relative survival. Biometrics
2012, 68(1):113–120.
19. Verdecchia A, De Angelis R, Capocaccia R, Sant M, Micheli A, Gatta G,
Berrino F: The cure for colon cancer: results from the EUROCARE study.
Int J Cancer 1998, 77(3):322–329.
20. Khan NF, Carpenter L, Watson E, Rose PW: Cancer screening and
preventative care among long-term cancer survivors in the United
Kingdom. Br J Cancer 2010, 102(7):1085–1090.
21. Smith SL, Singh-Carlson S, Downie L, Payeur N, Wai ES: Survivors of breast
cancer: patient perspectives on survivorship care planning. J Cancer
Surviv 2011, 5(4):337–344.
22. Soerjomataram I, Louwman MW, Ribot JG, Roukema JA, Coebergh JW:
An overview of prognostic factors for long-term survivors of breast
cancer. Breast Cancer Res Treat 2008, 107(3):309–330.
23. Hsu T, Ennis M, Hood N, Graham M, Goodwin PJ: Quality of life in long-term
breast cancer survivors. J Clin Oncol 2013, 31(28):3540–3548.
24. Canfell K, Banks E, Clements M, Kang YJ, Moa A, Armstrong B, Beral V:
Sustained lower rates of HRT prescribing and breast cancer incidence in
Australia since 2003. Breast Cancer Res Treat 2009, 117(3):671–673.
Page 9 of 9
25. Canfell K, Banks E, Moa AM, Beral V: Decrease in breast cancer incidence
following a rapid fall in use of hormone replacement therapy in
Australia. Med J Aust 2008, 188(11):641–644.
26. Zbuk K, Anand SS: Declining incidence of breast cancer after decreased
use of hormone-replacement therapy: magnitude and time lags in
different countries. J Epidemiol Community Health 2012, 66(1):1–7.
27. Rossouw JE, Anderson GL, Prentice RL, LaCroix AZ, Kooperberg C, Stefanick
ML, Jackson RD, Beresford SA, Howard BV, Johnson KC, Kotchen JM, Ockene
J, Writing Group for the Women’s Health Initiative Investigators: Risks and
benefits of estrogen plus progestin in healthy postmenopausal women:
principal results from the Women’s health initiative randomized
controlled trial. JAMA 2002, 288(3):321–333.
28. Taylor R, Boyages J: Estimating risk of breast cancer from population
incidence affected by widespread mammographic screening. J Med
Screen 2001, 8(2):73–76.
29. Taylor R, Davis P, Boyages J: Long-term survival of women with breast
cancer in New South Wales. Eur J Cancer 2003, 39(2):215–222.
30. Currow D, Thomson W: Cancer in NSW: Incidence Report 2009. Sydney:
Cancer Institute NSW; 2014.
31. Anderson WF, Katki HA, Rosenberg PS: Incidence of breast cancer in
the United States: current and future trends. J Natl Cancer Inst 2011,
103(18):1397–1402.
32. Australian Institute of Health and Welfare: Australian Institute of Health and
Welfare. Older Australia at a glance 4th edition. 4th edition. Canberra: AIHW
and DOHA; 2007.
33. Clements MS, Roder D, Yu XQ, Egger S, O’Connell DL: Estimating prevalence
of distant metastatic breast cancer: a means of filling a data gap. Cancer
Causes Control 2012, 23:1625–1634.
34. Gatta G, Mallone S, van der Zwan JM, Trama A, Siesling S, Capocaccia R,
Group EW: Cancer prevalence estimates in Europe at the beginning of
2000. Ann Oncol 2013, 24(6):1660–1666.
35. Yu X, Baade P, O’Connell DL: Conditional survival of cancer patients:
an Australian perspective. BMC Cancer 2012, 12:460.
36. Yu XQ, De Angelis R, Andersson TM, Lambert PC, O’Connell DL, Dickman
PW: Estimating the proportion cured of cancer: some practical advice for
users. Cancer Epidemiol 2013, 37(6):836–842.
37. Maher EJ, Makin W: Life after cancer treatment – a spectrum of chronic
survivorship conditions. Clin Oncol (R Coll Radiol) 2007, 19(10):743–745.
38. Levit L, Smith AP, Benz EJ, Ferrell B: Ensuring quality cancer care through
the oncology workforce. J Oncol Pract 2010, 6(1):7–11.
39. Smith BD, Smith GL, Hurria A, Hortobagyi GN, Buchholz TA: Future of
cancer incidence in the United States: burdens upon an aging, changing
nation. J Clin Oncol 2009, 27(17):2758–2765.
doi:10.1186/1471-2407-14-936
Cite this article as: Yu et al.: A population-based study of breast cancer
prevalence in Australia: predicting the future health care needs of
women living with breast cancer. BMC Cancer 2014 14:936.
Submit your next manuscript to BioMed Central
and take full advantage of:
• Convenient online submission
• Thorough peer review
• No space constraints or color figure charges
• Immediate publication on acceptance
• Inclusion in PubMed, CAS, Scopus and Google Scholar
• Research which is freely available for redistribution
Submit your manuscript at
www.biomedcentral.com/submit