Clinically significant association between the maximum standardized uptake value on 18F-FDG PET and expression of phosphorylated Akt and S6 kinase for prediction of the biological
Bạn đang xem bản rút gọn của tài liệu. Xem và tải ngay bản đầy đủ của tài liệu tại đây (1.56 MB, 14 trang )
Mizuno et al. BMC Cancer (2015) 15:114
DOI 10.1186/s12885-015-1097-0
RESEARCH ARTICLE
Open Access
Clinically significant association between the
maximum standardized uptake value on 18F-FDG
PET and expression of phosphorylated Akt and S6
kinase for prediction of the biological
characteristics of renal cell cancer
Tomoya Mizuno1†, Takao Kamai1*†, Hideyuki Abe1†, Setsu Sakamoto2, Kazuhiro Kitajima2,3, Daisaku Nishihara1,
Hideo Yuki1, Tsunehito Kambara1, Hironori Betsunoh1, Masahiro Yashi1, Yoshitatsu Fukabori1, Yasushi Kaji3
and Ken-Ichiro Yoshida1
Abstract
Background: The relationship between the clinicopathological features and molecular changes associated with
standardized uptake value (SUV) determined by Positron emission tomography (PET) with [18F] fluorodeoxyglucose
(18F-FDG PET) in human renal cell carcinoma (RCC) has not been elucidated. On the other hand, overactivation of
the phosphatidylinositol 3’kinase (PI3K), serine/threonine kinase Akt, and mammalian target of rapamycin (mTOR)
pathway has been detected in a variety of human cancers, including RCC. So far, little is known about the relationship
between the SUV and these proteins in human RCC. Thus, it is important to study the relevance of SUV with
clinicopathological features in human RCCs from a molecular point of view.
Methods: Seventy-seven consecutive patients with RCC who underwent nephrectomy and pretreatment
determination of the maximum SUV (SUVmax) by 18F-FDG PET were analyzed. We investigated the relationship
between the SUVmax, phosphorylated-Akt (Ser-473) (pAkt(Ser-473)), phosphorylated-Akt (Thr-308) (pAkt(Thr-308),
and phosphorylated-S6 ribosomal protein (Ser-235/236) (pS6) protein levels in the primary tumor and various
clinicopathological features.
Results: The average SUVmax of the primary tumor was 6.9 (1.5 to 40.3). A higher SUVmax was correlated with
higher expression of pAkt(Ser-473), pAkt (Thr-308), and pS6 protein in the primary tumor. A higher SUVmax and
increased expression of pAkt (Ser-473), pAkt (Thr-308), and pS6 of the primary tumor was associated with less
tumor differentiation, a higher pT stage, regional lymph node involvement, microscopic vascular invasion, and
distant metastasis, as well as with early relapse following radical nephrectomy in patients who had localized or
locally advanced RCC without distant metastasis (cTanyNanyM0) and with shorter overall survival in all patients.
(Continued on next page)
* Correspondence:
†
Equal contributors
1
Department of Urology, Dokkyo Medical University, 880 Kitakobayashi Mibu,
Tochigi 321-0293, Japan
Full list of author information is available at the end of the article
© 2015 Mizuno et al.; licensee BioMed Central. This is an Open Access article distributed under the terms of the Creative
Commons Attribution License ( which permits unrestricted use, distribution, and
reproduction in any medium, provided the original work is properly credited. The Creative Commons Public Domain
Dedication waiver ( applies to the data made available in this article,
unless otherwise stated.
Mizuno et al. BMC Cancer (2015) 15:114
Page 2 of 14
(Continued from previous page)
Conclusions: A higher SUVmax on 18F-FDG PET is associated with elevated tumor levels of pAkt and pS6 protein
and with aggressive behavior and metastatic potential of RCC, as well as with early relapse following radical
nephrectomy and shorter overall survival. These findings suggest that SUVmax may be useful for predicting the
biological characteristics of RCC.
Keywords: Renal cell carcinoma (RCC), Positron emission tomography (PET), [18F]fluorodeoxyglucose (18F-FDG),
Maximum standardized uptake value (SUVmax), Akt, S6 ribosomal protein
Background
Renal cell carcinoma (RCC) is the most common solid
cancer of the kidney and accounts for about 3% of adult
malignancies. RCC is one of the top 10 causes of cancer
deaths in industrialized countries and its incidence has
consistently increased over the past few decades [1]. Localized RCC is usually treated surgically, but almost 30%
of patients with limited disease at the time of resection
develop metastasis within 3 years [2,3]. Clear cell RCC is
a type of renal cancer that is extremely vascular with a
high metastatic potential, and a high percentage of patients with clear cell RCC already have metastases at
diagnosis or else relapse after nephrectomy [2,3]. Metastasis involves the spread of tumor cells from the primary
lesion to a distant site [4], and it is the major cause of
cancer death. RCC patients with distant metastasis have
a poor prognosis and their 5-year survival rate is less
than 10% [2,3].
Increased glucose uptake is a key alteration associated
with the high glycolytic rate of cancer cells (the Warburg
effect) [5], and reprogramming of energy metabolism
can now be viewed as one of the “hallmarks of cancer”
[6]. Oxidative phosphorylation is impaired in RCC,
resulting in a metabolic shift to aerobic glycolysis [7].
The phosphatidylinositol 3‘kinase (PI3K), serine/threonine kinase Akt, and mammalian target of rapamycin
(mTOR) pathway is abnormally active in a number of
human cancers, including RCC [8], and interruption of
this pathway by targeted therapy has antiproliferative,
pro-lethal, antiangiogenic, and pro-apoptotic effects, and
are more effective against RCC than previous cytokine
therapy or chemotherapy [9].
Positron emission tomography (PET) can be performed
using [18F]fluorodeoxy-glucose (18F-FDG PET) to assess
fundamental alterations of cellular glucose metabolism
[10]. The maximum standard glucose uptake value (SUVmax) is the most common semiquantitative parameter
determined by 18F-FDG PET and a decrease of SUVmax is
associated with the response to numerous anticancer therapies [11]. 18F-FDG PET has been suggested as a noninvasive pharmacodynamic marker for the response to novel
targeted anticancer agents in patients with advanced RCC
[12-14]. It has been shown that inhibition of Akt disrupts
transcription of glucose transporter protein-1
(GLUT1) and its translocation to the plasma membrane to promote glucose utilization independent of an
effect on cell proliferation [15]. Thus, it has been proposed that 18F-FDG PET could be used as a pharmacodynamic biomarker for assessing the efficacy of
inhibition of the PI3K/Akt/mTOR pathway by targeted
therapy [10]. However, little is known about the relationship between the clinicopathological features and
molecular changes associated with SUVmax in human
RCCs. To our knowledge, this is the first reported
study in which we examine the relationship between
SUVmax and phosphorylated-Akt (Ser-473) (pAkt
(Ser-473), phosphorylated-Akt (Thr-308) (pAkt (Thr308), and phosphorylated-S6 ribosomal protein (Ser235/236) (pS6) expression levels in human RCC. Our
findings might lead to new insight on the value of
SUVmax as a tumor biomarker in RCC from a molecular point of view.
Methods
Patients and samples
We studied 77 consecutive Japanese patients (48 men
and 29 women) aged from 39 to 83 years (mean age:
63.1 years) in whom RCC was diagnosed from 2010 to
2013. All patients underwent 18F-FDG PET/computed
tomography (CT) for preoperative staging prior to radical nephrectomy. The postoperative follow-up period
ranged from 3 to 45 months (median: 19 months). Surgery was performed before patients received any other
therapy. The patient profile and tumor characteristics
are summarized in Table 1. The pretreatment SUVmax
on 18F-FDG PET was defined as baseline SUVmax. In
every patient, three tumor tissue specimens and various
non-neoplastic kidney tissues were harvested and stored
at −80°C as soon as possible after nephrectomy, as
described previously [16,17]. The non-neoplastic kidney
tissues were apparently free of tumor cells and were
obtained from as far distant a part of the resected kidney
as possible. If the tumor was located centrally, nonneoplastic tissues were harvested from the upper or
lower pole, while non-neoplastic tissues were harvested
from the opposite pole if the tumor was located in the
Mizuno et al. BMC Cancer (2015) 15:114
Page 3 of 14
Table 1 Data collection of patient and tumor
characteristics
Patient
No. of patients
77
Age (yrs)
63.1 (39–83)
Sex (male/female)
48/29
follow-up times (months)
19 (3–43)
Histology (clear cell/cell/
sarcomatoid differentiation)
57/11/9
Histological Fuhrman grading
(G1/G2/G3/G4)
9/32/29/7
Tumor
Surgery
pT stage (T1/T2/T3/T4)
24/19/32/2
pN stage (T0/N1/N2)
62/12/3
Microscopic vascular invasion
(v0/v1)
28/49
Metastasis (M0/M1)
52/25
Radical nephrectomy
77
with cavotomy with thrombectomy
for > T3b tumor
(9)
with RPLND* for > N1 tumor
(15)
RPLND*: retroperitoneal lymph node dissection.
upper or lower pole. The tumor grade and clinical stage
were determined according to the Fuhrman system and
TNM classification, respectively [18,19]. Histopathological examination of the resected kidneys was
performed independently by two pathologists. If abnormalities of the putatively normal tissue samples were
detected, the patient was excluded from the study. In
the present study, however, in all 77 patients, nonneoplastic tissues resected were confirmed to be noncancerous tissues by microscopic examination. This
study was conducted in accordance with the Helsinki
Declaration and was approved by the ethical review
board of Dokkyo Medical University Hospital. Each
patient signed a consent form that was approved by our
institutional Committee on Human Rights in Research.
Postoperative adjuvant therapy with interferon (IFN)alpha (3, 5, or 6 million units of natural human IFNalpha two or three times weekly), sorafenib (400 to
800 mg/day), or sunitinib (25 to 50 mg/day for 4 weeks,
followed by two weeks off therapy) was usually provided
if patients had extra-renal involvement (metastatic disease) and was continued until progression occurred. The
doses of these agents were decreased if the patient developed grade 3/4 toxicity.
Performance and evaluation of
18
F-FDG PET /CT
Whole-body imaging using a combined 18F-FDG PET/
CT scanner (Biograph, Sensation 16, Siemens Systems)
and evaluation of the images were performed according
to our previously reported methods [20,21]. Whole-body
CT covered a region ranging from the meatus of the ear
to the mid-thigh. The 64-detector-row helical CT scanner
had a gantry rotation speed of 0.5 sec, a table speed of
24 mm per rotation, 120 kVp, 40 mA, and a slice thickness
of 2.5 mm. The PET imager of the combined system had
an axial view of 16.2 cm (per bed position) with an interslice interval of 3.75 mm and FWHM of 5 mm in one bed
position. Imaging from the meatus of the ear to the midthigh was achieved with six to seven bed positions. The
transaxial field of view and pixel size of the PET images
reconstructed for fusion was 58.5 cm and 4.57 mm, respectively, with a 128 × 128 matrix. To avoid artifacts
caused by the urinary tract, patients were asked to drink
1000 ml of water at 1–2 h prior to image acquisition and
to empty the bladder just before the start of imaging. Bladder catheterization was not done and intravenous or oral
contrast medium was not used. After fasting for at least
4 h, patients received an intravenous injection of 18F-FDG
(4.0 MBq/kg). Blood glucose was checked in all patients
before performing 18F-FDG PET, and no patient had a
blood glucose level >160 mg/dl. About 50 min later, CT
scanning was conducted and whole-body emission PET
scanning was performed with acquisition for 3 min per
bed position using the three-dimensional acquisition
mode. Attenuation-corrected PET images were reconstructed with an ordered-subset expectation maximization
iterative reconstruction algorithm that employed eight
subsets and three iterations. Images obtained by 18F-FDG
PET or CT and fused 18F-FDG PET/CT images were generated for review on a workstation (AZE Virtual Place
Version 3.0035).
18
F-FDG PET images and CT scans were interpreted
by two experienced radiologists and decisions were
made by consensus. 18F-FDG PET data were used to
reconstruct coronal, axial, and sagittal images as is typically done for clinical assessment. When focal 18F-FDG
PET uptake with a higher intensity than that of the
surrounding tissues was seen at a site unrelated to
physiologic/nonpathologic processes, metastatic RCC
was suspected. Metastasis was diagnosed when abnormal
focal 18F-FDG PET uptake on PET images corresponded
to an abnormal mass on CT scans. The mean activity of
the region of interest (ROI) was calculated (MBq/g)/
(injected dose (MBq)/body weight (g)) where MBq is
mega-Becquerel and g is grams. The SUV was determined according to the standard formula, with activity
in the volume of interest (VOI) being calculated as Bq/
ml divided by the injected dose in Bq/kg. In each patient, the average SUV was calculated from all images
obtained about 1 h after tracer injection. SUVmax was
defined as the maximum activity within the VOI. To
obtain the highest SUVmax in patients with multiple
metastatic tumors, the values of each lesion detected on
CT scans were compared.
Mizuno et al. BMC Cancer (2015) 15:114
Western blotting
We performed Western blotting of samples from all
resected primary tumors. Tumor samples and normal
control samples were carefully dissected to remove stromal tissue. In order to allow for inter-individual variation
in the expression of pAkt (Ser-473), pAkt (Thr-308), and
pS6, tumor tissue samples and the corresponding nonneoplastic samples obtained from the same patient were
compared as described previously [16,22]. In brief, 10 μg
of cytosolic protein was separated by SDS-PAGE (4-12%
gel), and was transferred to a polyvinylidene difluoride
membrane (iBlot Gel Transfer Stacks PVDF, Mini; Life
Technologies, Carlsbad, CA). After the membrane was
blocked, the bound proteins were probed with the following primary antibodies: a rabbit anti-human antibody targeting pAkt (Ser-473) (Cell Signaling Technology, Inc;
PhosphoPlus Akt (Ser-473) Antibody Kit; # 9270, Danvers,
MA), a rabbit anti-human antibody for pAkt (Thr-308)
(Cell Signaling Technology, Inc; Phospho-Akt (Thr308)
Antibody Kit; # 2965, Danvers, MA), a rabbit anti-human
antibody targeting pS6 (2 F9, Cell Signaling Technology,
Inc; # 4856), and an antibody for beta-actin (Millipore; #
1501R Bedford, MA). Hela cells were used as the positive
control [16,22]. The membranes were washed and incubated with horseradish peroxidase-conjugated secondary
antibodies. After protein bands were visualized by chemiluminescence, each membrane was scanned for densitometry with a PDI imaging scanner (Agfa Japan, Tokyo) and
the data were analyzed with NIH Image software (ImageJ
for Mac OS, version 1.47). Expression of pAkt (Ser-473),
pAkt (Thr-308), and pS6 was calculated relative to that of
beta-actin in the tumor tissue specimens and corresponding non-neoplastic specimens. For quantification of protein levels, the relative amount of pAkt (Ser-473), pAkt
(Thr-308), and pS6 in tumor tissue specimens was
expressed as a ratio of the optical density for the tumor
specimen to that for the corresponding non-neoplastic
specimen (set at 1.0) by densitometric analysis, as described previously [16,17]. The mean values for tumor and
non-neoplastic tissues were calculated from three experiments [16,17].
Immunohistochemistry
To confirm the data obtained by Western blotting,
immunohistochemistry was performed with the same
antibodies utilized for Western blotting on representative
tumors from the 5 patients, as described previously [23].
Statistical analysis
Western blotting data were analyzed by the Mann–
Whitney U test for comparisons between two groups
(TNM stage, microscopic vascular invasion, serum CRP,
and systemic treatment effect), while the Kruskal-Wallis
test was used to compare data on histological grade
Page 4 of 14
among three groups [16,17]. Spearman’s rank correlation
coefficient analysis was performed to determine the
relations between SUVmax and the expression of pAkt
(Ser-473), pAkt (Thr-308), or pS6, as well as Karnofsky
performance status and tumor size [16,24]. The KaplanMeier method was used to estimate survival and differences were assessed by the log-rank test [16,17]. The
impact on survival of SUVmax, pAkt (Ser-473), pAkt
(Thr-308), and pS6 expression, tumor grade, pT stage,
regional lymph node involvement, microscopic vascular
invasion, and distant metastasis was assessed by Cox
proportional hazards analysis using univariate and multivariate models. In all analyses, a P value of less than 0.05
was considered significant. Data were analyzed with
commercially available software.
Results
SUVmax and expression of pAkt and pS6 in the primary
tumor
All patients had lesions showing increased uptake on
FDG-PET/CT in the primary tumor at diagnosis (mean ±
S.D of SUVmax = 6.97 ± 5.96, range: 1.5 – 40.3, Figure 1).
The amount of pAkt (Ser-473) pAkt (Thr-308) and
pS6 protein was significantly greater in the primary tumors than in the non-tumor kidney tissues, defined as
1.0, (Figure 2, Table 2). Some of tumor cells showed
brown staining in a membrane and cytoplasm, while
glomerulus and renal tubules did not (Figure 3).
Karnofsky performance status below 80% (n=19)
showed higher p-SUVmax than that above 80% (n=58)
(13.61 ± 7.47 vs 4.84 ± 3.29, P = 0.000052).
We investigated the correlation between SUVmax of
the primary tumors (p-SUVmax) and tumor size. When
tumor size was set as the independent variable and pSUVmax as the dependent variable, a positive correlation was observed (r2 = 0.34, P = 0.000094, Figure 4A).
Regarding with the correlation between p-SUVmax
and the expression of pAkt (Ser-473), pAkt (Thr-308),
and pS6 proteins in the primary tumors, a positive correlation was observed (pAkt (Ser-473); r2 = 0.63, P =
0.000077, pAkt (Thr-308); r2 = 0.60, P = 0.0001, pS6; r2 =
0.41, P = 0.000089, Figures 4B-D). There was also a positive correlation between pAkt (Ser-473) and pAkt (Thr308) (r2 = 0.85, P = 0.000003, Figure 5A), pAkt (Ser-473)
and pS6 (r2 = 0.52, P = 0.000072, Figure 5B), and pAkt
(Thr-308) and pS6 (r2 = 0.45, P = 0.000087, Figure 5C).
Higher SUVmax and elevated expression of pAkt and pS6
of the primary tumor was associated with its aggressive
and metastatic profiles
A higher p-SUVmax was related to less tumor differentiation, local invasion, regional lymph node involvement,
microscopic vascular invasion, distant metastasis, and
non-clear cell histology (non-ccRCC) (Table 2).
Mizuno et al. BMC Cancer (2015) 15:114
Page 5 of 14
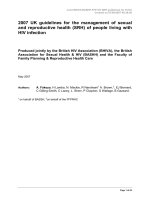
Figure 1 PET/CT scan. A case (50 y.o, male) with pT3aN0M1 (HEP, PUL, OSS) with clear cell carcinoma with sarcomatoid differentiation (Fuhrman
grade 4). A: PET scan shows accumulation of FDG in left renal tumor (green asteroid, SUVmax: 14.5), liver (yellow arrows, SUVmax: 7.1), lung (not
shown, SUVmax: 3.7), and Th3 vertebra (yellow arrowhead, SUVmax: 8.8). In this case, the highest SUVmax of the metastatic tumors (m-SUVmax) is
8.8. Blue circle shows left pleural effusion. B: Chest CT shows a tumor in left lung (blue arrow) and pleural effusion (blue circle). C: Enhanced
abdominal CT shows large left renal tumors (green asteroid) and multiple liver tumors (yellow arrows).
Similarly, increased expression of pAkt (Ser-473) pAkt
(Thr-308), and pS6 in the primary tumors was correlated
with less differentiation, local invasion, regional lymph
node involvement, microscopic vascular invasion, distant
metastasis, and non-ccRCC (Table 2).
Regarding with the relationship between the pSUVmax and the highest SUVmax of the metastatic
tumors (m-SUVmax), there was a tendency toward correlation (r2 = 0.17, P = 0.0568). On the other hand, the
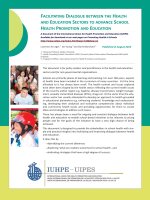
Figure 2 Expression of phosphorylated Akt (Ser-473) (60 kDa),
phosphorylated Akt (Thr-308) (60 kDa), phosphorylated S6
ribosomal protein (Ser-235/236) (32 kDa) and beta actin (42 kDa)
proteins in the primary tumor tissues using Western blotting.
M; marker. N; non-tumor tissue. T; primary tumor tissue. Each number
corresponds to a case number.
highest m-SUVmax was not significantly correlated with
the expression of pAkt (Ser-473) (r2 = 0.04, P = 0.3835),
pAkt (Thr-308) (r2 = 0.05, P = 0.3526), or pS6 in the primary tumor (r2 = 0.01, P = 0.9803).
A higher SUVmax and increased expression of pAkt and
pS6 of the primary tumor was associated with early
relapse following radical nephrectomy and with shorter
overall survival
When the 52 patients with M0 tumors were divided into
two groups at the median p-SUVmax (3.50), comparison
of the Kaplan-Meier survival rate plots with low vs. high
p-SUVmax value linked high p-SUVmax with early relapse after nephrectomy (Figure 6A). Tumors with
higher pAkt (Ser-473) and pAkt (Thr-308) expression
groups in the primary tumors is associated with early relapse after nephrectomy, but pS6 did not (Figures 6B-D).
While less differentiation, local invasion, microscopic
vascular invasion, non-clear cell, sarcomatoid differentiation, higher p-SUVmax, higher pAkt (Ser-473), and
higher pAkt (Thr-308) were significant by Cox univariate
analysis, only less differentiation was significant by
multivariate analysis (Table 3).
SUVmax in the primary tumor
Western blotting in primary tumor
Number=77
Number=77 pAkt (Ser-473)
mean ± S.D
Tissue
tumor
n=77
6.97 ± 5.96
non-tumor
Histological differentiation (Fuhrman grade) G1
pT stage
Microscopic vascular invasion
pN stage
Metastasis (cM stage)
cell histology
P value
mean ± S.D P value
n=77
3.91 ± 3.01
n=77
1.00
pS6K (Ser-235/236)
mean ± S.D P value
0.000001 2.83 ± 2.13
1.00
0.000009 2.43 ± 1.58
n=9
2.72 ± 0.66
n=32
3.90 ± 2.33
G3
n=29
8.80 ± 3.79
n=29
5.16 ± 2.73
3.46 ± 1.85
2.81 ± 1.23
G4
n=7
18.67 ± 10.23
n=7
8.09 ± 3.49
6.00 ± 2.71
5.19 ± 2.07
0.000019 n=43
2.43 ± 1.74
0.000029 1.93 ± 1.49
0.000083 1.75 ± 0.95
n=34
5.83 ± 3.24
4.00 ± 2.27
3.31 ± 1.79
pT1-2
n=43
3.77 ± 2.02
n=34
10.91 ± 6.82
n=32
1.54 ± 0.57
0.000041 1.21 ± 0.36
0.000089 1.13 ± 0.15
2.57 ± 2.03
2.03 ± 1.57
1.86 ± 1.08
v0
n=28
3.33 ± 1.46
0.000061 n=28
2.08 ± 1.22
0.000100 1.67 ± 1.14
0.000200 1.60 ± 0.78
v1
n=49
9.01 ± 6.55
n=49
4.97 ± 3.23
3.50 ± 2.28
2.91 ± 1.72
N0
n=62
5.58 ± 5.80
0.000053 n=62
3.13 ± 2.54
0.000076 2.41 ± 2.00
0.000200 2.04 ± 1.31
N1-2
n=15
12.38 ± 2.59
n=15
7.38 ± 2.45
4.68 ± 1.64
4.14 ± 1.56
0.000029 n=52
2.55 ± 2.03
0.000043 2.07 ± 1.69
0.000085 1.81 ± 1.52
n=25
7.04 ± 2.53
4.57 ± 2.03
3.85 ± 1.16
M0
n=52
4.56 ± 3.59
M1
n=25
12.10 ± 6.78
clear cell carcinoma
n=57
4.94 ± 3.15
0.000069 n=57
3.16 ± 2.44
0.000500 2.28 ± 1.68
0.000300 2.03 ± 1.19
non-clear cell carcinoma n=11
9.44 ± 5.04
n=11
4.43 ± 3.36
3.21 ± 2.11
3.41 ± 2.24
Sarcomatoid*
16.54 ± 9.37
n=9
8.56 ± 1.88
6.17 ± 2.02
3.95 ± 1.59
n=9
0.000021
1.00
G2
pT3-4
0.000073 n=9
pAkt (Thr-308)
mean ± S.D P value
Mizuno et al. BMC Cancer (2015) 15:114
Table 2 Relationship between SUVmax and pAkt/pS6K protein densitometry results and pathological parameters
0.000079
0.000100
0.001000
0.000092
0.000078
0.001300
Data show mean ± S.D.
Sarcomatoid*: clear cell carcinoma with sarcomatoid differentiation.
Page 6 of 14
Mizuno et al. BMC Cancer (2015) 15:114
Page 7 of 14
P = 0.0304, respectively, Figure 8), but pS6 had no impact (P = 0.2808).
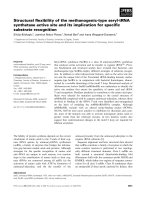
Figure 3 Representative immunohistochemistry in the
primary tumor tissues for anti-phosphorylated Akt (Ser-473),
phosphorylated Akt (Thr-308), and phosphorylated S6 ribosomal
protein (Ser-235/236) antibodies. Some of tumor cells showed
brown staining for anti-pAkt (Ser-473) antibody (arrows), while
glomerulus and renal tubules did not (A. ×100). Many of tumor cells
showed moderate to strong brown staining in a membrane and
cytoplasm in RCC for anti-pAkt (Ser-473) antibody (B. ×200), for antipAkt (Thr-308) antibody (C. ×200), and for anti-pS6 antibody (D. ×200).
Regarding with the overall survival, the median level
of p-SUVmax was 4.35, so the patients were divided
into two groups at this cut-off value. Kaplan-Meier
plots of survival for the higher and lower value groups
showed that the higher p-SUVmax was associated with
shorter overall survival (Figure 7A). Similarly, KaplanMeier plots showed that higher pAkt (Ser-473), pAkt
(Thr-308) and pS6 expression levels in the primary tumors were associated with shorter overall survival
(Figures 7B-D).
We divided the M1 cases at nephrectomy (25 patients)
into two groups in order to examine the relation of mSUVmax, p-SUVmax, pAkt (Ser-473), pAkt (Thr-308)
and pS6 expression levels in the primary tumors with
the survival time. The median value of m-SUVmax in
M1 cases was 7.30, so the patients were divided into two
groups at this cut-off value to give a higher value group
(n=13) and a lower value group (n=12). The patients
with higher m-SUVmax had a tendency toward shorter
overall survival (P = 0.0559). We also calculated the median value of p-SUVmax of the M1 cases at nephrectomy (25 patients), then those were divided into two
groups at median value. Kaplan-Meier plots of survival
for patients with low vs. high p-SUVmax showed no
statistic difference (P = 0.2791) for overall survival time.
Similarly, regarding of the pAkt (Ser-473), pAkt (Thr308) and pS6 expression levels in the primary tumors,
we divided 25 M1 cases into two groups. The patients
with higher pAkt (Ser-473) and pAkt (Thr-308) expression showed a shorter overall survival time (P = 0.0012,
Discussion
RCC is characterized by impaired oxidative phosphorylation and a shift to aerobic glycolysis, which is a form of
metabolic reprogramming known as cancer cell glycolysis (or the Warburg effect). An increase of glycolysis
generates the adenosine triphosphate (ATP) needed for
rapid proliferation and also enhances fatty acid synthesis
by diminishing the phosphorylation of acetyl CoA carboxylase (a rate-limiting step of fatty acid synthesis) in
order to provide energy for rapid tumor growth [7]. 18FFDG PET has been widely used to detect malignancy
and predict the prognosis, as well as being employed for
tumor staging/restaging and in therapeutic decisionmaking and monitoring [10,11].
The aim of the present study was to investigate
whether 18F-FDG PET could be used for noninvasive
assessment of the biological characteristics of human
RCC by comparing the relevance of SUVmax with clinicopathological features in human RCCs from a molecular point of view. In this study, we investigated the
following: 1) relationship between p-SUVmax and
expression of pAkt (Ser-473), pAkt (Thr-308), and pS6
protein in the primary tumor; 2) whether the pSUVmax predicted relapse of organ-confined or locally
advanced RCC without distant metastasis (cTanyNanyM0) after radical nephrectomy; and 3) whether the pSUVmax or m-SUVmax predicted the response of
metastatic lesions (cTanyNany M1) to cytokine/immunotherapy and/or molecular targeting therapy after radical
nephrectomy.
Relationship between SUVmax of the primary tumor and
clinicopathological features
The p-SUVmax was positively correlated with Karnofsky
performance status and tumor size, and was also correlated with less tumor differentiation, local invasion,
regional lymph node involvement, microscopic vascular
invasion, distant metastasis, and non-ccRCC histology.
Furthermore, the p-SUVmax was positively correlated
with the expression of pAkt (Ser-473), pAkt (Thr-308),
and pS6 protein in the primary tumor, and the levels of
these protein were also closely related to less differentiation, local invasion, regional lymph node involvement,
microscopic vascular invasion, distant metastasis, and
non-ccRCC histology.
Overactivation of the PI3K-Akt-mTOR pathway has
been reported in various human cancers, including RCC
[9]. mTOR forms mTOR complex (mTORC)1 and
mTORC2 by binding to the regulatory associated protein
of mTOR (Raptor) and the rapamycin-insensitive
companion of mTOR (Rictor), respectively, and these two
Mizuno et al. BMC Cancer (2015) 15:114
Page 8 of 14
Figure 4 Spearman rank correlation between the SUVmax and the tumor size and the expression levels of phosphorylated proteins in
the primary tumors (n=77). A: tumor size. B: pAkt (Ser-473). C: pAkt (Thr-308). D: pS6.
complexes have different intracellular functions. mTORC1
is activated by PI3K-Akt and it phosphorylates S6K1 and
4EBP1, thereby promoting translation and protein synthesis. Both this study and our previous investigations
showed that pS6, the best-characterized downstream
effector of mTORC1, is upregulated in primary renal
tumors with metastasis [16,17], indicating that pS6 might
influence the progression of RCC.
mTORC2 regulates the actin cytoskeleton and also
possesses PDK2 activity that phosphorylates Ser-473 at
the carboxy-terminus of Akt, which is essential for activation of Akt [25]. Activation of Akt may increase cell
viability after inhibition of mTORC1, or could potentially the production of increase vascular endothelial
growth factor (VEGF) because PI3K/Akt signaling induces tumor angiogenesis by regulating VEGF via both
HIF1α-dependent and -independent mechanisms [26].
It has been reported that HIF1α expression is
dependent on both raptor and rictor, whereas HIF2α
expression only depends on rictor, with HIF2α and
mTORC2 being more important in RCC [8,27]. We
previously reported that tumors showing higher expression of pAkt (Ser-473) protein were resistant to treatment with interferon alpha and sorafenib, and that
higher tumor levels of pAkt (Ser-473) were associated
with shorter overall survival [16]. Similarly, Jonasch
et al. reported that an increase of pAkt (Ser-473) expression revealed by microarray analysis was associated
with worse survival of patients treated with sorafenib
and interferon alpha [28]. Furthermore, we recently reported that assessing the expression of pAkt (Ser-473)
in resected specimens might be useful for predicting
the response of locally advanced RCC to neoadjuvant
therapy with axitinib [23]. These findings suggest that
pAkt (Ser-473) might be a key molecule in the progression of RCC and could be a potential biomarker for
assessing the efficacy of targeted inhibition of the
PI3K/Akt pathway. However, the role of pAkt (Thr308) in RCCs has not been fully elucidated. So, we
examined the expression for both pAkt (Ser-473) and
pAkt (Thr-308) by co-expression analysis using surgically resected samples.
Mizuno et al. BMC Cancer (2015) 15:114
Page 9 of 14
Figure 5 Spearman rank correlation between the expression levels of phosphorylated proteins in the primary tumors (n=77). A: pAkt
(Ser-473) and pAkt (Thr-308). B: pAkt (Ser-473) and pS6. C: pAkt (Thr-308) and pS6.
Mizuno et al. BMC Cancer (2015) 15:114
Page 10 of 14
Figure 6 Recurrence free-survival curve in 52 M0 cases at nephrectomy. This survival curve is based on the median values of SUVmax
(A) and protein expression of pAkt(Ser-473) (B), pAkt(Thr-308) (C) and pS6 proteins (D) in the primary tumor. The cases were divided into two
groups at this levels - high and low expression. P value was analyzed by log-rank test.
In the present study, increased expression of pAkt
(Thr-308) in the primary renal tumor was also correlated
with aggressive biological behavior and metastatic potential. Furthermore, expression of pAkt (Ser-473) and pAkt
(Thr-308) in primary tumor tissue showed a strong positive correlation. Phosphorylation at two sites is required
for full activation of Akt, since it is phosphorylated by
PI3K-dependent kinase-1 (PDK1) at a threonine residue
in the catalytic domain (Thr-308) and by PI3K-dependent
kinase-2 (PDK2) at a serine residue (Ser-473) located in
the carboxy-terminal hydrophobic motif [29]. Taken together, activation of both of pAkt (Ser-473) and pAkt
(Thr-308) might be very important in the progression of
RCC. Because SUVmax was positively correlated with the
expression of pAkt (Ser-473), pAkt (Thr-308) and pS6,
18
F-FDG PET might be a useful imaging modality for
assessing the biological characteristics of RCC from a molecular point of view.
Usefulness of SUVmax of the primary tumor for
predicting the prognosis
Tumors with a higher p-SUVmax showed earlier
relapse after radical nephrectomy. The tumors with
early relapse also displayed higher expression of pAkt
(Ser-473), pAkt (Thr-308), and pS6. These findings suggest that the patients with a higher SUVmax of the primary renal tumor should be under active surveillance,
even if the tumor is well or moderately differentiated or
is a noninvasive T1 lesion.
As is often the case with the patients with metastatic
RCCs who received systemic therapy, while the sizes
and/or the numbers of some metastatic lesions decreased, those of other lesions increased or new lesions
appeared. Furthermore, some of the patients who
showed poorer response for first-line systemic therapy
for metastatic lesions had sensitivity for second-line systemic therapy. These might help to explain why many
Mizuno et al. BMC Cancer (2015) 15:114
Page 11 of 14
Table 3 Cox regression analysis for various potential prognostic factors in recurrence-free survival
Recurrence-free survival in cN0M0 cases
Variable
Unfavorable/favorable characteristics No. of Patients Analysis
Relative risk 95% confidential interval P value
p-SUVmax*
high/low
26/26
Univariate (U)
14.361
Multivariate (M) 1.714
0.021 - 142.351
0.64270
pAkt (Ser473) high/low
26/26
U
1.688 - 50.514
0.03910
M
2.374
0.062 - 367.647
0.78520
pAkt (Thr308) high/low
25/27
U
5.321
1.621 - 45.612
0.04810
2.157
0.069 - 397.026
0.79130
pS6
high/low
26/26
U
3.994
0.466 - 34.272
0.12190
Grade
4/3/2/1
2/13/28/9
U
11.397
3.320 - 33.119
0.00007
M
31.171
1.836 - 529.228
0.01730
pT
4,3/2,1
13/39
U
7.807
1.920 - 31.753
0.00410
M
5.151
0.187 - 151.279
0.15370
v
1/0
24/28
U
4.941
1.016 - 24.035
0.04780
M
2.355
0.156 - 35.559
0.53630
cell type
sarcomatoid/non-cc/cc*
3/9/40
U
7.051
2.634 - 18.876
0.00010
M
1.029
0.091 - 11.577
0.78180
5.895
4.283 - 64.472
0.00940
M
p-SUVmax*: SUVmax value in the primary tumor.
sarcomatoid/non-cc/cc*: sarcomatoid differentiation/non-clear cell RCC/clear cell RCC.
patients with metastatic disease show better survival
when they receive sequential therapy with multiple targeting agents and current best supportive care than was
achieved with conventional immuno-cytokine therapy
[9]. It is likely that the biological characteristics of the
primary and metastatic tumors were not always identical. Gerlinger et al. reported that primary and metastatic
lesions showed biological differences and suggested that
intra-patient tumor heterogeneity meant treatment strategies should be re-considered on the basis of these differences [30]. Thus, we should not select the treatment
strategy by assuming that the characteristics of metastatic tumors are the same as those of the primary
tumor. Since we could not obtain samples of every metastasis, however, we had to predict the biological characteristics of the metastatic lesions by examining the
surgically resected primary tumors. In the present study,
there was a correlation between p-SUVmax and the
highest m-SUVmax of the metastatic tumors, as well as
between p-SUVmax and the expression of pAkt (Ser473), pAkt (Thr-308), and pS6 protein in the primary
tumor, indicating that the metastatic tumors with higher
m-SUVmax might have higher protein expression for
pAkt (Ser-473), pAkt (Thr-308) and pS6.
It has also been reported that a decrease of SUVmax is
associated with the response to various anticancer therapies [11], and use of 18F-FDG-PET as a pharmacodynamic biomarker for assessing the efficacy of inhibiting
the PI3K/Akt pathway has been proposed [10]. Namura
et al. reported that the survival of patients can be predicted by evaluating the SUVmax of metastatic tumors
using 18F-FDG PET [31]. In addition, Ueno et al. reported that 18F-FDG PET/CT could be used to evaluate
the early response of metastatic RCC to treatment with
tyrosine kinase inhibitors (TKIs), since tumor size and
FDG uptake on 18F-FDG PET/CT after 1 month of treatment predicted progression-free survival and overall survival [13]. These findings suggest that the SUVmax of
metastatic tumors might be a biomarker that provides
useful information for clinical decision making. However, in Japan, 18F-FDG PET is approved for one examination as a method of staging RCC, but repeat imaging
to evaluate the treatment effect is not covered by the
Japanese health insurance system. Therefore, we could
not examine the influence of radical nephrectomy or
systemic treatment on metastatic lesions by repeating
18
F-FDG PET. Accordingly, we should make efforts to
assess the biological characteristics of metastatic
tumors from data obtained by 18F-FDG PET prior to
nephrectomy.
Regarding with 25 metastatic (M1) cases, the mSUVmax, p-SUVmax, pAkt (Ser-473), pAkt (Thr-308)
and pS6 expression levels in the primary tumors were
not associated with the response for first-line systemic
therapy (data not shown). When we divided the 25 M1
cases into two groups at median value of p-SUVmax at
nephrectomy, Kaplan-Meier plots of survival for patients
with low vs. high p-SUVmax showed no statistic
Mizuno et al. BMC Cancer (2015) 15:114
Page 12 of 14
Figure 7 Overall survival curve in all patients. This survival curve is based on the median values of SUVmax (A) and protein expression of
pAkt(Ser-473) (B), pAkt(Thr-308) (C) and pS6 proteins (D) in the primary tumor. The cases were divided into two groups at this levels - high and
low expression. P value was analyzed by log-rank test.
difference for overall survival time, while the patients
with higher m-SUVmax had a tendency toward shorter
overall survival, suggesting that the SUVmax of each
metastatic lesion is important for predicting the biological characteristics. The patients with higher pAkt
(Ser-473) and pAkt (Thr-308) expression showed a
shorter overall survival time, but pS6 had no impact. On
the other hand, when we analyzed all 77 patients, the aggressive and metastatic potential with higher p-SUVmax
and pAkt (Ser-473), pAkt (Thr-308) and pS6 expression
levels in the primary tumors were associated with unfavoravle prognosis. Taken together, SUVmax, pAkt (Ser473), pAkt (Thr-308) and pS6 might be biological
markers in RCCs.
The present study was not randomized and evaluated
a relatively small number of patients, while the followup period was too short to draw definite conclusions.
Immunohistochemical study showed the positive staining in membrane and cytoplasm in cancer cells, but not
in normal glomerulus and renal tubules. Although these
findings supported the data obtained by Western blotting, we should investigate the relationship between
SUVmax and the staining intensity and localization of
pAkt (Ser-473), pAkt (Thr-308) and pS6. On the other
hand, glucose transporters are responsible for 18F-FDG
uptake by cancer cells and GLUT1 expression has been
positively correlated with 18F-FDG uptake [32]. GLUT1
is thought to be a possible intrinsic marker of hypoxia,
and it has been reported that GLUT1 expression is
regulated by hypoxia via hypoxia inducible factor (HIF)1 [33]. Upregulation of the HIF-1 pathway has been
identified in RCC, and hypoxia is associated with higher
18
F-FDG uptake [12]. HIF-1 is considered to support
tumor growth by induction of angiogenesis via increased
Mizuno et al. BMC Cancer (2015) 15:114
Page 13 of 14
and shorter overall survival. These findings suggest that
SUVmax may be useful for predicting the biological
characteristics of RCC.
Competing interests
The authors declare that they have no competing interests.
Authors’ contributions
TM, TK* and HA initiated the study, participated in its design and coordination,
carried out the study, performed the statistical analysis. TM, TK* and HA drafted
the manuscript. SS, KK, DN, HY, TK, H.B., MY and YF carried out the study. YK and
K-IY participated in the design of the study and helped to draft the manuscript.
All authors read and approved the final manuscript.
Acknowledgements
The authors are special grateful to Dr. Kyoko Arai for her constructive
suggestions regarding statistical analysis, and Hitomi Yamazaki and Mai
Takahashi for her excellent technique in this study.
Author details
1
Department of Urology, Dokkyo Medical University, 880 Kitakobayashi Mibu,
Tochigi 321-0293, Japan. 2PET Center, Dokkyo Medical University Hospital,
Mibu, Tochigi, Japan. 3Department of Radiology, Dokkyo Medical University,
Mibu, Tochigi, Japan.
Received: 29 October 2014 Accepted: 20 February 2015
Figure 8 Overall survival curve in 25 metastatic tumors at
nephrectomy. This survival curve is based on the median values of
protein expression of pAkt(Ser-473) (A) and pAkt(Thr-308) (B), the
cases were divided into two groups at this levels - high and low
expression. P value was analyzed by log-rank test.
expression of VEGF and also by promoting anaerobic
metabolism [34]. Akt inhibition disrupts transcription of
GLUT1 and its translocation to the plasma membrane
to promote glucose utilization independent of an effect
on cell proliferation [15]. Accordingly, we should comprehensively investigate the role of HIF-1, GLUT1, Akt
in RCC in the future. Obtaining such information may
be important to elucidate the relationship between clinicopathological features and molecular changes associated with SUVmax, and will shed light on the clinical
issue of whether 18F-FDG PET is a useful modality for
therapeutic decision-making and monitoring.
Conclusions
A higher SUVmax on 18F-FDG PET is associated with
elevated tumor levels of pAkt and pS6 protein and with
aggressive behavior and metastatic potential of RCC, as
well as with early relapse following radical nephrectomy
References
1. Jemal A, Bray F, Center MM, Ferlay J, Ward E, Forman D. Global cancer
statistics. CA Cancer J Clin. 2011;61:69–90.
2. Motzer RJ, Bander NH, Nanus DM. Renal-cell carcinoma. N Engl J Med.
1996;335:865–75.
3. Cohen HT, McGovern FJ. Renal-cell carcinoma. N Engl J Med.
2005;353:2477–90.
4. Chaffer CL, Weinberg RA. A perspective on cancer cell metastasis. Science.
2011;331:1559–64.
5. Vander Heiden MG, Cantley LC, Thompson CB. Understanding the Warburg
effect: the metabolic requirements of cell proliferation. Science. 2009;324:1029–33.
6. Hanahan D, Weinberg RA. Hallmarks of cancer: the next generation. Cell.
2011;144:646–74.
7. Linehan WM, Rouault TA. Molecular pathways: fumarate hydratase-deficient
kidney cancer- targeting the Warburg effect in cancer. Clin Cancer Res.
2013;19:1–8.
8. Figlin RA, Kaufmann I, Brechbiel J. Targeting PI3K and mTORC2 in metastatic
renal cell carcinoma: New strategies for overcoming resistance to VEGFR
and mTORC1 inhibitors. Int J Cancer. 2013;133:788–96.
9. Abe H, Kamai T. Recent advances in the treatment of metastatic renal cell
carcinoma. Int J Urol. 2013;20:944–55.
10. Tunariu N, Kaye SB, de Souza NM. Functional imaging: what evidence is
there for its utility in clinical trials of targeted therapies? Br J Cancer.
2012;106:619–28.
11. Shankar LK, Hoffman JM, Bacharach S, Graham MM, Karp J, Lammertsma AA,
et al. Consensus recommendations for the use of 18F-FDG PET as an
indicator of therapeutic response in patients in National Cancer Institute
Trials. J Nucl Med. 2006;47:1059–66.
12. Thomas GV, Tran C, Mellinghoff IK, Welsbie DS, Chan E, Fuegar B, et al.
Hypoxia-inducible factor determines sensitivity to inhibitors of mTOR in
kidney cancer. Nat Med. 2006;12:122–7.
13. Ueno D, Yao M, Tateishi U, Minaminoto R, Makiyama K, Hayashi N, et al.
Early assessment by FDG-PET/CT of patients with advanced renal cell
carcinoma treated with tyrosine kinase inhibitors is predictive of disease
course. BMC Cancer. 2012;12:162. doi: 10.1186/1471-2407-12-162.
14. Kayani I, Avril N, Bomanji J, Chowdhury S, Rockall A, Sahdev A, et al.
Sequential FDG-PET/CT as a biomarker of response to Sunitinib in metastatic
clear cell renal cancer. Clin Cancer Res. 2011;17:6021–8.
15. Ma WW, Jacene H, Song D, Vilardell F, Messersmith WA, Laheru D, et al. [18F]
Fluorodeoxyglucose positron emission tomography correlates with Akt
pathway activity but is not predictive of clinical outcome during mTOR
inhibitor therapy. J Clin Oncol. 2009;27:2697–704.
Mizuno et al. BMC Cancer (2015) 15:114
16. Furuya N, Kamai T, Shirataki H, Yanai Y, Fukuda T, Mizuno T, et al. Serum
interferon alpha receptor 2 mRNA may predict efficacy of interferon alpha
with/without low-dose sorafenib for metastatic clear cell renal cell carcinoma.
Cancer Immunol Immunother. 2011;60:793–808.
17. Kamai T, Tsujii T, Arai K, Takagi K, Asami H, Ito Y, et al. Significant association
of Rho/ROCK pathway with invasion and metastasis of bladder cancer. Clin
Cancer Res. 2003;9:2632–41.
18. Fuhrman SA, Lasky LC, Lmas C. Prognostic significance of morphologic
parameters in renal cell carcinoma. Am J Surg Pathol. 1982;6:655–63.
19. Sobin LH, Gospodarowicz MK, Wittekind CH. International Union against
Cancer. UICC. In: TNM Classification of Malignant Tumors. 7th ed. New York:
Wiley-Liss; 2009. p. 255–7.
20. Kitajima K, Murakami K, Kaji Y, Sakamoto S, Sugimura K. Established,
emerging and future applications of FDG-PET/CT in the uterine cancer. Clin
Radiol. 2011;66:297–307.
21. Kitajima K, Murakami K, Yamasaki E, Fukasawa I, Inaba N, Kaji Y, et al.
Accuracy of 18F-FDG PET/CT in detecting pelvic and paraaortic lymph node
metastasis in patients with endometrial cancer. AJR Am J Roentgenol.
2008;190:1652–8.
22. Betsunoh H, Fukuda T, Anzai N, Nishihara D, Mizuno T, Yuki H, et al.
Increased expression of system large amino acid transporter (LAT)-1 mRNA
is associated with invasive potential and unfavorable prognosis of human
clear cell renal cell carcinoma. BMC Cancer. 2013;13:509. doi: 10.1186/
1471-2407-13-509.
23. Yuki H, Kamai T, Kubota K, Abe H, Nishihara D, Mizuno T, et al. Axitinib for
preoperative downstaging of renal cell carcinoma with sarcomatoid
differentiation and direct invasion of the duodenum and inferior vena cava:
A case report. OncoTargets Ther. 2014;7:289–95.
24. Lando M, Wilting SM, Snipstad K, Clancy T, Bierkens M, Aarnes EK, et al.
Identification of eight candidate target genes of the recurrent 3p12-p14 loss
in cervical cancer by integrative genomic profiling. J Pathol. 2013;230:59–69.
25. Sarbassov DD, Guertin DA, Ali SM, Sabatini DM. Phosphorylation and
regulation of Akt/PKB by the rictor-mTOR complex. Science. 2005;307:1098–101.
26. Arsham AM, Plas DR, Thompson CB, Simon MC. Akt and hypoxia-inducible
factor-1 independently enhance tumor growth and angiogenesis. Cancer
Res. 2004;64:3500–7.
27. Toschi A, Lee E, Gadir N, Ohh M, Foster DA. Differential dependence of
hypoxia-inducible factors 1 alpha and 2 alpha on mTORC1 and mTORC2.
J Biol Chem. 2008;283:34495–9.
28. Jonasch E, Corn P, Pagliaro LC, Warneke CL, Johnson MM, Tamboli P, et al.
Upfront, randomized, phase 2 trial of sorafenib versus sorafenib and low-dose
interferon alfa in patients with advanced renal cell carcinoma: clinical and
biomarker analysis. Cancer. 2010;116:57–65.
29. Hay N. The Akt-mTOR tango and its relevance to cancer. Cancer Cell.
2005;8:179–83.
30. Gerlinger M, Rowan AJ, Horswell S, Larkin J, Endesfelder D, Gronroos E, et al.
Intratumor heterogeneity and branched evolution revealed by multiregion
sequencing. New Engl J Med. 2012;366:883–92.
31. Namura K, Minamimoto R, Yao M, Makiyama K, Murakami T, Sano F, et al.
Impact of maximum standardized uptake value (SUVmax) evaluated by
18-Fluoro-2-deoxy-D-glucose positron emission tomography/computed
tomography (18F-FDG-PET/CT) on survival for patients with advanced
renal cell carcinoma: a preliminary report. BMC Cancer. 2010;10:667.
doi: 10.1186/1471-2407-10-667.
32. Kaira K, Endo M, Abe M, Nakagawa K, Ohde Y, Okumura T, et al. Biologic
correlation of 2-[18F]-fluoro-2-deoxy-D-glucose uptake on positron emission
tomography in thymic epithelial tumors. J Clin Oncol. 2010;28:3746–53.
33. Vleugel MM, Greijer AE, Shvarts A, van der Groep P, van Berkel M,
Aarbodem Y, et al. Differential prognostic impact of hypoxia induced and
diffuse HIF-1 alpha expression in invasive breast cancer. J Clin Pathol.
2005;58:172–7.
34. Ryan HE, Polni M, McNulty W, Elson D, Gassmann M, Arbeit JM, et al.
Hypoxia-inducible factor-1a is a positive factor in solid tumor growth.
Cancer Res. 2000;60:4010–5.
Page 14 of 14
Submit your next manuscript to BioMed Central
and take full advantage of:
• Convenient online submission
• Thorough peer review
• No space constraints or color figure charges
• Immediate publication on acceptance
• Inclusion in PubMed, CAS, Scopus and Google Scholar
• Research which is freely available for redistribution
Submit your manuscript at
www.biomedcentral.com/submit