IMPACT OF CAPITAL STRUCTURE ON PERFORMANCE OF VIETNAMESE FIRMS ON HANOI STOCK EXCHANGE DURING PERIOD 20152019
Bạn đang xem bản rút gọn của tài liệu. Xem và tải ngay bản đầy đủ của tài liệu tại đây (267.25 KB, 47 trang )
Dissertation submitted in partial fulfillment of the
Requirement for the MSc in Finance
FINANCE DISSERTATION ON
IMPACT OF CAPITAL STRUCTURE ON
PERFORMANCE OF VIETNAMESE FIRMS ON
HANOI STOCK EXCHANGE DURING
PERIOD 2015-2019
VU QUYNH ANH
ID No: 19046141
Intake 3
Supervisor: Dr. Tran Ngoc Mai
September 2020
EXECUTIVE SUMMARY
Whether there is an existence of an optimal financial structure for each business or
not and if so, how its effect on the company's performance is always a topic that attracts a
lot of attention and controversies from scholars for decades. In fact, a successful manager
is someone who can determine the optimal capital structure by minimizing the company's
financial costs and thereby maximizing company profits. It can be seen that capital
structure affects company performance.
This paper aims to examine the impact of capital structure on the performance of
firms listed on the Hanoi stock market in the period 2015 to 22019. Based on the
theoretical basis of capital structure and factors affecting the business performance of the
business from a number of previous related studies, both in Vietnam and abroad, the
author conducts the model construction and proposes research hypotheses. The data used
in this study is collected from the public financial statements of 100 companies listed on
the Hanoi Stock Exchange for the period 2015-2019. Data after collection were processed
on Eviews software for results. The results are then analyzed and discussed. Part of the
author's research results are consistent with the previous research results; part of the
results is not. Based on the research results, the author has proposed a few
recommendations to improve the performance of enterprises.
TABLE OF CONTENTS
2
2
2
3
3
3
LIST OF TABLES
CHAPTER I: INTRODUCTION
The relationship between capital structure theory and the performance of businesses
has been one of the subjects that have attracted the interest from scholars in the area of
corporate finance for decades. In the world, there are many studies analyzing the effect of
capital structure on business overall performance of companies (Shah, 2014;
Abeywardhana, 2016; Mouna, et al., 2017). . In terms of negative impact, Khan's study
(2012) showed that financial leverage as measured by short-term debt to total assets and
total debt to total assets has a significant negative relationship with the performance of the
business measured equal to the income index on total assets, gross profit margin and
market business efficiency index (Khan, 2012). The relationship between financial
leverage and firm's performance as measured by return on equity is negative but
negligible. The results of this study are similar to the findings of Umar et al. (2012),
Alawwad (2013), Salim and Yadav (2012), Zeitun and Tian (2007), Yana (2010), Abor
(2005).
. Therefore, the high level of debt in the capital structure will reduce the business
performance of the business and recommend that managers should not combine too much
debt in the capital structure of the business but should rely more on internal funds and
funds from shareholders of business (Khan, 2012).
In terms of positive impact, capital structure also positively affects business
performance of enterprises. Specifically, studies of Khatab et al. (2011), Ebrati et al.
(2013), Nirajini and Priya (2013) have shown a positive relationship between capital
structure and business performance of enterprises (Khatab et al., 2011; Ebrati et al.; 2013;
Nirajini & Priya, 2013). Research by Stohs and Mauer (1996) suggested that larger firms
are less risky when using long-term debt.
4
4
4
In Vietnam, there are several studies conducted on the same topic and also found
out both negative and positive impact of capital structure on effectiveness of business.
The research of Son and Hoang (2008) proposed the clear evidence of the effect of capital
structure on business performance of enterprises. Research results showed that business
performance of enterprises is affected by capital structure. Business performance has a
positive correlation with capital structure, business efficiency has close and quadratic
relationship with the capital structure of the enterprise when the debt ratio is below 100%,
negatively correlated with the capital structure (Son & Hoang, 2008). The approach of the
method of analyzing the path of Doan Ngoc Phi Anh (2010) has shown that business
performance and financial structure have a positive impact on the return on equity and
two factors. This explained 90% of the rate of return on equity and can draw conclusions,
businesses listed on Vietnam's stock market have used good leverage tools to improve
financial efficiency (Anh, 2010). However, research by Huynh Anh Kiet (2010) revealed
that corporate profits are significantly affected by variables of capital structure of total
debt to total assets, total debt to equity, long-term debt. term on total assets, short-term
debt on total assets (Kiet, 2010). Nguyen Tan Vinh (2011) studied the relationship of
companies listed on the Hanoi Stock Exchange and found a positive relationship (Vinh,
2011). Le and Phung (2013) used data of enterprises listed on Vietnam's stock market in
the period of 2007–2011 to study the relationship between capital structure and firm
performance and it showed that the use of debt has a positive relationship with the
performance of the business (Le & Phung, 2013).
The theoretical and empirical researches in the world all show that there are many
different factors affecting the capital structure of enterprises. Different observations and
data over different time periods produce very different conclusions. Therefore, when it
comes to factors that have a real impact on the capital structure of the business, it is
necessary to consider and analyze based on the specific characteristics of the research
object. At the same time, to determine the target capital structure of the business, it is
necessary to base on the estimated results of the model of factors affecting the capital
structure of the business. In Vietnam, many studies on capital structure have been carried
out. However, empirical evidence on the relationship between capital structure and firm
performance in Vietnam is limited and has some limitations. On the other hand, previous
research on capital structure of enterprises was only done for a short time of about 2 to 3
years. Hence, it is not long enough to see a trend in the long term. Therefore, this
5
5
5
dissertation, on the basis of inheriting the advantages of previous studies such as
inheriting the theoretical basis of the factors affecting the capital structure of the
enterprise, inherits the theoretical basis of the influence of capital structure on the
business performance of the enterprises. With topic "The impact of capital structure on
performance of Vietnamese firms in the period of 2015 -2019", the dissertation will add
the following research gaps: i) Synthesizing and giving a theoretical point of view on the
capital structure of the business; ii) Analyzing the impact of capital structure on business
performance of listed companies on Hanoi stock market through the implementation of
quantitative research with the latest data from 2015 to 2019.
6
6
6
CHAPTER II: LITERATURE REVIEW
2.1. The capital structure of enterprise
Capital structure is a topic of great interest to researchers. The first concept of
capital structure was the postulate of Modigliani and Miller published by using these two
authors in 1958. After that, the theory of capital structure was further researched and
developed by researchers. The static trade off theory, dynamic trade off theory, theory of
Modigliani and Miller, pecking order theory and market timing theory are most
significant theories on capital structure in the records of empirical research and studies
about this issue. This part focuses on providing definitions of capital structure as well as
literature review on theories of capital structure.
2.1.1. Definition of capital structure
Capital structure, also known as financial leverage, is the percentage of total debt to
total assets of a firm at a given time (Saad, 2010). The capital structure involves the use of
borrowings. The downside of debt is that the more debt the enterprises borrow, the cost of
financial exhaustion will occur, and at some points the present value of the cost of
financial exhaustion will suppress the present value of the tax shield from debt
(Modigliani & Miller, 1963). The cost of debt has a significant impact on business
operations, even leading to the closure of the business. Financing from equity does not
create the cost of capital for businesses, but shareholders can interfere with the operations
of the business. High expectation on the business performance of investors also creates
considerable pressure on the management team. Another condition of the optimal capital
structure is to consider the business situation of the business which is the earning before
tax and interest (EBIT) must overcome the bladder point so that the business can take
advantage of its debt balance (Addae, et al., 2013). One of the difficult issues of corporate
finance managers is how to build the capital structure of the business, how much equity,
how much bank loans to maximize business value or optimal capital structure
construction (Saad, 2010). This is an interesting issue both in theoretical research and in
practical application. With the optimal capital structure, it is possible to increase the
enterprise value by using appropriate financial leverage ratio. Under this approach,
businesses can lower the cost of capital through increasing debt use because debt costs are
lower because there are tax savings. However, as the debt ratio increases, so does the risk,
so investors (directly and indirectly) require an increase in profits, at some point the
benefits of tax savings enough to offset the increase in the average cost of capital, making
7
7
7
the benefits of debt use no longer available (Ajanthan, 2013). Thus, if the capital structure
of the business is financed by 100% equity, on the one hand, it shows that the enterprise is
active in capital (not dependent on external capital) and has no financial risks, but on the
other hand, businesses also incur a high average cost of capital as the cost of equity is
often higher than the cost of debt. In contrast, when an enterprise uses debt to finance its
capital structure, it can reduce the average cost of capital of the business, but it can
increase the risk in debt repayment, especially in in case the enterprise uses a debt ratio
that is too high to exceed a certain limit, in addition to making the payment risk increase,
the average cost of capital is increased. This makes the business always have to set up an
optimal capital structure to minimize financial risks and reduce the average cost of capital
(Zeitun & Tian, 2007).
2.1.2. Theoretical background
2.1.2.1. Theory of Miller and Modigliani (M&M theory)
Miller and Modigliani (1958) argued that in a perfect market, capital structure does
not affect firm value (Modigliani & Miller, 1958). Therefore, there is no most effective
capital structure for a unique business. However, the assumptions of a perfect market
such as no transaction costs, no taxes, proportional information, interest rates equal to
risk-free rates are not suitable for the operating environment of the above enterprise in
reality. Therefore, the researchers make the assumption that firm value and firm's
performance are affected by capital structure. Modern capital structure theory has been
around since 1958, when Franco Modigliani and Merton Miller announced. M&M theory
is stated into two important clauses. The first clause mentioned about business value. The
second clause claimed about the cost of capital. These propositions, in turn, will be
considered in two cases corresponding to two main assumptions: with and without
corporate income tax.
M&M theory in the absence of tax:
With some assumptions including no corporate income tax and personal income tax,
no transaction costs, no bankruptcy costs and no financial distress costs, same interest
rates for both individuals and businesses and perfect capital market, the content of M&M
theory is stated in two clauses. The first clause: Enterprise value: in the absence of tax,
the value of a business with debt is equal to the value of an enterprise without debt. The
second clause: cost of capital: the required return on equity is positively related to the
level of leverage or debt ratio, expressed as the following formula:
8
8
8
o rs = r0 + (r0 – rB) B / S
Notes:
rs: the required or expected return on equity
r0 is the cost of capital use if an enterprise uses 100% equity
rB: interest rate or cost of debt
B: The value of the debt or bond of the issuing business
S: is the value of an enterprise's equity
M&M theory in case of taxation:
With taxation, the M&M theory has been stated in two clauses. The first clause: the
value of enterprises in the case of tax: in the case of corporate income tax, the value of
levered enterprise is equal to the value of unlevered enterprise plus the present value of
the tax shield provided by debt expressed as the following formula:
VL = VU + Btc
The second proposition: The cost of capital in the case of a tax: the required return
on equity is positively related to the level of leverage or debt ratio.
rs = r0 + (r0 – rB) (1- Tc) B / S
The M&M theory of capital structure is considered a modern theory that explains
the relationship between firm value, capital cost and debt usage level of the business.
However, the M&M theory has not considered the impact of some other costs, leading to
the reduction of tax benefits and the elimination as businesses increase debt ratio. When
an enterprise increases debt usage, its risk increases accordingly. This results in expenses
such as financial distress costs that simultaneously impact the benefits of the tax shield, to
a point where they will outweigh the benefits of the tax shield. At that point, called the
optimal capital structure point, the value of the business is maximized.
Inheriting the research results of Miller and Modigliani, a series of theories on
capital structure were introduced to explain the capital structure of enterprises, including:
static trade theory, dynamic trade theory, order theory and market timing theory.
2.1.2.2. Agency costs theory
In financial management, the problem of agents always contains potential conflicts
of interests between shareholders or investors and business managers. Jenshen and
Meckling (1976) argued that there are two types of agent conflicts: owners and business
managers and creditors. For conflicts between the owner and the manager, the
representative problem arises when the manager owns less than 100% of the equity. As a
result, the owner does not gain all the profits from the profit enhancement activities of his
business, but he incurs all the costs for these activities (Jensen & Meckling, 1976). In
9
9
9
order to reduce agent conflicts, the owner agrees to pay agent costs, such as expenses to
monitor operations (audit activities), expenses to restructure the organization to limit acts.
undesirable, and opportunity costs when shareholders impose limits on management.
Conflicts between creditors and business owners appear in loan contracts, when taking
into consideration loan levels for investments. . However, if the investment is
unsuccessful, the business owner will suffer some loss due to the limited liability of the
investment. As a result, business owners may be at a disadvantage from investing in highrisk projects (Jensen & Meckling, 1976). And creditors often offer a mechanism to protect
themselves by establishing restrictive terms in loan contracts. These provisions impede
businesses' operation in certain respects. Businesses are also monitored to ensure that the
terms are followed. The costs in this case are transferred to the owner in the form of
higher borrowing costs. For small businesses, the representation problem is more serious
than large businesses because small businesses are not required to disclose information,
thus leading to significant costs when providing grant information to outsiders. Studies on
agency costs show that, similar to the case of financial bankruptcy, agency costs reduce
the benefits of debt financing. In this model, Jenshen and Meckling (1976) suggested that
an optimal capital structure can be achieved by balancing agency costs with the benefits
of debt use. The theory of agency costs is a concern for small businesses because agency
costs arise from the underlying conflicts of interest between the owner and the creditors
(Panda & Leepsa, 2017).
2.1.2.3. Static trade-off theory
This theory is called the trade-off theory of financial leverage. Businesses trade the
tax benefits of debt financing with bankruptcy-related problems. Miller and Modigliani
(1963) loosened assumptions by considering corporate income tax as a factor determining
capital structure (Modigliani & Miller, 1963). From a corporate perspective, using debt
can increase a firm's value due to the benefits of the tax shield from debt. Therefore,
according to Miller and Modigliani (1963), businesses should use debt as much as
possible to maximize business value (Modigliani & Miller, 1958). However, the excessive
use of debt also incurs costs for businesses such as financial draining costs and agency
costs (Jensen and Meckling, 1976; Myers, 1977). The static trade-off theory considers an
objective (optimal) capital structure of an enterprise that is determined by the trade-off
between the marginal benefit of tax (tax shield) and the associated cost to debt (cost of
financial exhaustion and agency costs). As the firm raises its debt-equity ratio, the
10
10
10
benefits of its tax shield will increase. The excessive degree of leverage also promotes
commercial enterprise performance through reducing the fighting of interest between
shareholders and managers regarding free money flow (Jensen, 1986), top of the line
investment strategy (Myers, 1977). However, the excessive level of leverage
simultaneously increases the fee of monetary exhaustion. Increasing the level of debt use
will increase the burden of paying principal and interest in the future, thereby increasing
the likelihood of bankruptcy. The debt/ equity ratio will reach the optimal level
(equilibrium) when the present value of the tax shield from debt is equal to the present
value of the cost of debt usage. If the firm continues to increase its debt-to-equity ratio
and exceeds the equilibrium, then the present value of the cost of debt usage will be
greater than the present value of the tax shield from debt. This not only does not benefit
from the use of debt, but also reduces the value of the business. Therefore, corporate
financial managers need to calculate the trade-off between the benefits and costs of debt
usage in order to determine an optimal capital structure appropriate for their business,
thereby achieving the goal which is to maximize the value of business.
2.1.2.4. Dynamic trade off theory
The static trade-off theory of capital structure states that an enterprise will build its
own target capital structure based on the calculation of debt benefits and bankruptcy
costs. Meanwhile, the dynamic trade-off theory of capital structure states that a firm will
adjust its capital structure to the target over time if its target capital structure deviates
from its target capital structure. original. Therefore, it can be seen that, unlike the static
trade-off theory of capital structure which assumes that an enterprise is always at the level
of optimal capital structure, the dynamic trade-off theory of capital structure assumes that
in practice. Capital structure decisions are constantly being changed and the adjusted to
be optimal depending much on the expectation as well as the cost of the capital structure
adjustment, so businesses often restructure the capital structure over time.
The theory of dynamic trade-off was proposed by Fischer et al. (1989). They argued
that there is the cost of equity capitalization in selecting the model of dynamically optimal
capital structure (Fischer, et al., 1989). This showed that the capital structure of
enterprises does not always match the optimal capital structure. In other words, the firm
determines a fluctuation margin for the debt ratio. In the model of dynamic optimal
capital structure, funding decisions depend specifically on the marginal financing that
businesses anticipate in the coming period. Gradually, the capital structure of the business
11
11
11
will approach the optimal capital structure. According to this theory, the higher the
profitability of a business, the greater the benefit from the tax shield the more they
borrow. Therefore, businesses should operate with higher leverage to take advantage of
the tax shield. Although the cost of financial exhaustion or the possibility of bankruptcy
will also be higher when businesses operate at a high level of leverage, many studies
show that the cost of bankruptcy exists, but it only accounts for a relatively small portion.
Small compared to the tax shield benefits. Therefore, this concept explains the wonderful
relationship between capital structure and association performance. A variety of studies
by researchers in this field also confirmed this positive relationship (Roden and Lewellen,
1995; Hadlock et al. 2002; Berger and Patti, 2006)
2.1.2.5. Pecking order theory
Miller and Modigliani (1963) assume that investors have balanced information in a
perfect market (Modigliani & Miller, 1963). However, this assumption is not suitable for
the operating environment of the business because the manager will usually have more
information about the business than the investor. In other words, asymmetric information
plays an important role in today's operating environment. Myers and Majluf (1984) have
taken the view of opposite choice into the theory of classification order (Myers & Majluf,
1984). Managers know the real value as well as the development opportunities of the
business, while investors can only know these values through prediction. When financial
managers decide to finance with external capital (through the issuance of shares),
investors see this as a signal for businesses being overvalued. Therefore, investors tend to
sell their stocks and as a result, stock prices will fall. In order to avoid a stock price
decline, the business will finance its investment needs in the following order: using
internal capital first as retained earnings (no asymmetric information exists), then making
a loan and finally issuing stocks. According to this theory, the company will not have an
optimal capital structure. According to the pecking order theory, firms that produce high
profits tend to use retained earnings to finance investment needs. Therefore, the
relationship between debt use and performance is opposite. Many studies have also
provided evidence to prove this negative relationship (Shyam-Sunder and Myers, 1999;
Simerly and Li, 2000; Fama and French, 2002).
2.1.2.6. Market timing theory
Baker and Wurgler (2002) brought a new capital structure principle known as the
market timing concept (Baker and Wurgler, 2002). Researching in the USA market from
12
12
12
1968 to 1999, Baker and Wurger have shown that businesses will issue shares at a time
when their prices are overvalued, and repurchase in case the stock price is set too low
(Baker & Wurgler, 2002). These two authors have confirmed the long-term impact of
market timing theory on capital structure. However, this finding faces mixed opinions
from other researchers such as Flannery and Rangan (2006), Alti (2006) and Kayhan and
Titman (2007), which is the market timing theory most appropriately explains the capital
structure status of businesses; at the same time, it is pointed out that fluctuations in the
stock market price will significantly affect the capital structure of the business. An
optimal capital structure does not exist and that the formation of firm capital structure is a
consequence of the decisions to change the capital structure of firm management at the
times of market valuation of business.
The analysis of the capital structure theories above shows that firm financing
decisions are influenced by many factors, and the interpretation of funding decisions is
made by a specific theory (such as trade off theory, pecking order theory, etc.) may not be
suitable because each capital structure theory is inherently valid within its assumption.
This explains why the empirical research results are different or even contradictory when
referring to the relationship between capital structure and firm performance.
2.2. The performance of the firm
2.2.1. The theory of business efficiency
Standing on many different perspectives, there are different concepts about business
performance. From the perspective of purpose-based efficiency, business efficiency is
defined as the difference between the results obtained and the costs. This understanding is
consistent with the profitability of the business. On the other hand, from the perspective
of each factor to consider, the effectiveness shows the level and ability to use the factors
in the production and business process (Wilson, et al., 2018).
It can be said that although there is a consensus that the category of business
performance reflects the quality side of business operations of the business. Therefore, to
achieve high efficiency, there must be a combination of two factors: cost and results, cost
is a premise for businesses to implement the set results. Costs include labor, labor
resources, employees and business capital (fixed and working capital) and the results are
measured by indicators such as product volume and net profit (Neely, 2007).
To accurately evaluate business performance, businesses can calculate in the
following two ways according to Phong (2007):
13
13
13
Calculation by difference: with firm performance equal to outputs minus all input
expenses:
Firm performance = Outputs - Input expenses
This calculation is simple and convenient but does not reflect all business quality as
well as potential for improving business efficiency. In addition, if it is not possible to
compare the business performance among departments and units in the enterprise, there is
no saving or wasting social labor.
Calculation by fractional form: with firm performance equal to the outputs divided
by the total input expenses:
Firm performance = Outputs / Input expenses
This method overcomes the problems when calculated in the form of differences, it
has facilitated comprehensive research on business performance.
According to the above understanding, firm performance is a quantity comparing
between the cost and the achieved result (Phong, 2007). Firm performance is improved in
the case of increased results, reduced costs and also in the case of increased costs, but the
rate of increase in results is faster than the rate of increase in expenses paid to achieve
such results (Phong, 2007).
Business performance of a business can be assessed through many aspects
including: labor productivity, profitability, growth and even customer satisfaction.
Financial instruments are often used to assess the strengths, weaknesses, opportunities
and challenges for businesses or to measure business performance of enterprises such as
return on investment, surplus income, earnings per share, dividend ratio on stock market
price, stock market price coefficient on earnings of stocks, revenue growth rate, market
capitalization (Neely, 2007). Analysis of business performance occupies an important
position in the process of business operations of an enterprise, which is an effective
management tool that businesses have used so far, helping businesses to self-assess,
considering how the implementation of economic indicators, the economic goals to be
realized from there to find out ways to take full advantage of the strengths of the business
(Wilson, et al., 2018). That means business performance analysis is not only the end of
one business cycle but also the start of the next business cycle. In addition, business
performance analysis is meaningful for those who are interested in businesses, especially
investors, banks and suppliers because analyzing business performance will help them
have information. to make more accurate, timely decisions.
14
14
14
2.2.2. Firm’s performance measurement
The performance of the company is a very important criterion for stakeholders such
as shareholders, board of directors, creditors, customers... in making strategies and
decisions for business and investment. Currently, there are many perspectives in the world
to measure the performance of businesses in general and joint stock companies in
particular. In particular, each perspective as well as each author studying the performance
of businesses also have different views on the indicators to measure the effectiveness of
the company.
According to Ngo Dinh Giao (1997), "performance" is an economic category
reflecting the process of using resources (human, financial, material and capital) to
achieve the exact goal (Giao, 1997). In addition, it showed the relationship between the
results obtained and the total costs to get that results, reflecting the quality of that
economic activity (Giao, 1997).
"Operational efficiency" is an integrated economic indicator reflecting the level of
use of material and financial resources of enterprises to achieve the highest efficiency
(Nguyen Nang Phuc, 2011). The author also gave the following indicators of business
performance measurement: (1) Considering the relationship between outputs and inputs:
Operational efficiency = Output / Inputs and (2)Considering the relationship between
inputs and outputs: Operational efficiency = Inputs / Outputs.
According to Hult et al. (2008), evaluating the way performance is measured in
published scientific research on international business enterprises, including corporate,
company and strategic business units (Hult, et al., 2008). In the context of strategic
business, the three criteria used to measure operational efficiency including financial
efficiency, business performance and aggregate efficiency. The financial performance in
many studies around the world is often measured by the rate of return on revenue (ROS),
the rate of return on invested capital (ROI), the rate of return on total assets (ROA) ,
return on equity (ROE), common equity earnings (EPS), and the Tobin'Q index. Business
performance is measured by market share, frequency of introducing new products and
inventions, quality of goods or services, labor productivity, satisfaction and retention of
the labor force. The synergistic effect usually includes reputation, viability, the level of
achieving goals, and comparisons with competitors.
The use of indicators to measure company performance, financial performance,
company value, company profits or profitability used by the authors in other studies are
15
15
15
also very different such as: Yermack (1996) and Mak and Kusnadi (2005) used Tobin'Q,
Pandya and Rao (1998), Tian and Lau (2001), Rouf (2011), Raza (2013), Moscu (2013)
used ROA and ROE; Bennedsen et al (2008), Uwuigbe and Fakile (2012) used ROE,
Belkhir (2009) used Tobin’Q and ROA; Guest (2009) used ROA, Tobin’Q and EPS,
Kutubi (2011), Khatab et al (2011) and Vo Hong Duc and Phan Bui Gia Thuy (2013a)
used ROE, ROA and Tobon’Q; Eisenberg et al (1998), Lee and Filbeck (2006),
Bennedsen et al (2008), Kaymak and Bektas (2008), Al-Matari et al (2012), Ghabayen
(2012), Vo Hong Duc and Phan Bui Gia Thuy (2013b), Peni (2014) and Umer (2014) used
ROA. In general, in the researches related to company performance, ROA and ROE are
the two most commonly used indicators. However, the value of these two indicators may
depend on the calculation of profitability. Thus, depending on the viewpoints and research
data sources, each author will choose the appropriate indicators to measure the
performance of the company.
2.3. Literature review
The capital structure of businesses includes the structure of internal and external
sources of funding used for business activities. In general, the views based on financial
resources suggested that if enterprises are credit constrained, they will affect the output
performance as well as not guarantee the business continuity (Oyedokun, et al., 2018).
When the borrowed enterprise requires it to be paid on time and if these obligations are
not fulfilled the creditors may request the business to go bankrupt. Therefore, one factor
that is considered to affect the firm's ability to develop is the level of leverage, as well as
how the enterprise can choose debt structure or equity structure in capital structure of
business (Iqbal & Usman, 2018).
The impact of the capital structure on business performance is proposed, because
this is an indicator that can provide information about the internal financial position of the
business. An enterprise with an inadequate debt ratio will lack financial flexibility and
will be very sensitive to economic shocks, if it is in a state of high debt, it is difficult for
them to borrow more money to cover its debts (Borhan, et al., 2014). Businesses that
want to grow need to have a balance between internal financing and external debt and a
higher proportion of equity financing, to avoid business risks by businesses rated as
sensitive to economic fluctuations.
The effect of capital structure on the business performance of enterprises is
explained on the basis of the theory of capital structure in terms of performance.
16
16
16
According to the traditional view of capital structure, firms using debt will be more
beneficial than firms that depend on equity, since the cost of equity is considered to be
higher than that of debt. This is true in practice when using ROE (Salim & Yadav, 2012).
However, financial risks and capital costs also increase with the use of more debt.
Therefore, the optimal capital structure is proposed from this perspective with the goal of
minimizing weighted average cost of capital (WACC) and maximizing business value.
Assuming no transaction costs, income taxes, bankruptcy costs, and interest rates
are consistent across businesses, modern capital structure theory began with Modigliani
and Miller's article in 1958 (M&M theory) argued that capital structure does not affect
firm value (Modigliani & Miller, 1963). However, the assumptions made by the M&M
model are only possible in effective market conditions. In the case of taxes, financial
leverage increases the value of the business by exactly the amount of tax savings.
When considering the cost of financial exhaustion resulting from debt use, the
trade-off theory also suggested that firms that are likely to be financially constrained will
use less debt in their capital structure to avoid risks from using debt only make sense
when businesses have to fulfill tax obligations (Jensen & Meckling, 1976). In the case of
businesses, the tax benefit that increases business efficiency is not the main consideration.
The positive impact of capital structure on business performance is the financial
flexibility to carry out business opportunities as well as a certain certainty about the low
risk of business owners following the suggestion of this theory (Jensen & Meckling,
1976).
The pecking order theory provided an inverse relationship between the debt-leaning
capital structure and the business performance of firms and the interpretation based on the
information asymmetry problem that only businesses are effective (Myers & Majluf,
1984). Poor business results, accumulated profits are not enough to finance the activities
of the business, so they must borrow external capital. This problem, some studies show
that enterprises do not have enough accumulated profits to bring the role of debt down to
the second order. Therefore, the role of debt in capital structure for business performance
should be considered simultaneously between the basic interpretations of capital theory,
theories that are primarily directed at small and medium sized businesses (Oyedokun, et
al., 2018).
For businesses, capital is essential to the formation, expansion and survival of the
business. Evan and Jovanovic (1989) have discovered financial constraints as well as the
17
17
17
ability of liquidity to prevent individuals from participating in business ownership. A
capital structure with small capital size and the lack of debt due to financial constraints
prevent businesses from having enough financial resources to be the basis to help
businesses succeed in the future. Therefore, the capital structure is considered to have a
positive effect on the business performance of businesses (Shah, 2014).
2.4. Research hypotheses
H1: Liquidity and tax has a positive (+) impact on business performance
The theory of capital structure states that when a business starts to borrow, it will
have the advantage of a tax shield. The low debt cost combined with the advantage of tax
shield will make the average cost of capital right to decrease when debt increases.
However, as the debt-to-equity ratio increases, the impact of the debt ratio forces the
owners to increase their required return, which means the cost of equity increases. At a
high debt-to-equity ratio, debt costs also increase because of a higher likelihood of
defaulting (higher risk of bankruptcy).
Studies in the world showed that debt ratio has an impact on business performance,
but at different debt ratios can have positive or opposite effects on business performance
(Zeitun & Tian, 2007; Onaolapo & Kajola, 2010; Margaritis & Psillaki, 2007; Weixu,
2005)
H2: The size of the business has a positive impact on business performance
Analysis of the current business situation of construction enterprises shows that
large-scale enterprises will have more advantages than small-scale enterprises. Because
the construction industry is characterized by buyers who choose sellers through
competitive bidding or contractor designation. Large-scale businesses must first be
branded, reputable and many who knows. Second, large-scale businesses with financial
strength, assets, technology and management capabilities will easily exploit economies of
scale to minimize input costs and increase costs. Increasing output efficiency to minimize
product costs. Therefore, large-scale enterprises are more likely to win bids or be
designated as contractors than small businesses, thus having the opportunity to increase
sales, seek profits, improve business efficiency. According to research by Onaolapo &
Kajola (2010), the size of the business has a positive impact on business performance
(Onaolapo & Kajola, 2010).
H3: Financial leverage has inversely proportion relationship with business
performance
18
18
18
According to Trade-off theory, firm's value has a positive relationship with the ratio
of corporate debt, but when the ratio increases to a certain threshold, the efficiency of the
business decreases (performance will be negatively correlated with debt ratio). If the
business continues to increase the debt ratio, it will make the company's operating
efficiency decrease, that is, the debt ratio to total assets and the performance of the
company has a nonlinear relationship. Financial leverage has a positive impact on
businesses. Therefore, businesses need to adjust the debt to equity ratio appropriately,
through increasing or reducing debt to achieve the highest efficiency depending on the
type of business (Madan, 2007).
Khatab et al. (2011) on corporate performance and corporate performance, with a
sample of 20 listed companies on Karachi stock market, period 2005-2009 (Khatab et al.,
2011). The results of this study showed that, financial leverage has a positive impact on
Tobin'Q, ROA and ROE. Research results of Rajan and Jingales (1995) suggested that
debt ratio has a nonlinear relationship with firm performance (Rajan & Jingales, 1995).
Research results of Tam (2011), Pouraghajan et al. (2012) revealed that there is a
significant negative relationship between debt ratio and financial performance (ROA and
ROE) (Tam, 2011; Pouraghajan et al., 2012). Studies by Shubita and Alsawalhah (2012)
and Raza (2013) suggested that there is a negative relationship between financial leverage
and profitability (ROE) (Shubita & Alsawalhah, 2012; Raza, 2013). According to research
results of Guest (2009), Topak (2011) and Dogan (2013), financial leverage has a positive
relationship with ROA (Guest, 2009; Topak, 2011; Dogan, 2013).
According to M&M and agency costs theory, at a predetermined level of firm debt,
the firm's performance is positively correlated with the ratio of debt and Reduces agency
costs. When the debt ratio exceeds a certain level, the performance is negatively
correlated with the debt ratio because the benefit gained from the additional debt is
smaller than the increase in the agent's cost of issue.
H4: There is a positive relationship between tangible assets of an enterprise
and its performance.
The structure of tangible assets is measured through the ratio of tangible fixed
assets to total assets. Because tangible fixed assets can be used by the enterprise as
collateral when borrowing, so if the tangible fixed assets of a large enterprise are lenders
(such as banks) may reducing risks and thereby reducing lending costs. Thus, in theory,
when the proportion of tangible fixed assets accounts for a large proportion, enterprises
19
19
19
have the opportunity to mortgage these assets to access external capital more easily, in
other words, enterprises. will increase borrowing capacity. Research by Scott (1976) and
Harris and Ravis (1990) have shown that for firms with a high ratio of fixed assets to total
assets, lenders will be more willing to provide loans and so on (Scott, 1976; Ravis, 1990).
The debt to equity ratio will be higher. Most studies such as Titman and Wessels (1988),
Rajan and Zingales (1995), Ozkan (2001) have shown that there is a positive relationship
between the tangible asset structure and the capital structure of enterprise (Titman &
Wessels, 1988; Rajan & Zingales, 1995; Ozkan, 2001).
Tangible assets: This is considered as one of the main factors determining the
performance of enterprises. Most qualitative studies suggest that there is a positive
relationship between tangible assets and firm performance. Mackie and Mason (1990)
concluded that a firm with a high proportion of factory and equipment values in total
assets is more likely to be in debt and more likely to perform better (Mackie & Mason,
1990). Akintoye (2008) argued that an enterprise investing heavily in tangible assets has
lower financial risk costs than other firms investing in intangible assets (Akintoye, 2008).
It is expected that there is a positive relationship between assets tangibility of the business
and its profitability.
20
20
20
CHAPTER III: DATA AND METHODOLOGY
3.1. Structure characteristics of listed companies on Hanoi Stock Exchange
3.1.1 Hanoi Stock Exchange
The Hanoi Stock Exchange (HSE) was established under the Prime Minister's
Decision No. 01/2009 / QD-January 2, 2009, on the basis of converting and reorganizing
the Hanoi Securities Trading Center. The duties and powers of the Hanoi Stock Exchange
include operating under the Securities Law, the Law on Enterprises, the Charter of the
Stock Exchange and other relevant laws.
By March 2010, the Hanoi Stock Exchange had a total of 260 listed companies with
a total of nearly 2 million listed stocks with a market value of about VND 65,000 billion,
the market size has increased but operated. not really stable, still showing an instability in
the trading activities of the market, the main reason still depends on the psychology of
short-term investment. Although the capitalization of the market has increased rapidly, in
general, the market size of Vietnam is still small compared to other countries.
3.1.2. Capital structure characteristics of companies listed on the HSE
Listed companies with sales of over VND 500 billion tend to increase. This proves
that the business scale of listed companies is expanding and the products of listed
companies are accepted by consumers. The companies listed on the Hanoi stock market
are mostly profitable businesses accounting for 98% of the total listed companies on the
market (HSE, 2014). Thereby, showing that these companies are currently operating very
well.
Thus, despite the fluctuations of the domestic and regional economic environment
and the instability of the world economy, the business activities of these companies tend
to be good, profitable and some public company has high economic efficiency compared
to the common ground, thus contributing to create a peace of mind about investing in
securities of investors.
21
21
21
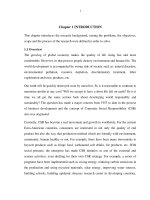
Table 1: Revenue and Profit by industries in HSE (2014)
Industries
Candy
Concrete
Wine and soft drinks
processing food
Seafood processing
Processing and processing
Average revenue
Average profit
Profit/Revenue
(VND)
460,375,000,000
402,349,000,000
(VND)
20,363,000,000
26,255,500,000
(ROS)
323,670,000,000
12,239,333,333
4%
263,406,000,000
15,372,000,000
6%
213,376,666,667
4%
7%
of mechanical steel
Oil and gas services
Medicine
Ceramic tiles - facing stone
Industrial goods
Specialized chemicals
Gas business
Apparel and shoes
Plastic construction
Agricultural products
Milk product
Producing and trading in
5,035,666,667
2%
228,184,000,000 33,300,000,000
326,888,000,000
9,685,000,000
5,549,298,500,000 323,039,500,000
306,964,000,000
7,673,500,000
239,558,636,364 18,714,181,818
827,370,000,000 73,858,000,000
3,742,838,000,000 172,888,000,000
1,759,615,500,000 33,290,500,000
264,771,000,000 13,138,500,000
605,006,000,000 107,675,666,667
15%
3%
6%
2%
8%
9%
5%
2%
5%
18%
Coal and Steel
Cigarette
Commerce
Cultural products
Carriage
Shipping
General agricultural
13,978,000,000
4%
353,856,000,000 (37,277,000,000)
1,399,660,666,667 29,155,000,000
1,765,259,800,000 62,512,000,000
592,834,000,000 13,641,000,000
1,184,281,000,000 30,560,000,000
-11%
2%
4%
2%
3%
materials Construction
Cement
Candy
Concrete
Wine and soft drinks
357,537,000,000
154,332,000,000
9,146,000,000
6%
495,019,833,333 10,294,000,000
287,521,666,667 (118,024,000,000)
957,345,000,000 46,730,500,000
2%
-41%
5%
575,852,784,314 18,873,078,431
3%
processing food
668,237,222,222
53,883,111,111
8%
Seafood processing
From the table above, it can be seen that oil and gas services has the highest ROS
with 15% while candy industry has the lowers ROS (HSE, 2014).
According to some previous empirical research on the capital structure and its
impacts on firms in Vietnam, firms should be classified based on authorized capital scale
to evaluate revenue and profit before tax (Nguyen & Nguyen, 2015; Thanh & Huong,
2016; Anh & Thao, 2019). These research also pointed out two types of firms based on
22
22
22
authorized capital scale including authorized capital firms above 80 billion and the ones
below 80 billion. Therefore, in this research, the author also divided firms into two types
as demonstrated in Table 2 below:
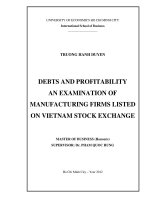
Table 2: Revenue and profit before tax according to types of firms based on
authorized capital scale (HSE, 2014)
Types of firms based on
authorized capital scale
(VND)
Authorized capital firms above
80 billion
Authorized capital firms below
80 billion
Average revenue Average profit
(VND)
Revenue/Profit
(VND)
951,170,085,366 41,139,585,366
4.33%
141,159,205,882
5.08%
7,165,343,137
Business performance has not necessarily increased with scale, or in other words,
large companies have advantages in business but it is unlikely to achieve higher
performance than smaller ones.
3.1.3. Situation of financial structure of listed companies
The average debt ratio to total assets of listed companies is 60% in 2014 (HSE,
2014). Compared with the ratio of the total assets of 5991 state-owned enterprises
nationwide which was listed at 0:00 on January 1, 2000 of the Ministry of Finance, it is
54.1%, the debt ratio of listed companies is higher (Ministry of Finance, 2014). This
showed that the public companies have not yet exploited the investment capital from the
shareholders for production and business activities.
Assessing the financial structure of an enterprise based on its capital structure
reflects its purpose of capital use. The ratio of short-term debt is 48.8%, so the units still
depend heavily on short-term capital, showing that most of the loans are short-term to
supplement the current needs of working assets of enterprises (Phong, 2007) . In fact,
companies only borrow short-term from banks is mainly to supplement the demand for
working assets, while long-term loans to invest in fixed assets are very few at only 11.4%
(Le & Phung, 2013). Therefore, in order to get long-term loans to serve the needs of
investing in fixed assets to expand production, technological innovation cannot be
expected in banks.
A study of the current financial structure of listed companies shows that these
companies have a financial structure with relatively low debt ratio, high financial
23
23
23
autonomy and loan structure. Mostly are short-term loans to supplement current assets.
However, to assess the factors affecting the capital structure and capital structure on the
impact on the value of the business, it is vital to conduct a specific analysis of each factor
as well as each capital structure.
3.2. Data
3.2.1. Source of research data
The data source used for this thesis is a secondary data source, the information is
mainly taken from the annually audited consolidated financial statements and annual
financial statements of the joint stock companies manually collected on websites of 99
companies in Vietnam. Research data was conducted with 99 companies, 2015-2019.
The study period was selected from 2015-2019 because: companies share the same
economic context. Data from 99 selected joint stock companies meet the research
objectives and create a balanced data table (combining time series and cross data).
After selecting and extracting data from the balance sheet, income statement and
annual report for 99 joint stock companies into Eviews software to process and calculate
the value of variables in the research model.
3.3. Research methodology
The research method used in this thesis is quantitative research method, through
descriptive statistical analysis, correlation coefficient matrix, performing tests and
running regression models with software Eviews. And the data analysis is done in
sequence. First, the author conducts descriptive statistical analysis to determine the
common indexes, thereby showing a general way of the basic properties of the variables
in the research model. Then, the correlation analysis between the variables in the research
model was conducted to detect the relationship between the variables. Next, the author
performs the tests to choose the regression model with the most suitable estimation
method. The estimation method is used to find the relationship between capital structure
and firm's performance. After regression, the author based on the results of the testing of
research hypotheses and the results will be related and applied in practice.
3.3.1. Research model
The author follows Tian and Zeitun (2007) using the following variables: X1, X2, T,
X4, X5 and X6 which demonstrated factors of capital structure to explain how these
factors make influences on the performance of businesses. The variable X6 which is
financial year is added following Tian and Zeitun (2007) to control for
24
24
24
Applied the research model by Tian and Zeitun (2007) in the study "Considering the
effect of capital structure on firm operations in Jordan." They also used a data sample
table showing 167 Jordani companies in 1989-2003. The proposed research model as
below:
Y = β1 + β2 X1 + β3X2 + β4X3 + β5X4+ β6X5 + β7X6
For: Y is a dependent variable and Xi is an independent variable
- X1: The size of the business
- X2: Leverage
- X3: Tangible fixed asset
- X4: Liquidity
- X5: Tax
- X6: Financial year
- Y: Business performance
3.3.2. Regression method
In this study, research data in the form of tabular data should have many regression
methods for the research model. Each regression method has advantages and
disadvantages. The OLS regression method for table data, the fixed-effect regression
method, the random-effect regression method. In addition, it also uses different testing
estimation methods to estimate the residual autocorrelation phenomenon, the variance
change phenomenon in the model.
3.3.3. Description of variables
3.3.3.1. Dependent variables
This study considers the ROA variable to be a dependent variable and is used to
measure firm performance. Although in theory, they are not the only variables to measure
firm performance, ROAs are chosen because they are important on an accounting basis
and are widely accepted as a tool for measuring performance. performance of the
business. ROA can be seen as a tool to measure management efficiency, using all assets of
the enterprise from financial sources.
Some authors include Bettis and Hall (1982), Demsetz and Lehn (1985), Habib and
Victor (1991), Gorton and Rosen (1995), Mehran (1995), Ang et al. (2000), Margaritis
and Psillaki (2006), Rao et al. (2007), Zeitun and Tian (2007) used ROA and ROE to
represent performance in their studies.
25
25
25