Nghiên cứu điều chế vật liệu (c, n, s) tio 2 từ quặng ilmenite bình định ứng dụng xử lý nước thải nuôi tôm tt tiếng anh
Bạn đang xem bản rút gọn của tài liệu. Xem và tải ngay bản đầy đủ của tài liệu tại đây (1.19 MB, 26 trang )
MINISTRY OF EDUCATION AND TRAINING
QUY NHON UNIVERSITY
NGUYEN THI LAN
PREPARATION OF (C, N, S)-TIO2 MATERIALS
FROM BINH DINH ILMENITE ORE FOR THE
TREATMENT OF WASTEWATER FROM SHRIMP
FARMS
Speciality
: Physical and Theoretical Chemistry
Code
: 9 44 01 19
PhD THESIS OF CHEMISTRY
Binh Đinh, 2020
The study is carried out at:
University of Education, Quy Nhon
University
Supervisors:
Asc. Prof. NGUYEN PHI HUNG
Dr. LE THI THANH THUY
Reviewer 1: Prof. TRAN THAI HOA
Reviewer 2: Prof. DUONG TUAN QUANG
Reviewer 3: Asc. Prof. LE TU HAI
The thesis was assessed by University Examination Board at Quy
Nhon University, An Duong Vuong Str. 170, Quy Nhon city,
Binh Dinh Province.
At ….., ………, 2020.
The thesis can be found at:
-
Library of Quy Nhon University
-
Vietnam National Library (31 Trang Thi Str., Hoan kiem, Ha
noi)
1
I. INTRODUCTION OF THESIS
1.The imperativeness of thesis
Brackish shrimp farming appeared in our country very early
and increasingly plays an important role in aquaculture. Up to now,
shrimp farming has developed strongly with increasing
intensification level, along with that, export value has grown
strongly, accounting for more than 40% of total seafood industry
turnover. However, at present, agriculture in general and fishery in
particular have to deal with the situation of people arbitrarily using
antibiotics in animal husbandry and aquaculture, not following the
instructions of the authorities, leading to high antibiotic residues in
livestock products as well as the environment, adversely affecting
consumer health, causing great difficulties in managing and affecting
export activities. In particular, the current wastewater from shrimp
ponds is almost untreated before being discharged into the
environment and has been causing increasingly serious
environmental pollution. Therefore, the problem of wastewater
treatment before shrimp discharged into the environment should be
properly studied.
TiO2 with superior properties such as photocatalytic activity is
high, durable, non-toxic, ... is being studied and applied widely.
However, with a band gap of about 3.2 eV, TiO2 material can only
give a catalytic effect in ultraviolet (UV) light. The portion of
ultraviolet radiation in the solar spectrum to the earth's surface is only
about 5%, so the use of this source of radiation for environmental
treatment with TiO2 photocatalyst is limited. In order to expand the use
of solar radiation energy both in the visible light area into the
photocatalytic reaction, it is necessary to reduce the forbidden energy
of TiO2 or shift the absorption of TiO2 light from the ultraviolet
region. to the visible region.
In Vietnam TiO2 used as a photocatalyst is often prepared from
the original precursors such as alkoxide, sulfate salt, chloride salt of
titanium so it has a high price. Meanwhile, the source of titaniumcontaining materials in Vietnam in general is plentiful and Binh Dinh
2
is one of four provinces assessed to have titanium ore with great
potential of the whole country, with reserves of about 2.5 million tons,
but ineffective exploitation and use
From the above problems, we was carried the thesis with the title of
“Preparation of (C, N, S)-TiO2 materials from Binh Dinh Ilmenite
ore for the treatment of wastewater from shrimp farms”
2. The task of the thesis
- Preparation of TiO2-based materials from Binh Dinh Ilmenite ore
by sulfate method and surface modify by non-metals C, N, S;
- Treatment of a number of pollutants in shrimp waste water using
modified TiO2 material prepared from Ilmenite Binh Dinh ore in
combination with biological treatment method.
3. Scope and object of the thesis
In the thesis, scope and object of the study are selected:
- TiO2 nanomaterial modified by non-metal prepared from Ilmenite
ore in Binh Dinh; Shrimp wastewater is taken from Tuy Phuoc
district, Binh Dinh province.
- Research and preparation of TiO2 material from Ilmenite Binh Dinh
ore by sulfate method; synthesizing TiO2 modified C, N, S materials
by hydrothermal method; Investigate photocatalytic activity of
materials by tetracycline antibiotic decomposition reaction in
aqueous solution; Investigate the possibility of treating wastewater
from shrimp farming in reality by photocatalytic method based on
modified TiO2 material combined with biological treatment method.
4. Scientific and practical meaning of the thesis
Scientific significance: Preparing C-N-S tridoped TiO2
materials from Ilmenite ore, developing a photocatalyst reaction to
decompose tetracycline antibiotics and determining the best
conditions of modified TiO2 materials .
Practical significance: Contributing to deep processing of
Ilmenite minerals, increasing the value of exploiting natural
resources. The preparation TiO2 material is applied to shrimp
3
wastewater treatment by photocatalytic method combined with
biological method.
The results of the thesis show that the research is likely to be
extended to apply in the treatment of polluted water and water color
solution in water; catalyze the oxidation reaction of some organic
compounds.
5. Originality of the thesis
- For the first time, studying doping elements C, N, S into TiO2 nano
materials prepared from Ilmenite source in Binh Dinh, exploiting the
function of C-N-S tridoped TiO2 materials in improving
photocatalytic activity of TiO2 nanomaterials.
- Develop photocatalytic reaction mechanism, identify intermediate
products of C-N-S tridoped TiO2 materials in tetracycline antibiotic
decomposition by HPLC-MS method.
- Application of C-N-S tridoped TiO2 materials into the wastewater
treatment of shrimp culture by photocatalytic methods combined with
biological methods.
6. The lay-out of the thesis
The thesis possesses 135 pages, includes: Introduction (3 pages);
Chapter 1: Theory overview (36 pages); Chapter 2: Content and
methods (23 pages); Chapter 3: Results and discussion (44 pages);
Conclusion and request (2 pages); List of publishing manuscripts (1
page); Reference (26 pages).
II. CONTENT OF THE THESIS
Chapter 1. Theory overview
Searching and collect scientific information related to TiO2 nano
materials on synthetic methods and applications. From that choose
the suitable methods and application for the thesis. Finding
originality that did not mention in reference to carry out the thesis.
The overview shows that modified TiO2 nanomaterials have been
studied a lot. Special TiO2 denatured by metals, non-metals or
composite composites. In which, the applications C-N-S tridoped
4
TiO2 materials prepared Ilmenite ore and thiourea iron in the field
adsorption, photocatalytic and catalyzing oxidation reactions of
organic compounds is limited. Therefore, the thesis also aims to
study the applications of this material in the fields of adsorption and
catalysis.
CHAPTER 2. OBJECTIVES AND METHODS
2.1. Objectives
- Preparation of TiO2 material from Ilmenite Binh Dinh ore by
sulfate method;
- Study preparing C-N-S tridoped TiO2 materials and Investigation of
influencing factors through the breakdown of tetracycline antibiotics.
- Application of modified TiO2 material to handle a number of pH,
COD, BOD5, NH4+, TSS and antibiotics in shrimp wastewater from
biological methods combined with photocatalytic methods.
2.2. Methods
The thesis has used structural characteristics methods includes:
includes: X-ray diffraction (XRD) studying crystal phase
composition,
Fourier-transform infrared spectroscopy
(FT-IR)
realizing oxygen containing groups on the surface of material, X-ray
photoelectron spectroscopy (XPS) is spectroscopic technique that
measures chemical state and electronic state of the elements that
exist within a material, energy-dispersive X-ray spectroscopy (EDS)
analyzing atomic compostion, nitrogen adsorption/desorption
isotherms analyses determining surface area, canning electron
microscope (SEM) and transmission electron microscope (TEM)
observing morphology and size of particle, Visible diffuse ultraviolet
reflectance (UV-Vis - DRS) method to determine the band gap
energy of a material; Photoluminescence method (PL) determines the
recombination ability of electrons and photoluminescent holes.
5
Using analytical methods including: Liquid chromatography
combined with mass spectrometry (HPLC-MS) to identify
intermediate compounds after antibiotic decomposition.
2.3. Experimental
- Prepare TiO2 material;
- Synthetic C-N-S tridoped material;
- C-N-S tridoped material for used for photocatalytic for tetracycline
antibiotic degradation.
- Wastewater treatment of shrimp farming by biological method
combined with photocatalytic method.
CHAPTER 3. RESULTS AND DISCUSSION
3.1. Preparation of TiO2 material from Ilmenite Binh Dinh
3.1.1. Characterization of TiO2
160
250
FeTiO3
A(101)
(a)
140
TiO2 (b)
200
120
A(215)
50
20
A(204)
A(004)
40
A(200)
100
60
A(105)
A(211)
80
A(116)
A(220)
150
Intensity(a.u)
Intensity (a.u)
100
0
0
20
30
40
50
2(degree)
60
70
80
20
30
40
50
60
70
80
2 (degree)
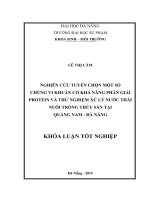
Fig 3.1. XRD patterns of:(a) Ilmenite ore;(b)TiO2 material
The obtained materials were studied by XRD measurements
(Fig 3.1). It was found that that the main component of Ilmenite (a)
ore is FeTiO3 (PDF NO. 29-0733) and the crystal structure of TiO2
(b) in anatase phase with diffraction peaks featured at the corner 2θ =
25,25; 37,88; 48,45; 53,9; 55,0 và 62,6o (standard card JCPDS 211272). The crystallite sizes of the samples could be estimated from
the broadening of the X-ray diffraction peak according to Scherrer
formula. It was calculated that TiO2 has an average crystallite size of
14.39 nm.
The IR spectra shown in Figure 3.2 show characteristic
diffraction peaks at the wave numbers 3428.9; 1632.5; 467 cm-1. In
6
particular, the diffraction peaks at 3428.9 and 1632.5 cm-1 were
referred to the variation and deformation oscillations of the O-H
bonds in the adsorbed water molecules on the surface. The maximum
peak between 400 - 500 cm-1 is thought to be the valence oscillation
of Ti-O bond of TiO2.
100
TiO2
90
Transmittance (%)
80
1632,5
70
60
50
40
3428,9
30
4000
3500
467
3000 2500 2000 1500
Wavenumber (cm-1)
1000
500
Fig 3.3. SEM images of
TiO2
Fig 3.2. FT-IR spectra TiO2
SEM image (Fig 3.3) results show that the collected TiO2
particles are spherical, the particles are relatively uniform.
0.4
2500
150
100
TiO2
2000
0.2
0.1
1500
1000
500
0.0
50
O
0.3
Intensity (a.u.)
Pore volume (cm3/g)
Quantity adsorbed/STP (cm3/g )
200
0
50
100
150
200
Ti
Pore diameter(nm)
Ti
Ti
0
0
0.0
0.2
0.4
0.6
0.8
1.0
Relative pressure(P/Po)
Fig 3.4. Nitrogen adsorption/desorption
isotherms of TiO2
0
2
4
6
8
10
12
Energy (keV)
Fig 3.5. EDX spectra of TiO2
The results in Figure 3.4 show that the adsorption and
desorption isotherm curves of the sample sample TiO2 of type IV
with hysteresis type H1 are all typical for the average capillary
structure. On the isothermal adsorption-desorption line N2 of TiO2
7
sloping sharply at the relative pressure area P/Po = 0.9 - 1.0,
characteristic for large capillaries and small delay due to capillary
condensation governing. This suggests that TiO2 particles may have
bonded together to create large capillaries, with an average capillary
diameter according to BJH of 36.69 nm. The capillary size
distribution line extends over 50 nm for a large but uneven capillary.
The EDX spectrometer in Figure 3.5 indicates that the TiO2
material prepared consists of the main elements titanium, oxygen,
respectively% by mass of 22.61 and 76.74%. The purity reaches
99.35%, the impurity constitutes 0.65%, this shows that the obtained
TiO2 material has a high purity, the basic ingredient is TiO2.
The optical properties and forbidden energy values of TiO2
were determined by UV-Vis-DRS method, the results are shown in
Figure 3.6. By extrapolating the curve in Figure 3.6, the band gap of
TiO2 anatase phase is 3.2 eV. Absorption of light from the
wavelength of 187 nm and ends at the wavelength of 387 nm in the
ultraviolet region.
3.1.2. Photocatalytic activity of Ilmenite mineral and TiO2
material
Figure 3.7 presents the kinetics of TC degradation over TiO2
and raw ilmenite. As can be seen in the figure, ilmenite does not
exhibit any photocatalytic activity toward to oxidize TC due to the
chemical inert property of ilmenite mineral. For TiO2, the dark
adsorption/desorption equilibrium is reached after 30 min and it
displays adsorption capacity TiO2 about 14,69% and TiO2 yields a
degradation efficiency about 50% after 120 min of visible light
illumination.
8
Photocatalytic degradation
1.4
Ilmenite
1.0
[hv]^1/2
1.2
1.0
0.8
3,2 eV
0.6
2.0
2.5
3.0
3.5
4.0
4.5
Dark adsorption
C/Co
Abs.
0.8
0.6
Photon energy (eV)
0.4
0.4
0.2
0.2
387 nm
0.0
200
300
400
500
600
TiO2
0.0
700
0
15
30
45
60
Wavelengh (nm)
75
90
105
120
135
150
Time (min)
Fig 3.6. UV-Vis – DRS spectra
of TiO2
Fig 3.7. Kinetics of TC
decomposition reaction
3.2. MODIFIED TiO2 MATERIAL
3.2.1. Effect of molar ratio between thiourea/TiO2 in C, N, S codoped TiO2 material with photocatalytic activity
A(215)
A(116)
A(220)
A(204)
A(105)
A(211)
C-êng ®é (a.u)
A(004)
A(200)
A(101)
3.2.1.1. Characteristic of C, N, S co-doped TiO2 material
4TH-TiO2
3TH-TiO2
2TH-TiO2
TH-TiO2
TiO2
20
30
40
50
(®é)
60
70
80
Fig 3.8. XRD patterns of TiO2 amd xTH-TiO2 (x = 1, 2, 3, 4)
From the XRD diagram in Figure 3.8, it is shown that the
diffraction peaks of the xTH-TiO2 doped samples are similar to those
of TiO2 material, but the intensity varies. The results show that TiO2
and xTH-TiO2 materials contain spectral peaks of 2θ = 25.3o; 37.8o;
48.1o; 53,9o; 55,0o; 62,6o; 68.8o; 70.3o; 75.1o corresponds to the
lattice facets (101), (004), (200), (105), (211), (204), (116), (220),
9
(215) of the anatase phase. From the above results, it can be
concluded that thiourea doping does not affect the formation of TiO2
phase structure.
IR spectra of thiourea, TiO2 and xTH-TiO2 samples in the
range of 400 - 4000 cm-1 are shown in Figure 3.9. Absorbent peaks
of about 3400 cm-1 and peaks at 1638 cm-1 are signals, respectively,
characterizing valence and deformation fluctuations of the OH
bonding of adsorbed water molecules on the surface and of hydroxyl
groups. on the material surface.
The peak at 2330 cm-1 wave number characterizes the covalent
oscillation of the C = O bond of the CO2 molecule adsorbed on the
surface of the material. Absorption range in the range 1516-1567 cm1
corresponds to the nitrate ligand. According to A. Brindha et al.,
The wave number at 1441cm-1 characterizes the Ti-O-N bonding
group. In the region below 1000 cm-1, a number of peaks are
assigned to the absorbance bands of the strain oscillation of the Ti-OTi, Ti-O and O-Ti-O bonds.
Thiourea
TiO2
Transmittance (%)
1TH-TiO2
2TH-TiO2
3TH-TiO2
4TH-TiO2
2330
1638
1547
4000
3600
3200
2800
2400
2000
1441
1516 1233
1600
675
1050
1140
1200
824
800
400
Wavenumber (cm-1)
Fig 3.9. FT-IR spectra of thourea, TiO2 and xTH-TiO2 (x = 1, 2, 3, 4,)
According to Cheng et al., The peaks at wave numbers 1233,
1140 and 1050 cm-1 can be attributed to the characteristic oscillation
from the bilge ligand of the S-O groups to the Ti4+ ions. Obviously,
compared with pure TiO2, the simultaneous doping of three elements
C, N, S into TiO2 increased the adsorption of water molecules and
10
hydroxyl groups on the surface to create electron traps to improve
efficiency. Electrolysis results and photoelectric holes enhance the
photocatalytic decomposition of TC solution.
The band gap energy of xTH-TiO2 samples determined by
Kubelka – Munk (Fig 3.11) is lower than that of TiO2 material, in
which 2TH-TiO2 material have the lowest band energy of 2.88 eV.
2.50E-009
2.00E-009
1TH-TiO2
2TH-TiO2
2.00E-009
(F(R)hv)^1/2
(F(R)hv)^1/2
1.50E-009
1.50E-009
1.00E-009
1.00E-009
5.00E-010
5.00E-010
2,91 eV
2,88 eV
0.00E+000
0.00E+000
2.0
2.5
3.0
3.5
4.0
2.0
4.5
2.5
3.0
3.5
4.0
4.5
Photon energy (eV)
Photon energy (eV)
2.50E-009
2.00E-009
4TH-TiO2
3TH-TiO2
2.00E-009
(F(R)hv)^1/2
(F(R)hv)^1/2
1.50E-009
1.00E-009
1.50E-009
1.00E-009
5.00E-010
5.00E-010
2,98 eV
2,94 eV
0.00E+000
2.0
2.5
3.0
3.5
Photon energy (eV)
4.0
4.5
0.00E+000
2.0
2.5
3.0
3.5
4.0
4.5
Photon energy (eV)
Fig 3.11. Graph of dependence of Kubelka-Munk function on photon
energy to estimate Eg of material samples xTH-TiO2
3.2.1.2. Photocatalytic activity of materials
The ability to decompose TC of materials xTH-TiO2 is shown
in Fig 3.12 and Fig 3.13. The results showed that when the molar
ratio increased, the catalytic activity increased but not uniformly.
The 2TH-TiO2 ratio is considered to be an appropriate doping ratio
to produce materials with high photocatalytic activity.
11
1.0
Photocatalytic degradation
TiO2
1TH-TiO2
87,83
Dark adsorption
C/Co
0.4
0.2
H (%)
4TH-TiO2
82,32
76,32
80
3TH-TiO2
0.6
96,00
100
2TH-TiO2
0.8
60
52,76
40
20
0
0.0
0
15
30
45
60
75
90
105
120
135
150
TiO2
1TH-TiO2 2TH-TiO2 3TH-TiO
2
4TH-TiO2
Time (min)
Fig 3.12. The change in C/Co as
a function of time for TiO2 và
xTH-TiO2
Fig 3.13. Effect of function
amount of doping to
decomposition efficiency TC
3.2.2. The effect of hydrothermal temperature of modified TiO 2
material on photocatalytic activity
3.2.2.1. Characteristic of C, N, S co-doped TiO2 material at
hydrothermal temperatures
Fig 3.14 show that, the 2TH-TiO2-T material samples at
different hydrothermal temperatures all have characteristic
diffraction peaks of 2θ = 25.3o; 37.8o; 48.1o; 53,9o; 55,0o; 62,6o;
68.8o; 70.3o; 75.1o corresponds to the lattice surfaces (101), (004),
(200), (105), (211), (204), (116), (220), (215) of the anatase phase.
As the hydrothermal temperature increases, the intensity of the
diffraction peaks increases, the width of the diffraction pins becomes
narrower, the crystal size increases, the material has a high degree of
crystallinity.
A(215)
A(204)
A(116)
A(220)
A(200)
A(105)
A(211)
A(004)
Intensity (a.u)
A(101)
12
2TH-TiO2-200
2TH-TiO2-180
2TH-TiO2-160
20
30
40
50
60
70
80
2(degree)
Fig 3.14. XRD patterns of 2TH-TiO2-T (T=160 oC,180 oC và 200 oC)
3.2.2.2. Photocatalytic activity of 2TH-TiO2-T material samples by
hydrothermal temperature
1.0
Photocatalytic degradation
TiO2
96,00
100
2TH-TiO2-160
2TH-TiO2-180
2TH-TiO2-200
0.8
87,83
80
71,30
H (%)
Dark adsorption
C/Co
0.6
0.4
0.2
60
52,75
40
20
0.0
0
15
30
45
60
75
90
Time (min)
105
120
135
150
0
TiO2
2TH-TiO2-160 2TH-TiO2-180 2TH-TiO2-200
Fig 3.15. (a) Kinetics of TC decomposition reaction; (b) The effect
of hydrothermal temperature on TC decomposition efficiency
Hydrothermal temperature has a great influence on the
photocatalytic activity of materials. Initially, when the hydrothermal
temperature was increased, the photocatalytic activity of the material
increased, increasing from 71.30% to 96.00%. However, if the
temperature continues to rise, the catalytic activity of the material
decreases, the catalytic activity of the 2TH-TiO2 material reaches
only 87.83%. Photocatalytic activity of the doped samples is higher
than that of TiO2.
13
3.2.3. Influence temperature of modified TiO2 material on
photocatalytic activity
3.2.3.1. Characteristic of C, N, S co-doped TiO2 materials at
different firing temperatures
(204)
(211)
(105)
(200)
(004)
(101)
It is found that all TH-TiO2-a samples crystallized in the anatase
phase, no rutile or brookite phases are observed. As the annealing
temperature increases from 400 to 700 oC, the (101) peak intensity
increases and the spectral line half width at the (101) plane became
narrower, resulting in a larger crystallite size. This proves that TiO2
anatase gradually crystallizes as the annealing temperature increases.
The average crystallite size of the 2TH-TiO2-400, 2TH-TiO2-500,
2TH-TiO2-600, 2TH-TiO2-700 samples are 9.07; 9.54; 9.79; 13.4 nm.
TH-TiO2-700
Intensity/ a.u.
TH-TiO2-600
TH-TiO2-500
TH-TiO2-400
TiO2-500
20
30
40
50
60
70
80
2 theta/ degree
Fig 3.16. XRD patterns for TH-TiO2-a annealed at different temperatures
The specific surface area and porosity of the obtained samples
were determined by the BET method and their results are presented
in Fig 3.17.
The specific surface area determined according to the BET
method for the TH-TiO2-a samples annealed at 400 - 700 oC is 73.47,
92.25, 65.20 and 47.35 m2/g, respectively.
200
150
1,2
dV/dlog(D) Pore Volume/cm3/g
Quantity Adsorbed / STP cm3. g-1
14
TH-TiO2 - 400
TH-TiO2 - 500
1,0
TH-TiO2 - 600
TH-TiO2 - 700
0,8
0,6
0,4
0,2
100
0,0
0
25
50
75
100
Pore Diameter/nm
50
0
0,0
0,1
0,2
0,3
0,4
0,5
0,6
0,7
0,8
0,9
1,0
Relative pressure / P/Po
Fig 3.17. N2 adsorption-desorption isotherms at 77 K and pore diameter
distribution curves of the TH-TiO2-a samples according to BJH
The surface morphology of the TH-TiO2-a samples are
characterized by TEM and SEM methods and the results are shown
in Fig 3.18 and Fig 3.19 .
Fig 3.18. (a,b) HR-TEM images with consistent Fast Fourier
Transform (FFT) in insets, and (c) Selected Area Electron
Diffraction (SAED) of TH-TiO2-500.
The construction of secondary particles from sub-one could
be clarified in HR-TEM images (as shown in Fig. 3.18a) which
indicates that the size range of the primary particles is around 12 to
18 nm. The high magnification TEM image in Fig 3.18b displays the
observable lattice fringe corresponding to (101) plane with distance
of 0.352 nm which is confirmed by Fast Fourier Transforms (FFT)
(insets). The acceptable crystallinity of obtained sample was further
proved via Selected Area Electron Diffraction (SAED) (Fig. 3.18c)
15
which includes separated rings formed form clear spot. The
corresponding lattice planes were also indexed in SAED pattern.
Fig 3.19. SEM images of TH-TiO2-400 (a), TH-TiO2-500 (b), TH-TiO2600 (c), TH-TiO2-700 (d)
As can bee seen in Fig 3.19, the obtained samples have a
structured morphology, the particles are spherical, quite uniform.
The band gap energy of all samples was calculated based on the
Kubelka-Munk equation and shown in Fig 3.21.
2.5
3.0
3.5
4.0
4.5
2.0
2.88 eV
2.5
[F(R)hv]^1/2
[F(R)hv]^1/2
3.05 eV
3.0
3.5
4.0
4.5
2.0
3.02 eV
2.5
3.0
3.5
4.0
4.5
Photon Energy / eV
TiO2-500
TH-TiO2-700
2.5
3.0
Photon Energy / eV
Photon Energy / eV
2.0
[F(R)hv]^1/2
[F(R)hv]^1/2
[F(R)hv]^1/2
2.86 eV
2.0
TH-TiO2-600
TH-TiO2-500
TH-TiO2-400
3.5
4.0
Photon Energy / eV
4.5
2.0
3.2 eV
2.5
3.0
3.5
4.0
4.5
Photon Energy (eV)
Fig 3.21. Kubelka-Munk function versus photon energy for band gap
estimation
The oxidation states of C, N and S in TH-TiO2 were studied by
XPS spectra (Fig 3.22). The survey XPS spectrum (Figure 3.22)
presents Ti2p peaked at 459.36 eV; C1s at 284.70 eV; O1s at 531.00
16
eV; N1s at 400.30 eV; and S2p at 168.01 eV. This shows that there
has been doping of elements C, N, S into TiO2 lattice.
The photoluminescence (PL) is widely used to study the
recombination of photo-induced electron/hole pairs. The PL spectra
of TiO2 and TH-TiO2 materials are shown in Fig 3.23. The materials
were excited at 404 nm with a strong emission peak at about 468 nm.
It was found that there is a significant decrease in luminescence
intensity of TH- TiO2 compared to TiO2.
100000
35
O1s
TiO2
2TH-TiO2-500
30
C-êng ®é (a.u)
60000
40000
N1s
20
S 2p
N 1s
20000
25
15
C 1s
C-êng ®é (a.u)
Ti2p
80000
10
0
1200
1000
800
600
400
200
420
440
460
N¨ng l-îng liªn kÕt (eV)
480
500
520
540
B-íc sãng (nm)
Fig 3.23. PL spectra of TiO2
Fig 3.22. XPS spectrum of
and TH-TiO2
2TH-TiO2-500
3.2. 3.2. Photocatalytic activities
0.6
0.4
81,89
71,17
40
TiO2
20
65,51
TH-TiO2-500
52,76
TH-TiO2-600
60
TH-TiO2-700
80
TH-TiO2-400
TC photodegradation efficiency (%)
Dark adsorption
C/Co
0.8
96,00
100
TiO2
Photocatalytic
degradation
1.0
0
0.2
0.0
0
15
30
45
60
75
90
105
120
135
150
Time / min
Fig 3.24. The change in C/Co as a function of time for TiO2-500 và
TH-TiO2-a (a = 400, 500, 600 and 700 oC), tetracycline concentration
of 30 mg/L
The tetracycline photocatalytic degradation of TH-TiO2-a and
TiO2-500 samples is shown in Fig 3.24. It is worth mentioning that
17
all C, N and S co-doped TiO2 samples yield a higher
photodegradation efficience than the undoped TiO2 sample.
Particularly, the TH-TiO2-500 show the best photocatalytic activity
under the visible light irradiation (96 %).
3.2.4. Experimental factors affecting the interactive optical
activity of C, N, S co-doped TiO2 materials
3.2.4.1. Effect of initial TC concentrations
In this experiment, the initial TC concentration varied from
30 to 70 mg.L-1, the other experimental conditions remained the
same. It was found that when increasing the initial TC concentration
from 30 to 70 mg.L-1 decomposition efficiency decreases
significantly from 96% to 55% after 120 minutes of visible-light
illumination (Fig 3.25a). At the initial concentrations of 40 mg/L, 50
mg/L and 60 mg/L, TC degradation efficiency is also significantly
reduced. Thus, the appropriate initial concentration for TC
decomposition of 2TH-TiO2 samples is 30 mg/L.
Dark adsorption
0.8
C/Co
0.6
0.4
0.2
(a)
30 mg.L-1
40 mg.L-1
50 mg.L-1
60 mg.L-1
70 mg.L-1
3.5
(b)
2
y = 0.02305 x - 0.01103; R = 0.9911; 30 mg/L.
2
y = 0.01255 x - 0.04602; R = 0.9915; 40 mg/L.
2
y = 0.00874 x - 0.05363; R = 0.9911; 50 mg/L.
2
y = 0.00677 x - 0.01322; R = 0.9977; 60 mg/L.
2
y = 0.00557 x + 0.05090; R = 0.9867; 70 mg/L.
3.0
2.5
ln Co/C
Photocatalytic degradation
1.0
2.0
1.5
1.0
0.5
0.0
0.0
0
15
30
45
60
75 90 105 120 135 150
Time / min
0
15
30
45
60
75
Time / min
90
105
120
Fig 3.25. a) Kinetics of TC decomposition reaction; b) Plot of
Langmuir-Hinshelwood model at different TC initial concentrations.
(Conditions: C0 = 30 mg.L–1, V =100 mL, mCat =0.06 g)
The Langmuir-Hinshelwood model was employed to analyze
the kinetics data in which the linear plot of ln(Ct/Co) vs. t is
constructed. Fig 3.25b presents the Langmuir-Hinshelwood plots at
different concentrations. The high determination coefficients, R2
18
(0.99 – 1) confirm that the kinetic degradation reaction of TC over
TH-TiO2 fixed well the Langmuir-Hinshelwood model.
3.2.4.2. Effect of pH
The pH of point of zero charge (pHPZC) of TH-TiO2 calculated
by the pH drift method is 4.5 (Fig 3.26a). Thus, at the pH of solution
<2.5 (pH
environment, TC ions are positively charged, so there is an
electrostatic repulsion between TC cation and negative surface of the
material. to reduced TC adsorption efficiency. When pH> 8 (pH>
pKa = 7.5) amino protons are lost, the negatively charged TC ions
increase the repulsion between the anion TC and the positively
charged material surface. At the natural pH range of 4.5, the TC
solution exists in the form of bipolar ions, the surface of the material
is not charged, electrostatic repulsion does not occur making the
highest TC decomposition efficiency.
0.5
(a)
(b)
96.0
100
96
pH 0.0
81.3
1
2
3
4
5
6
7
8
9
10
80
81.3
pHi
67.8
H/ %
-0.5
77.2
58.3
60
58.3
44.0
-1.0
40
-1.5
20
44
0
-2.0
pH= 1.5 pH= 3.0 pH= 4.5 pH= 6.0 pH= 7.5 pH= 9,0
Figure 3.26. a) Effect of pH on the TC degradation
efficiency; b) The pHPZC determined by pH drift method.
3.2.4.3. Reusability
Reusability is one of the very important factors when deciding
to choose a catalyst for economic and environmental purposes.
77.2
67.8
19
100
96.0
94.3
92.8
91.2
(b)
(a)
89.0
Intensity/arb.
80
4th cycle TH-TiO2
0
Initial
1st cycle
2nd cycle 3th cycle 4th cycle
20
30
40
50
60
2 theta/ degree
204
Initial TH-TiO2
20
116
220
215
200
004
40
105
211
101
H/ %
60
70
80
Figure 3.28. a) TC degradation efficiency after four reuse cycles of
TH-TiO2; b) XRD patterns of reused TH-TiO2.
The used TH-TiO2 material was washed many times with
distilled water and dried at 80°C for 12 hours for regeneration. The
TC degradation efficiency over reused catalyst is presented in Fig
3.28a. This result shows a slight reduction in TC decomposition
efficiency, but after four reuse times, effective TC decomposition
still reached over 89.0 %. The XRD patterns of TH-TiO2 (Fig 3.28b)
seems slightly changeable indicating TH-TiO2 possessed excellent
structural stability that after the regeneration process.
3.2.5. Mechanism of photocatalytic reaction
The effect of extinguishing agents on TC degradation
performance is shown in Fig 3.29 and 3.30. In general, the presence
of free radicals reduces the efficiency of TC degradation. AO
(quenching h+), BQ (quenching •O2-), and BN (quenching e-) reduce
significantly degradation rate of TC. However, TB seems not to
affect TC degradation. This concludes that the free radicals (h+; •O2-;
e-) take mainly part in degradation reactions of TC while •OH is
negligible.
20
1.0
Photocatalytic degradation
0.8
96,0
100
No Scavenger
AO
TB
BQ
BN
91,9
80
0.4
0.2
H(%)
Dark adsorption
C/Co
60,4
0.6
60
52,2
48,5
40
96
20
60.4
0
0.0
0
15
30
45
60
No scavenger
75 90 105 120 135 150
Time / min
AO
BQ
BN
TB
48.5
Fig 3.30. Effect of quencher on
TC decomposition performance
Fig 3.29. Kinetics of TC
degradation on TH-TiO2 in the
presence of different
scavengers.
These free radicals are strong oxidizing agent which could
oxidize partially or complexly TC. The arguments are illustrated in
the Fig 3.31 and equations (1) to (6).
Fig 3.31. The mechanisms of charge carrier migration and free
radicals formation on TH-TiO2 catalyst under visible light
illumination
TC h TC(e
2 TH TiO
TC(e
_
CB
2
CB
h
VB
)
h 2 TH TiO
h VB ) 2 TH TiO
2 TH TiO
2
(e
_
CB
2
2
(e
CB
h
2 TH TiO
) O 2 O 2 2 TH TiO
_
2
VB
2
(e
)
_
CB
) TC(h
VB
)
52.2
21
2 TH TiO
2
(h
H 2 O H OH
H 2 O 2 TH TiO
) TC TC ( h
VB
VB
)
Phân hủy
_
2
(h
O 2 , h , OH TC/TC
) H
VB
OH
Degradation products
3.3. RESULTS ON SHRIMP TREATMENT OF SHRIMP
MATERIAL OF TiO2 MATERIALS VARIED BY BIOMETHODS COMBINED WITH CATHOLIC OPTICAL
METHOD
3.3.1. Assessing the quality of initial wastewater
Waste water from shrimp ponds comes from Phuoc Thuan
commune, Tuy Phuoc district. The analysis of the input water quality
shows that most of the indicators (except pH) exceed the permitted
level of waste water discharged into the environment, especially the
tetracycline antibiotic indicator exceeds the permitted level by more
than 12 times. . Therefore, it can be concluded that wastewater from
shrimp ponds is a serious source of pollution. Therefore, it is
necessary to treat wastewater sources to ensure these quality
standards before discharging into the environment.
3.3.2. Investigate the possibility of treating wastewater from
shrimp farming by biological methods
3.3.2.1. Investigation of optimal conditions for the treatment of
criteria in shrimp wastewater, with Remediate probiotics
Remediate is a probiotic consisting of a series of microorganisms
that treat water environment, selected from Bacillus strains, which
convert organic and ammonium. Experiments on aerobic
environment with different VSV concentrations 3 ppm, 4 ppm, 5
ppm, 6 ppm and 7 ppm in order to find the optimal conditions for the
activity of these bacterial strains in the treatment of waste water
environment for shrimp ponds. The optimal concentration is defined
as 7 ppm.
22
3.3.2.2. Results of wastewater treatment by shrimp biological
methods
The result of microbiological processing ability is shown in Fig
3.39. Experimental results show that the effectiveness of using
probiotics to treat wastewater, most of the targets have reached the
discharge standards, but the COD value is much higher than the
discharge standard, This shows that this waste water source contains
many persistent organic compounds.
3.3.3. Shrimp wastewater treatment results of 2TH-TiO2
materials
Experiments investigating the ability to treat shrimp farming
wastewater by photocatalytic method using 2TH-TiO2 material are
shown in Figure 3.41.
After 2 hours
Input value
Filter
Standard output
300
250
After 8 hours
160
140
100
150
80
100
H (%)
Value
Value (mg/L)
120
200
Standerd output
After 2 hours
After 8 hours
80
60
60
100
40
40
20
50
0
0
pH
COD
BOD5
TSS
NH4+
N-total
PO43-
Fig 3.39. Influence of thing
BOD5
TSS
COD
(mg/L) (mg/L) (mg/L)
NH4+
(mg/L)
3Tetracycline
N-tæng PO4
(g/L)
(mg/L) (mg/L)
Fig 3.41. Water treatment results
Shrimp farming waste of 2THtest conditions to the treatment
material TiO2 over time
results of microorganisms
The results show that when the photocatalytic time is extended
up to 8 hours, the parameters that reflect the pollution level of the
water source are reduced as expected, but the decomposition rate of
the pollutants after 8 hours is significantly reduced. with 2-hour
process, some indicators such as BOD5, TSS, NH4 +, tetracycline still
have not met the discharge standards.
23
3.3.4. The results of wastewater treatment on shrimp
farming are based on combining biological methods and
photocatalytic methods
The results show that the combination of 2 water treatment
methods is as effective as expected, all criteria meet the output
effluent standards, in which the values of criteria such as COD, NH4
+
, N-total, PO43- drops deeply to reach the allowable value for
exhaust. The results show that the practical application of wastewater
treatment by combined method before being discharged into the
environment is very feasible.
IV.CONCLUSION
1. TiO2 and 2TH-TiO2-500 (C, N, S co-doped TiO2) materials were
successfully prepared from Binh Dinh Ilmenite ore by the
hydrothermal method without and with the addition of thiourea,
respectively. The obtained materials have anatase-type structure,
spherical shape with high uniformity and crystallinity.
2. The synthesized 2TH-TiO2-500 has strong visible light absorption
and exhibit higher photocatalytic efficiency than TiO2 due to the
lower recombionation rate of photo-induced electrons and holes, and
the narrower bandgap energy. The evaluation of TC photocatalytic
degradation indicates that 2TH-TiO2-500 has a photocatalytic
efficiency of 96% after 120 minutes of illumination.
3. After investigating the kinetics of TC, the obtained results show
that the photodegradation of TC on 2TH-TiO2-500 photocatalyst
follows the first order kinetic equation of Langmuir-Hinshelwood.
4. The photocatalytic mechanism for TC photodegradation on 2THTiO2-500 photocatalyst was proposed. LC-MS and TOC analyses
indicate that the TC photodegradation on the photocatalyst formed
many different intermediates before being completely mineralized.
5. The modified TiO2 materials were successfully employed for the
treatment of wastewater from shrimp farms by the biological method
in combination with the photocatalytic method. After the treatment,