1p36 deletion is a marker for tumour dissemination in microsatellite stable stage II-III colon cancer
Bạn đang xem bản rút gọn của tài liệu. Xem và tải ngay bản đầy đủ của tài liệu tại đây (1.85 MB, 9 trang )
Mayrhofer et al. BMC Cancer 2014, 14:872
/>
RESEARCH ARTICLE
Open Access
1p36 deletion is a marker for tumour
dissemination in microsatellite stable stage II-III
colon cancer
Markus Mayrhofer1, Hanna Göransson Kultima1, Helgi Birgisson2, Magnus Sundström3, Lucy Mathot3,
Karolina Edlund3,5, Björn Viklund1, Tobias Sjöblom3, Johan Botling3, Patrick Micke3, Lars Påhlman2,
Bengt Glimelius4 and Anders Isaksson1*
Abstract
Background: The clinical behaviour of colon cancer is heterogeneous. Five-year overall survival is 50-65% with all
stages included. Recurring somatic chromosomal alterations have been identified and some have shown potential
as markers for dissemination of the tumour, which is responsible for most colon cancer deaths. We investigated
115 selected stage II-IV primary colon cancers for associations between chromosomal alterations and tumour
dissemination.
Methods: Follow-up was at least 5 years for stage II-III patients without distant recurrence. Affymetrix SNP 6.0
microarrays and allele-specific copy number analysis were used to identify chromosomal alterations. Fisher’s
exact test was used to associate alterations with tumour dissemination, detected at diagnosis (stage IV) or later
as recurrent disease (stage II-III).
Results: Loss of 1p36.11-21 was associated with tumour dissemination in microsatellite stable tumours of stage II-IV
(odds ratio = 5.5). It was enriched to a similar extent in tumours with distant recurrence within stage II and stage III
subgroups, and may therefore be used as a prognostic marker at diagnosis. Loss of 1p36.11-21 relative to average
copy number of the genome showed similar prognostic value compared to absolute loss of copies. Therefore,
the use of relative loss as a prognostic marker would benefit more patients by applying also to hyperploid cancer
genomes. The association with tumour dissemination was supported by independent data from the The Cancer
Genome Atlas.
Conclusion: Deletions on 1p36 may be used to guide adjuvant treatment decisions in microsatellite stable colon
cancer of stages II and III.
Keywords: Colon cancer, Prognostic marker, Allele-specific copy number analysis, Genome duplication, 1p36,
Metastasis, Tumour dissemination
Background
Colon cancer is a heterogeneous disease in terms of
clinical behaviour with an overall 5-year survival of
50-65%. Except for postoperative mortality all colon
cancer-related deaths are caused by dissemination of
the tumour (metastatic disease), present in 20-25% of
patients at the time of diagnosis, and appearing to a
* Correspondence:
1
Science for Life Laboratory, Department of Medical Sciences, Uppsala
University, Box 3056, Uppsala 750 03, Sweden
Full list of author information is available at the end of the article
similar extent during follow-up in individuals who
were found to be metastasis-free at diagnosis. After
surgical resection of the primary tumour, adjuvant
chemotherapy may reduce the risk of subsequent relapse
by eradicating subclinical tumour deposits. Prognostic
markers are warranted in patient subgroups where they
could influence the choice of treatment, such as selecting
adjuvant therapy in stage II-III patients. TNM staging has
relatively low predictive value, but is currently the only
validated prognostic tool. Improved molecular prognostic
markers could have a potential to reduce both over- and
© 2014 Mayrhofer et al.; licensee BioMed Central Ltd. This is an Open Access article distributed under the terms of the
Creative Commons Attribution License ( which permits unrestricted use,
distribution, and reproduction in any medium, provided the original work is properly credited. The Creative Commons Public
Domain Dedication waiver ( applies to the data made available in this
article, unless otherwise stated.
Mayrhofer et al. BMC Cancer 2014, 14:872
/>
under-treatment by identifying patients with the greatest
potential benefit from adjuvant therapy.
The mutational landscape of colon cancer has been
explored in detail [1]. Colon cancers with microsatellite
instability (MSI) have few or no somatic copy number
alterations (CNAs). Microsatellite stable (MSS) colon
cancers frequently have mutations in tumour suppressor
genes such as APC and TP53. MSS colon cancers also
frequently have chromosomal instability (CIN) which
results in numerous CNAs. Multiple molecular prognostic
markers such as MSI (excluding low-level MSI [2,3]), loss
of 18q and reduced SMAD4 expression have been
suggested [4-7]. Other CNAs that have been associated
with survival or tumour dissemination include loss of 1p,
4p, 8p, 9q, 10p 15q, 19p and 20p and gain of 8q and 20q
[1,8-10]. Unfortunately, findings vary considerably
between studies and there is no consensus set of CNAs associated with tumour dissemination, i.e. prognosis for
patients without metastasis at diagnosis.
Copy number analysis of tumour tissue is complicated
by unknown ploidy of the tumour cells, by normal cells in
the tumour tissue, and by subclonal CNAs. Bioinformatic
tools such as TAPS [11] use bi-allelic probe signals
from SNP arrays to estimate absolute allele-specific
copy numbers in tumour cells. Allele-specific copy
number analysis has been used to estimate frequency
of hyperploidy and whole-genome duplication in multiple
cancer types [12].
This study aimed to identify CNAs in colon cancer
that may be used at diagnosis to predict risk for tumour
dissemination in stage II-III patients. DNA from
resected stage II-IV colon cancer primary tumours were
analysed on Affymetrix SNP 6.0 arrays. Bioinformatic
analysis identified deletion on 1p36 as a marker for tumour
dissemination.
Methods
Study population
The study cohort included 116 patients operated for
colorectal cancer between 1985 and 2006 at the Uppsala
University hospital and at Västerås district general
hospital between 2000-2003, with fresh frozen tissue
samples available. We aimed at selecting between 20-25
cases each with stages II and III with and without distant
recurrence and stage IV. Morphological and clinical
parameters were retrieved from the original pathology
reports. Patients with a history of preoperative therapy
or with a surgical or pathology report suggesting a
non-radical resection margin (R1 or R2 resection)
were excluded. To secure the quality of disease staging,
patients with stage II disease were only included if at
least 10 lymph nodes were analysed. Patients with disease
stage II-III and no recurrence were only included if the
follow-up time was longer than 5 years. Tumour cell
Page 2 of 9
content was required to be at least 40% in the frozen
tissue block. The study design was chosen to have
few factors confounding an association between the
tumour genome at diagnosis (surgery) and development
of distant metastasis. Clinical and histological characteristics are presented in Table 1. Adjuvant chemotherapy,
chiefly with a fluoropyrimidine alone was given to 22 out
of 53 stage II-III patients without recurrence and to 29
out of 40 patients in stages II-III who developed distant
metastasis.
DNA extraction
Genomic DNA was extracted from 10 μm sections of
the fresh frozen tissue using QIAamp DNA mini kit
(QIAGEN GmbH, Hilden, Germany) according to the
Table 1 Clinical and histopathological data
Total
Stage II-III
Stage II-IV
No recurrence
Disseminated
p
Gender
Male
48
24
24
Female
68
29
39
Right colon
70
33
37
Left colon
46
20
26
0.434
Location
0.698
Differentiation
Well- Moderately
89
41
48
Poor
27
12
15
II
40
25
15
III
53
28
25
IV
23
-
23
<5 cm
37
12
25
≥5 cm
78
40
38
Unknown
1
1
Yes
19
11
8
No
97
42
55
0.882
Stage
Tumour size
0.058
Mucinous
0.243
Perineural invasion
Yes
3
0
3
No
113
53
60
Yes
16
6
10
No
100
47
53
0.157*
Vascular invasion
0.479
Microsatellite instability
MSI-High
24
17
7
MSS or MSI-Low
92
35
57
*Fisher’s exact test, otherwise χ2.
0.008
Mayrhofer et al. BMC Cancer 2014, 14:872
/>
manufacturer’s recommendations for DNA purification
from tissue. Alternatively, genomic DNA was extracted
from approximately 25 mg of each fresh frozen colon
tissue sample on a Tecan Evo MCA 150 robotic platform
using the extraction method described in Mathot et al
[13]. DNA concentration was determined using NanoDrop
(Thermo Scientific, Wilmington, DE).
MSI analysis
MSI status was determined using MSI Analysis System,
version 1.2 (Promega, Madison, WI) with 6 ng genomic
DNA and analysis of five mononucleotide repeat markers
(BAT25, BAT26, NR-21, NR-24 and MONO-27). Analyses
were performed on a 3130xl genetic analyser (Applied
Biosystems, Foster city, CA). According to guidelines from
a National Cancer Institute workshop in 1997, samples
were denoted MSI-High (MSI-H) if two or more of the
five markers show instability, MSI-Low (MSI-L) if only
one marker shows instability and microsatellite stable
(MSS) if no markers display instability. Recent studies
indicate no significant difference between MSI-L and
MSS [14] and they were therefore grouped together
as MSS in this study.
Microarray analysis
Array experiments were performed according to standard
protocols for Affymetrix GeneChip® Mapping SNP 6.0
arrays (Affymetrix Cytogenetics Copy Number Assay User
Guide (P/N 702607 Rev2.), Affymetrix Inc., Santa Clara,
CA). 500 ng total genomic DNA was digested with a
restriction enzyme (Nsp, Sty), ligated to an appropriate
adapter for the enzyme, and subjected to PCR amplification using a single primer. After digestion with DNase I,
PCR products were labelled with a biotinylated nucleotide
analogue using terminal deoxynucleotidyl transferase and
hybridized to the microarray. Hybridized probes were
captured by streptavidin-phycoerythrin conjugates using
Fluidics Station 450 and arrays were scanned using
GeneChip® Scanner 3000 7G. SNP array data generated in this study have been deposited at GEO with
accession number GSE62875. Independent SNP 6.0
data from TCGA colon adenocarcinoma were retrieved
from .
Data analysis and statistics
Basic normalisation and segmentation of the microarray
data were performed using BioDiscovery Nexus Copy
Number 6.0 and the SNP Rank Segmentation algorithm
based on Circular Binary Segmentation [15] and default
settings. Analyses of absolute allele-specific copy numbers,
average ploidy and normal cell content were performed
using TAPS [11]. Copy number estimates are included in
the Additional file 1.
Page 3 of 9
CNA frequencies (gain to >2 copies per cell, loss to <2
copies per cell, relative gain to >1.25* individual sample
average copy number, relative loss to <0.67* individual
sample average copy number, homozygous loss, high
gain to >3 copies above individual sample average copy
number, focal gain and loss of <1 Mb segments, and loss
of heterozygosity) and group comparisons were generated
using TAPS. Fisher’s exact test was used to estimate
statistical significance of observations, generating unadjusted p-values and odds ratios for short segments
throughout the genome such that none contained a
breakpoint in any sample. A p-value of 0.05 was used
as an initial cut-off for significance.
Average copy number or ploidy was calculated as the
mean total copy number throughout the autosomes. The
difference between the number of autosome arms with 2m0
(two copies with minor allele copy 0, i.e. LOH) or 4m2, and
2m1 or 4m1 was used as a score for evidence of a genome
duplication event (using medians of total and minor allele
copies throughout each autosome arm, Formula 1).
X
X
X
X
WGDscore ¼
2m0 þ
4m2− 2m1− 4m1
ð1Þ
Results
Copy number analysis was successful for 115 samples, of
which 23 were MSI and 92 MSS. Tumour dissemination
was defined as either stage IV with distant metastasis at
diagnosis, or stage II-III and recurrence with distant metastasis within 5-years of diagnosis. No association was found
between tumour dissemination and gender, tumour location, differentiation, tumour size, mucinous appearance, or
neural or vascular invasion (Table 1).
DNA from all samples was analysed using Affymetrix
SNP 6.0 arrays and absolute allele-specific copy numbers in
the cancer cells were estimated using TAPS [11]. All samples with MSI (n = 23) were near diploid with relatively few
CNAs; median 3 chromosomes affected and median 87 Mb
altered. Nearly all samples with MSS had an abundance of
CNAs affecting large proportions of the genome; median
17 chromosomes affected and median 940 Mb altered.
Hyperploidy, defined as an average copy number
above 2.5, was observed in many MSS samples but
showed no association with tumour dissemination (p = 0.33).
Associations between specific CNAs and tumour dissemination were investigated separately in MSI and
MSS due to the different frequencies of alterations. Sample
groups with and without dissemination were compared for
differences in the frequency of various types of CNAs (see
Methods). Fisher’s exact test was used to generate p-values
for the null hypothesis that the observed difference in CNA
frequency is random. Alteration frequencies and frequency
differences in MSS samples are shown in Figure 1.
Mayrhofer et al. BMC Cancer 2014, 14:872
/>
Page 4 of 9
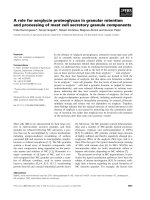
Figure 1 Frequency of copy number alterations. Microsatellite stable tumours with dissemination (stage II-III with distant recurrence, stage IV)
and without (stage II-III no recurrence). Frequency difference is shown with a darker colour. Different types of CNAs were analysed separately: A)
Gain (to >2 copies). B) Relative gain (to >25% above individual sample average copy number). C) Loss (to <2 copies). D) Relative loss (to <67% of
individual sample average). E) Loss-of-heterozygosity (no minor allele copy). Regions with significant difference in alteration frequency (p < 0.05,
Fisher’s exact test) are marked by black bars below each panel.
In MSS samples, frequencies of CNAs were similar in
samples with and without dissemination, with amplification being more frequent than deletion throughout most
chromosomes (Figure 1A, C). Deletion was more frequent than amplification only on chromosomes 8p, 17p
and 18. Frequencies of absolute loss (1C) resembled
Mayrhofer et al. BMC Cancer 2014, 14:872
/>
those of loss relative to the average copy number of the
individual genome (1D) and LOH (1E) due to their
natural overlap; e.g. absolute loss is also considered
LOH. Regions with a significantly different frequency of
alteration (p < 0.05, Fisher’s Exact Test) between the
prognostic groups included 1p36 and 18q (relative loss),
2q12-14, 5p, 6pq and 17q (relative gain) and 16p (LOH).
Additional file 1 includes a complete list of CNA
frequency differences (including focal alterations and
homozygous loss for which no potential markers were
found) and corresponding p-values and odds ratios. In
tumours with MSI, some genomic regions including 18q
were more commonly altered in disseminated tumours,
but the number of MSI samples was limited and statistical significance was not reached for any specific CNA
(Additional file 1: Figure S1).
1p36 deletion is a marker for tumour dissemination in
stages II and III
We used a publicly available set of colon adenocarcinoma
samples from The Cancer Genome Atlas (TCGA) [1] to
verify which of our findings could be observed in independent data. The TCGA data set differed from the
current study in that progression after diagnosis and MSI
status was documented only for subsets of the patients.
We observed that large CNAs (≥10 Mb) were rare in MSI
samples in the current study, affecting less than 5 chromosomes in all but one case, while >93% of MSS cases
had CNAs on at least 5 chromosomes (Additional file 1:
Figure S2A). TCGA samples with known MSI status
showed a similar distribution (Additional file 1: Figure S2B).
TCGA samples with unknown MSI status and at least 5
chromosomes affected (n = 37) were considered CIN and included with known MSS samples in order to maximise the
number of samples available for validation. MSS/CIN
TCGA cases with metastasis at diagnosis (n = 39) were compared with cases without metastasis at diagnosis and with
documented survival greater than two years (2-10 years,
mean = 5, n = 28). Out of all genomic regions with significantly different frequency of alteration and good effect size
(odds ratio ≥4) in our data, only deletion on 1p36
(odds ratio ≈ 6) was independently significant in TCGA.
We also observed that deletion or LOH on 18q11.2 (short
segment including CABLES1, odds ratio ≈ 3) was associated
with dissemination in both data sets, but with a relatively
low effect size (Additional file 1).
Subsets (stage II and stage III separately and together,
and with postoperative chemotherapy treated cases removed) of the current study displayed associations
(odds ratios) very similar to those of stages II-IV
combined, supporting that the deletion may be used
as a prognostic marker at diagnosis. Peak odds ratios
and independent 95% confidence intervals are shown in
Table 2. Statistics at base-pair resolution throughout the
Page 5 of 9
Table 2 Effect size of 1p36 loss association with tumour
dissemination
Alteration 1p36.11-21
Absolute loss
Relative loss
OR stage II-IV
4.5 (1.1-25.9)
5.5 (1.6-24.5)
OR stage II
4.4 (0.3-262)
6.5 (0.5-368)
OR stage III
3.6 (0.6-40.3)
3.3 (0.7-22.5)
OR stage II-III
4.0 (0.9-25.1)
4.3 (1.13-20.5)
OR stage II-III no
8.0 (0.9-393)
9.7 (1.1-472)
OR TCGA
4.1 (1.0-25.1)
2.8 (0.8-11.6)
Total frequency
17%
30%
chemotherapy
region are included in Additional file 1. Absolute loss
(fewer than 2 copies remaining) and relative loss (fewer
than genome average number of copies remaining) were
similarly associated with tumour dissemination, though
relative loss was more frequently observed (Table 2). For
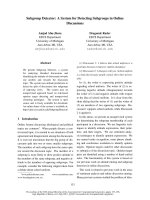
relative loss on 1p36, the difference in frequency between
the prognostic groups of the current study (stage II-IV)
exceeded 30% on 1p36.13 but was similar throughout
1p36.11-21 (Figure 2A). For the TCGA validation set the
difference in frequency exceeded 20% on 1p36.11 and was
similar throughout 1p36.11-13 (2B). Total frequency of
relative loss displayed very similar profiles in both data
sets and peak frequency of loss could be observed near
27 Mb (2C). The difference in frequency between the
prognostic groups could be confirmed in the TCGA data
set (2B), but a single gene or region responsible for the
worse prognosis could not be pinpointed.
Duplication of the genome is not associated with
prognosis or relative loss on 1p36
In both the current study and the TCGA validation data,
41% of MSS/CIN samples were found to have an average
copy number or ploidy above 2.5. Hyperploid genomes
may be the effect of whole genome duplications (WGD),
which have been implicated in tumours and observed in
cancer cell lines [16,17]. Allele-specific copy number
analysis has been used to identify WGD as a frequent
event in a variety of cancers including colon cancer,
where the frequency of WGD has been estimated to
approximately 50% [12]. We investigated evidence of
hyperploidy (average copy number >2.5) and WGD in
the current study and in the TCGA validation set. For
chromosomes present in 4 copies, a WGD event is more
likely to have produced 2 copies of each homolog than
triplication of one homolog, which is the more likely
outcome of successive amplification events leading to 4
copies. Similarly where 2 copies are present, LOH is
more likely observed if a WGD event has taken place
(after loss of one copy, or followed by loss of two
random copies) than if not. We used these assumptions
to develop a score sensitive to WGD (see Methods) that
Mayrhofer et al. BMC Cancer 2014, 14:872
/>
Page 6 of 9
Figure 2 Relative loss on 1p36. A) Frequency of relative loss (<67% of individual sample average copy number) on 1p36 when comparing
disseminated (metastatic SII-IV) and non-disseminated (SII-III) colon cancer, MSI excluded. High difference in frequency extended through 1p36.11-21
and included multiple cancer-related genes. B) TCGA validation set. Frequency of relative loss on 1p36, comparing stage IV cases with cases
non-metastatic at diagnosis and with long-term survival. C) Total frequencies of relative loss were very similar in the current study and the TCGA
validation set. Focal deletion of RHD (1p36.11) is a common germline polymorphism, likely not associated with the cancer.
would not be directly influenced by the average copy
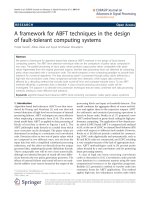
number of the genome. Not surprisingly, average ploidy
correlated strongly with WGD score (Figure 3AB).
Bimodal distributions of the WGD score for both the
current study and the TCGA validation set suggest two
groups of samples; one having undergone WGD and the
other not. WGD appeared to have occurred in most
genomes with hyperploidy and in about one third of all
samples. Average ploidy or WGD score did not associate
with prognosis or relative loss on 1p36 (p > 0.2, current
study MSS, logistic regression). However, absolute loss
on 1p36 was strongly associated with, and nearly exclusive
to near diploid genomes (p < 10−5).
Discussion
Treatment decisions for colon cancer patients are based on
TNM staging, where stage III patients most often receive
adjuvant chemotherapy while stage II patients (due to the
low risk for metastatic relapse) are only treated beyond surgical resection if some risk factors are observed. Molecular
markers have the potential to guide the use of adjuvant
treatment to minimize over- and under-treatment.
Mayrhofer et al. BMC Cancer 2014, 14:872
/>
Figure 3 Whole genome duplication. Scatter plots of whole
genome duplication (WGD) score and average ploidy indicate strong
correlation between hyperploidy and evidence of genome
duplication, neither of which associated with tumour dissemination
or relative loss of 1p36. Absolute loss of 1p36 (which is also counted
as relative loss) was almost exclusive to near-diploid genomes. The
histograms show bi-modal distributions for the WGD score, which
suggests two groups of samples; one having undergone WGD and
the other not. A) Samples of the current study (MSS, 92) with
tumour dissemination (metastatic disease) in blue. B) TCGA validation
samples (MSS/CIN, 252), metastatic at diagnosis in blue and with no
metastasis at diagnosis and long-term survival in black.
Association between 1p36 loss and metastasis in colon
cancer has been described previously [1,18-20]. In this
study we have shown that loss on 1p36 is associated with
tumour dissemination in MSS tumours of stages II-IV.
Stage IV was included in the study as cases with tumour
dissemination in order to improve the total number of
samples and the estimate of effect size, but significance was
retained in the stage II-III subset. Statistical significance
was also retained for stage II-III when patients who
received adjuvant chemotherapy were excluded, and odds
ratios were similar in stage II and stage III separately,
supporting that 1p36 loss can be used as a prognostic
Page 7 of 9
marker at diagnosis. While it is not unlikely that this
marker can be applied also to MSI cases (disseminated
MSI cases were indeed enriched for CNAs similar to those
seen in MSS, Additional file 1: Figure S1), the current
study included too few MSI cases with dissemination to
explore this further.
1p36.11-12 was the most commonly deleted region of
1p36 in both the current study and in the TCGA validation
set. The strongest association with tumour dissemination
was seen in a 15 Mbp region of 1p36.11-21 (Figure 2A),
similar to the region identified by Thorstensen et al [19].
The region contains multiple genes with a known or suspected role in cancer including ARID1A [21], E2F2 [22],
NBPF1 [23], PAX7 [24], RUNX3 [25] and SDHB [26]. One
or more such gene may be the cause of worse prognosis
through a dosage effect. It should be possible to identify them using a larger number of samples, or using
expression analysis of samples without loss of copies,
as such a gene may also be down-regulated by other
genetic or epigenetic mechanisms.
Assessing the practical value of a marker requires
estimating the associated relative and absolute risk. In
a selected case-control study such as this one only
odds ratio is relevant, as the absolute frequency of
distant recurrence and related markers cannot be estimated
without an unselected cohort design.
Analysis of absolute allele-specific copy numbers is
uncommon in studies of this kind; copy number gain
and loss are normally assigned based on log-ratio only
(DNA abundance in the extract, along the reference
genome, relative to its own median [11]), disregarding
tumour cell content and unknown average ploidy of
genomes. Absolute loss of copies results in a relatively
low copy number relative to the rest of the genome, but
LOH or relative loss may occur without absolute loss to
fewer than two copies. We identified relative loss on
1p36 as a better marker than absolute loss due to a
combination of high odds ratio and high total frequency.
Relative loss on 1p36 was not associated with hyperploidy
or duplication of the genome, while absolute loss was
almost exclusive to near diploid genomes. Though the
prognostic values of absolute and relative loss on 1p36
were similar (Table 2), relative loss as a prognostic marker
would benefit more patients by applying also to hyperploid cancer genomes. It should be noted that if a gene
dosage effect is causing the worse prognosis, the effect on
prognosis may depend on the size of the dosage effect
(e.g. in a genome with four copies on average, 3 remaining
copies of 1p36 may lead to a better prognosis than one
remaining copy). A much larger number of samples would
be required to describe such an effect in detail.
This study was designed to investigate association
between genomic aberrations and tumour dissemination
as a categorical variable, at diagnosis or within 5 years of
Mayrhofer et al. BMC Cancer 2014, 14:872
/>
observation after surgery, and irrespective of time to
recurrence or death. Five years is a sufficiently long time
to identify virtually all recurrences in colon cancer
patients [27]. Relative loss on 1p36 may be a particularly
useful prognostic marker for stage II patients where it,
according to our results, motivates the use of adjuvant
chemotherapy and regular observation for signs of relapse.
Conclusions
In this study we have shown that 1p36 deletion can be
used to predict metastatic recurrence in stage II-III
patients. The association with metastatic disease was
validated in independent data from The Cancer Genome
Atlas. Allele-specific copy number analysis allowed the
distinction of 1p36 loss relative to individual genome
average ploidy as a better prognostic marker than absolute
loss of copies, as relative loss had similar prognostic value
and was more frequent. This marker may be used to
reduce under-treatment particularly in stage II where about
15% of patients have distant recurrence after treatment
primarily based on surgery.
Ethical approval
This study was approved by the Regional Ethical Review
Board of Uppsala (2007/116) and written consent was
obtained from participants.
Additional file
Additional file 1: This file includes supplementary figures,
genome-wide copy number estimates and statistics.
Abbreviations
CIN: Chromosome Instability; CNA: Copy Number Alteration; LOH:
Loss-of-heterozygosity; MSI: Microsatellite Instability; MSS: Microsatellite
Stable; OR: Odds Ratio; TCGA: The Cancer Genome Atlas; WGD: Whole
Genome Duplication.
Competing interests
LM and TS are shareholders in ExScale Biospecimen Solutions AB, which
commercializes the technology for scalable gDNA extraction used.
Authors’ contributions
Study conception: BG, LP and AI. Collection and analysis of clinical data: HB,
MS. Characterization of fresh-frozen biobank material: JB and PM. Molecular
analysis: MS, LM, KE and TS. Bioinformatic analysis: MM, HGK and BV.
Interpretation of results: MM, HGK and AI. Drafted the manuscript: MM,
AI and HGK. All authors read and approved the final version of the manuscript.
Acknowledgements
We thank Maria Rydåker, Malin Olsson, Anna Haukkala and Simin
Tahmasebpoor for expert technical assistance and acknowledge the support
from the Array and Analysis Facility, Science for Life Laboratory, Husargatan
3, 751 23 Uppsala, Sweden. Funding for sample preparation and gene
analyses was provided by VINNOVA and the Swedish Cancer Society. The
results published here are in part based upon data generated by The Cancer
Genome Atlas pilot project established by the NCI and NHGRI. Information
about TCGA and the investigators and institutions who constitute the TCGA
research network can be found at “”.
Page 8 of 9
Author details
1
Science for Life Laboratory, Department of Medical Sciences, Uppsala
University, Box 3056, Uppsala 750 03, Sweden. 2Department of Surgical
Sciences, Uppsala University, Uppsala, Sweden. 3Science for Life Laboratory,
Department of Immunology Genetics and Pathology, Uppsala University,
Uppsala, Sweden. 4Department of Radiology, Oncology and Radiation
Science, Uppsala University, Uppsala, Sweden. 5Leibniz Research Centre for
Working Environment and Human Factors, Dortmund TU, Dortmund,
Germany.
Received: 29 July 2014 Accepted: 13 November 2014
Published: 24 November 2014
References
1. Network TCGA: Comprehensive molecular characterization of human
colon and rectal cancer. Nature 2012, 487:330–337.
2. Perucho M: Correspondence re: C. R. Boland et al. A National Cancer
Institute Workshop on Microsatellite Instability for Cancer Detection and
Familial Predisposition: Development of International Criteria for the
Determination of Microsatellite Instability in Colorectal Cancer. Cancer
Res., 58: 5248–5257, 1998. Cancer Res 1999, 59:249–256.
3. Laiho P, Launonen V, Lahermo P, Esteller M, Guo M, Herman JG, Mecklin J-P,
Järvinen H, Sistonen P, Kim K-M, Shibata D, Houlston RS, Aaltonen LA:
Low-level microsatellite instability in most colorectal carcinomas.
Cancer Res 2002, 62:1166–1170.
4. Lothe RA, Peltomäki P, Meling GI, Aaltonen LA, Nyström-Lahti M, Pylkkänen L,
Heimdal K, Andersen TI, Møller P, Rognum TO, Fosså SD, Haldorsen T,
Langmark F, Brøgger A, de la Chapelle A, Børresen A-L: Genomic instability in
colorectal cancer: relationship to clinicopathological variables and family
history. Cancer Res 1993, 53:5849–5852.
5. Halling KC, French AJ, McDonnell SK, Burgart LJ, Schaid DJ, Peterson BJ,
Moon-Tasson L, Mahoney MR, Sargent DJ, O’Connell MJ, Witzig TE, Farr GH
Jr, Goldberg RM, Thibodeau SN: Microsatellite instability and 8p allelic
imbalance in stage B2 and C colorectal cancers. J Natl Cancer Inst 1999,
91:1295–1303.
6. Fearon ER, Cho KR, Nigro JM, Kern SE, Simons JW, Ruppert JM, Hamilton SR,
Preisinger AC, Thomas G, Kinzler KW: Identification of a chromosome 18q
gene that is altered in colorectal cancers. Science 1990, 247:49–56.
7. Tanaka T, Watanabe T, Kazama Y, Tanaka J, Kanazawa T, Kazama S, Nagawa H:
Chromosome 18q deletion and Smad4 protein inactivation correlate with
liver metastasis: a study matched for T- and N- classification. Br J Cancer
2006, 95:1562–1567.
8. Sheffer M, Bacolod MD, Zuk O, Giardina SF, Pincas H, Barany F, Paty PB,
Gerald WL, Notterman DA, Domany E: Association of survival and disease
progression with chromosomal instability: a genomic exploration of
colorectal cancer. Proc Natl Acad Sci U S A 2009, 106:7131–7136.
9. Nakao M, Kawauchi S, Uchiyama T, Adachi J, Ito H, Chochi Y, Furuya T,
Oga A, Sasaki K: DNA copy number aberrations associated with the
clinicopathological features of colorectal cancers: Identification of
genomic biomarkers by array-based comparative genomic hybridization.
Oncol Rep 2011, 25:1603–1611.
10. Poulogiannis G, Ichimura K, Hamoudi RA, Luo F, Leung SY, Yuen ST,
Harrison DJ, Wyllie AH, Arends MJ: Prognostic relevance of DNA copy
number changes in colorectal cancer. J Pathol 2010, 220:338–347.
11. Rasmussen M, Sundstrom M, Goransson Kultima H, Botling J, Micke P,
Birgisson H, Glimelius B, Isaksson A: Allele-specific copy number analysis of
tumor samples with aneuploidy and tumor heterogeneity. Genome Biol
2011, 12:R108.
12. Carter SL, Cibulskis K, Helman E, McKenna A, Shen H, Zack T, Laird PW,
Onofrio RC, Winckler W, Weir BA, Beroukhim R, Pellman D, Levine DA,
Lander ES, Meyerson M, Getz G: Absolute quantification of somatic DNA
alterations in human cancer. Nat Biotechnol 2012, 30:413–421.
13. Mathot L, Wallin M, Sjöblom T: Automated serial extraction of DNA and
RNA from biobanked tissue specimens. BMC Biotechnol 2013, 13:66.
14. Kim T-M, Laird PW, Park PJ: The landscape of microsatellite instability in
colorectal and endometrial cancer genomes. Cell 2013, 155:858–868.
15. Olshen AB, Venkatraman ES, Lucito R, Wigler M: Circular binary
segmentation for the analysis of array-based DNA copy number data.
Biostatistics 2004, 5:557–572.
16. Fodde R, Kuipers J, Rosenberg C, Smits R, Kielman M, Gaspar C, van Es JH,
Breukel C, Wiegant J, Giles RH, Clevers H: Mutations in the APC tumour
Mayrhofer et al. BMC Cancer 2014, 14:872
/>
17.
18.
19.
20.
21.
22.
23.
24.
25.
26.
27.
Page 9 of 9
suppressor gene cause chromosomal instability. Nat Cell Biol 2001,
3:433–438.
Barber TD, McManus K, Yuen KWY, Reis M, Parmigiani G, Shen D, Barrett I,
Nouhi Y, Spencer F, Markowitz S, Velculescu VE, Kinzler KW, Vogelstein B,
Lengauer C, Hieter P: Chromatid cohesion defects may underlie
chromosome instability in human colorectal cancers. Proc Natl Acad Sci U
S A 2008, 105:3443–3448.
Ogunbiyi OA, Goodfellow PJ, Gagliardi G, Swanson PE, Birnbaum EH,
Fleshman JW, Kodner IJ, Moley JF: Prognostic value of chromosome 1p
allelic loss in colon cancer. Gastroenterology 1997, 113:761–766.
Thorstensen L, Qvist H, Heim S, Liefers GJ, Nesland JM, Giercksky KE,
Lothe RA: Evaluation of 1p losses in primary carcinomas, local
recurrences and peripheral metastases from colorectal cancer
patients. Neoplasia 2000, 2:514–522.
Kim M-Y, Yim S-H, Kwon M-S, Kim T-M, Shin S-H, Kang H-M, Lee C, Chung Y-J:
Recurrent genomic alterations with impact on survival in colorectal cancer
identified by genome-wide array comparative genomic hybridization.
Gastroenterology 2006, 131:1913–1924.
Wang K, Kan J, Yuen ST, Shi ST, Chu KM, Law S, Chan TL, Kan Z, Chan ASY,
Tsui WY, Lee SP, Ho SL, Chan AKW, Cheng GHW, Roberts PC, Rejto PA,
Gibson NW, Pocalyko DJ, Mao M, Xu J, Leung SY: Exome sequencing
identifies frequent mutation of ARID1A in molecular subtypes of gastric
cancer. Nat Genet 2011, 43:1219–1223.
Lee C, Chang JH, Lee HS, Cho Y: Structural basis for the recognition of the
E2F transactivation domain by the retinoblastoma tumor suppressor.
Genes Dev 2002, 16:3199–3212.
Vandepoele K, Van Roy N, Staes K, Speleman F, van Roy F: A novel gene
family NBPF: intricate structure generated by gene duplications during
primate evolution. Mol Biol Evol 2005, 22:2265–2274.
Blake J, Ziman MR: Aberrant PAX3 and PAX7 expression. A link to the
metastatic potential of embryonal rhabdomyosarcoma and cutaneous
malignant melanoma? Histol Histopathol 2003, 18:529–539.
Soong R, Shah N, Peh BK, Chong PY, Ng SS, Zeps N, Joseph D, Salto-Tellez M,
Iacopetta B, Ito Y: The expression of RUNX3 in colorectal cancer is associated
with disease stage and patient outcome. Br J Cancer 2009, 100:676–679.
Neumann HPH, Pawlu C, Peczkowska M, Bausch B, McWhinney SR, Muresan M,
Buchta M, Franke G, Klisch J, Bley TA, Hoegerle S, Boedeker CC, Opocher G,
Schipper J, Januszewicz A, Eng C, European-American Paraganglioma Study
Group: Distinct clinical features of paraganglioma syndromes associated
with SDHB and SDHD gene mutations. JAMA 2004, 292:943–951.
Birgisson H, Wallin U, Holmberg L, Glimelius B: Survival endpoints in
colorectal cancer and the effect of second primary other cancer on
disease free survival. BMC Cancer 2011, 11:438.
doi:10.1186/1471-2407-14-872
Cite this article as: Mayrhofer et al.: 1p36 deletion is a marker for
tumour dissemination in microsatellite stable stage II-III colon cancer.
BMC Cancer 2014 14:872.
Submit your next manuscript to BioMed Central
and take full advantage of:
• Convenient online submission
• Thorough peer review
• No space constraints or color figure charges
• Immediate publication on acceptance
• Inclusion in PubMed, CAS, Scopus and Google Scholar
• Research which is freely available for redistribution
Submit your manuscript at
www.biomedcentral.com/submit