Epigenetic silencing of genes and microRNAs within the imprinted Dlk1-Dio3 region at human chromosome 14.32 in giant cell tumor of bone
Bạn đang xem bản rút gọn của tài liệu. Xem và tải ngay bản đầy đủ của tài liệu tại đây (924.61 KB, 10 trang )
Lehner et al. BMC Cancer 2014, 14:495
/>
RESEARCH ARTICLE
Open Access
Epigenetic silencing of genes and microRNAs
within the imprinted Dlk1-Dio3 region at human
chromosome 14.32 in giant cell tumor of bone
Burkhard Lehner†, Pierre Kunz†, Heiner Saehr and Joerg Fellenberg*
Abstract
Background: Growing evidence exists that the neoplastic stromal cell population (GCTSC) within giant cell tumors
(GCT) originates from mesenchymal stem cells (MSC). In a previous study we identified a microRNA signature that
differentiates between these cell types. Five differentially expressed microRNAs are located within the Dlk1-Dio3
region on chromosome 14. Aberrant regulation within this region is known to influence cell growth, differentiation
and the development of cancer. The aim of this study was to elucidate the involvement of deregulations within the
Dlk1-Dio3 region in GCT pathogenesis.
Methods: Quantitative gene and microRNA expression analyses were performed on GCTSCs and MSCs with or
without treatment with epigenetic modifiers. Methylation analysis of differentially methylated regions was
performed by bisulfite sequencing.
Results: In addition to microRNA silencing we detected a significant downregulation of Dlk1, Meg3 and Meg8 in
GCTSCs compared to MSCs. DNA methylation analyses of the Meg3-DMR and IG-DMR revealed a frequent
hypermethylation within the IG-DMR in GCTs. Epigenetic modification could restore expression of some but not
all analyzed genes and microRNAs suggesting further regulatory mechanisms.
Conclusion: Epigenetic silencing of genes and microRNAs within the Dlk1-Dio3 region is a common event in
GCTSCs, in part mediated by hypermethylation within the IG-DMR. The identified genes, micro RNAs and microRNA
target genes might be valuable targets for the development of improved strategies for GCT diagnosis and therapy.
Keywords: Giant cell tumor, Mesenchymal stem cell, MicroRNA, Epigenetics, Methylation
Background
Although generally benign, giant cell tumors of bone
(GCT) are characterized by a locally aggressive behavior.
They represent about 5% of all primary bone tumors
and are frequently located at the meta-epiphyseal region
of long bones including the distal femur, proximal tibia
and the radius [1,2]. GCTs induce expansive osteolytic
defects associated with significant bone destruction.
Despite their benign nature, GCTs are characterized by
a highly variable and unpredictable behavior. Although
rare, GCT can manifests a malignant phenotype, and
metastases have been described in up to 5% of the cases
* Correspondence:
†
Equal contributors
Research Centre for Experimental Orthopedics, Department of Orthopedics,
Trauma Surgery and Paraplegia, Orthopedic University Hospital Heidelberg,
Schlierbacher Landstr 200a, Heidelberg 69118, Germany
[3,4]. The current treatment is restricted to surgical resection of the tumor, which is, however, associated with
a high recurrence rate [5]. Histologically, GCTs consists of
multinucleated giant cells, histiocytes and fibroblast-like
stromal cells, which are supposed to represent the
neoplastic cell population. A subpopulation of these
neoplastic stromal cells (GCTSCs) are characterized by
the expression of mesenchymal stem cell (MSC) markers
including CD73, CD105 and CD166 as well as the mesenchymal marker FGFR3 (fibroblast growth factor receptor3)
[6,7]. Together with the fact that these cells display a
differentiation potential comparable to MSCs, these
data strongly indicate that GCTSCs develop from MSCs.
In agreement with this hypothesis, we observed highly
similar gene and microRNA expression profiles of
GCTSCs and MSCs in previous studies [8,9]. However,
© 2014 Lehner et al.; licensee BioMed Central Ltd. This is an Open Access article distributed under the terms of the Creative
Commons Attribution License ( which permits unrestricted use, distribution, and
reproduction in any medium, provided the original work is properly credited. The Creative Commons Public Domain
Dedication waiver ( applies to the data made available in this article,
unless otherwise stated.
Lehner et al. BMC Cancer 2014, 14:495
/>
we could also identify a differentially expressed microRNA signature that separates GCTSCs from MSCs,
suggesting possible roles of the identified microRNAs
and their target genes in the development and progression
of GCTs [9]. Interestingly, five of the identified, differentially expressed microRNAs are arranged within two
microRNA clusters located on human chromosome 14q32
[10]. These microRNA clusters have already been shown
to be downregulated in ovarian cancer, melanoma and
gastrointestinal stromal tumors, suggesting an important
role of the encoded microRNAs for the development of
several types of tumors [11-13]. The microRNA clusters
are located within an imprinted chromosomal region
designated Dlk1-Dio3 locus that harbors several proteincoding, paternally expressed genes including Dlk1 (deltalike homolog 1), Rtl1 (retrotransposon-like 1) and Dio3
(iodothyronine deiodinase 3) and the non-coding, maternally expressed genes Meg3 and Meg8. Imprinting of the
Dlk1-Dio3 locus is regulated by two differentially methylated regions (DMRs) termed IG-DMR and Meg3-DMR
[14,15]. The results of our previous studies suggest that
deregulations within the Dlk1-Dio3 locus might be implicated in GCT pathogenesis. Therefore, the aim of this
study was to investigate the expression of genes and
microRNAs located within the Dlk1-Dio3 region in
MSCs and GCTSCs with or without treatment with
epigenetic modifiers. Analysis of methylation frequencies within the IG-DMR and Meg3-DMR in GCTSCs
compared to MSCs were performed to detect possible
implications of epigenetic alterations on the expression
of differentially expressed genes and microRNAs that
might contribute to GCT pathogenesis.
Methods
The studies were approved by the Ethics Committee of
the University of Heidelberg and informed consent to
analyze tumor tissue and to publish clinical details was
obtained from all individuals included in the study.
Patient characteristics are summarized in Table 1.
Page 2 of 10
Table 1 Characteristics of GCT patients
Patient ID
Age
Gender
Tumor localization
GCT-1
21
f
Right femur
GCT-2
31
f
Left tibia
GCT-3
60
m
Right patella
GCT-4
33
f
Left femur
GCT-5
37
f
Right femur
GCT-6
63
m
Left humerus
GCT-7
33
m
Left radius
GCT-8
28
m
Right femur
GCT-9
29
m
Right femur
GCT-10
48
m
Right tibia
cells attached in the culture flask. Detached cells were cultured for further 3 passages eliminating any remaining
giant cells and histiocytes. MSCs were isolated from fresh
bone marrow samples derived from the iliac crest. Cells
were fractionated on a Ficoll-Paque Plus density gradient
(Amersham Pharmacia, Uppsala, Sweden), and the lowdensity MSC-enriched fraction was washed and seeded in
culture flasks. MSC culture medium consisted of DMEM
high glucose (Lonza GmbH, Köln, Germany) 12.5% FCS,
1× NEAA (non-essential amino acids) (Life Technologies,
Darmstadt, Germany), 50 μM 2-mercaptoethanol (Life
Technologies, Darmstadt, Germany) and 4 ng/ml bFGF
(basic fibroblast growth factor) (Merck Chemicals GmbH,
Schwalbach, Germany). After 24–48 h, cultures were
washed with PBS to remove non-adherent material.
During expansion, medium was replaced twice a week.
For the treatment of cells with epigenetic modifiers,
cells were seeded at 25% confluence and cultured for
10 days in medium containing 10 μM 5-Aza-2′-deoxycytidine (Sigma, Deisenhofen, Germany), 3 mM phenylbutyric acid (Sigma, Deisenhofen, Germany) or both.
Medium was replaced every 2 days. Controls were cultured in medium without supplements.
RNA extraction
Sample preparation and cell culture
Primary GCTSCs were isolated from tissue samples derived from tumor resections in our clinic. The tissue
was mechanically cut in small pieces and digested with
1.5 mg/ml collagenase B (Roche Diagnostics, Mannheim,
Germany) for 3 h at 37°C in Dulbecco’s Modified
Eagle Medium (DMEM) (Lonza GmbH, Köln, Germany)
containing 4.5 g/l glucose and supplemented with 10%
fetal calf serum (FCS) (Biochrom, Berlin, Germany), and
100 U/ml penicillin/streptomycin (Lonza GmbH, Köln,
Germany). Cells were collected by centrifugation, washed
twice in PBS and cultured in DMEM. Twenty-four hours
after plating, cells were carefully treated with Trypsin/
EDTA (Lonza GmbH, Köln, Germany) leaving the giant
Total RNA was extracted using mirVana miRNA Isolation
Kit (Invitrogen, Darmstadt, Germany). RNA concentrations and purity were determined with a NanoDrop ND1000 spectrophotometer (Peqlab, Erlangen, Germany).
Extracted RNA was used for both, miRNA expression
and RT-qPCR gene expression analyses.
RT-qPCR
First strand complementary DNA (cDNA) was synthesized
from 1 μg of total RNA using 1 μl Omniscript (Qiagen,
Hilden, Germany), 10 μM oligo-dT primer, 5 mM dNTPs
and 10U RNaseOut (Invitrogen, Karlsruhe, Germany) for
2 h at 37°C in a total volume of 20 μl. RT-qPCR was performed in the real-time thermal cycler Mx3005p (Agilent
Lehner et al. BMC Cancer 2014, 14:495
/>
Technologies, Waldbronn, Germany) in a total volume of
20 μl using Absolute QPCR SYBR Green mix (Thermo
scientific, Dreieich, Germany) and 1 μl of cDNA as
template. Samples were heated to 95°C for 15 minutes
followed by 40 cycles of denaturation at 95°C for 15 seconds, annealing at 58°C for 20 seconds and extension at
72°C for 30 seconds. After the last cycle, a melting
curve analysis was performed to verify the specificity of
the amplified PCR products. Calculated gene expression was normalized on the basis of the expression of
RPL19 (ribosomal protein L19) in the corresponding
sample. The following primers were used: Dlk1-F: 5′GACGGGGAGCTCTGTGATAG-3′, Dlk1-R: 5′-TCAT
AGAGGCCATCGTCCA-3′, Meg3-F: 5′-ACGGGCT
CTCCTTGCATC-3′, Meg3-R: 5′-GCTTCCATCCGCA
GTTCTTC-3′, Meg8-F: 5′-TGTCGGAGGATCGTGT
CAT-3′, Meg8-R: 5′-AATCTTCTAGAGCCCCAGAT
CC-3′, Rtl1-F: 5′-CTCCAGAGAGGTGGATGGTC-3′,
Rtl1-R: 5′-GATTGATGTCCGGATGGACT-3′, Dio3-F:
5′-CGCACAGCCCCTAGAATAGT-3′, Dio3-R: 5′-GC
CACTACTATTTCCCTACAGAGC-3′, CD163-F 5′-GA
AGATGCTGGCGTGACAT-3′; CD163-R 5′-GCTGCCT
CCACCTCTAAGTC-3′; CD34-F 5′-TGGCTATTTCCT
GATGAATCG-3′; CD34-R 5′-TCCACCGTTTTCCGTG
TAAT-3′; CSF1R-F 5′-TCTGGTCCTATGGCATCCTC3′; RPL19-F: 5′-GTGGCAAGAAGAAGGTCTGG-3′, RP
L19-R: 5′-GCCCATCTTTGATGAGCTTC-3′.
RT-qPCR of microRNAs
Quantification of microRNA expression was done using
the TaqMan MicroRNA Reverse Transkription kit from
Applied Biosystems (Darmstadt, Germany) according to
the manufacturer′s instructions. In brief, 10 ng of total
RNA isolated with the mirVana miRNA Isolation Kit
was subjected to cDNA sysnthesis using microRNA specific stem-loop primer. For RT-qPCR 1.5 μl of cDNA
was used in a total volume of 20 μl containing microRNA specific primer and TaqMan probes. Samples were
heated to 95°C for 10 min followed by 40 cycles of denaturation at 95°C for 15 sec and a combined annealing/
extension step at 60°C for 60 sec. The reaction was carried out in the real-time thermal cycler M×3005p from
Agilent Technologies. Calculated microRNA expression
levels were normalized on the basis of the RNU6B expression in the corresponding sample. RNU6B is a small
nuclear RNA frequently used as reference RNA for
microRNA quantification.
RT-PCR of Meg3 splice variants
First strand complementary DNA (cDNA) was synthesized from 1 μg of total RNA as described for RT-qPCR.
Amplification of Meg3 isoforms was performed using
2 μl cDNA as template, 0.25 μl PlatinumTaq polymerase
(Invitrogen), 0.6 μl MgCl2 (50 mM), 0.4 μl dNTPs (10 mM
Page 3 of 10
each) and 0.5 μl of each primer (10 μM) in a total volume
of 20 μl. The following primers were used: MEG3EX3-F
5′-ACGGGCTCTCCTTGCATC-3′, MEG3EX4-F 5′-CT
GCTTCCTGACTCGCTCTA-3′, MEG3EX5F 5′-GGCT
GCAGACGTTAATGAGG-3′, MEG3EX6F 5′-TGTCTC
CATCTCCTGCCAAG-3′, MEG3EX8-R 5′-GCTTCCA
TCCGCAGTTCTTC-3′. Samples were incubated at 94°C
for 3 min followed by 36 cycles of denaturation at 94°C for
15 s, annealing at 58°C for 30s and extension at 72°C for
45 s and a final extension step at 72°C for 7 min. PCR
products were separated on a 1.6% agarose gel and visualized by ethidiumbromide staining.
Copy number assay
Total cellular DNA was extracted using DNeasy Tissue
kit (Qiagen) according to manufacturer’s protocol. DNA
copy number of the cytoband 14q32.2b on chromosome
14 was quantified using TaqMan copy number assay
(Life Technologies) and the primers Hs03874180_cn.
The copy number of the genomic RNAse P region was
used as reference.
Bisulfite sequencing
For methylation analysis of the IG-DMR and the
Meg3-DMR, total cellular DNA was extracted using
DNeasy Tissue kit (Qiagen) according to manufacturer’s protocol. One μg of DNA was bisulfite treated
using EpiTect Plus Bisulfite kit (Qiagen). DNA fragments covering the IG-DMR and the Meg3-DMR, respectively, were amplified by PCR using the following
primers: IG-DMR-F: 5′-TGGGATTATAGGTATTATG
TTTGGA-3′, IG-DMR-R: 5′-CACTACTAAAAACTACATTTAAACAA-3′, Meg3DMR-F 5′- GTTAGGGA
TTAATTTTTATGTGTTAG-3′, Meg3DMR-R 5′-CA
AATTCTATAACAAATTACTCTAAC-3′.
The IG-DMR fragment (909 bp) harbors 31 CpG dinucleotides and the Meg3-DMR (819 bp) harbors 44 CpG
dinucleotides. According to the sequence NT_026437.12
at NCBI Database the position of the analyzed IG-DMR
sequence is 82.276.640 – 82.277.549 and that of the analyzed Meg3-DMR fragment is 82.291.515 – 82.292.333.
PCR products were cloned into pCR4-TOPO vector
using TOPO TA cloning kit (Life Technologies) and sequenced. Methylation was analyzed using BiQ-Analyzer
software [16].
Results
Isolation of GCTSCs used in this study was performed
as described previously. In brief, tumor tissue was enzymatically digested and the cells were taken into culture.
Stromal cells and histiocytes were removed by trypsinization, leaving the giant cells attached in the culture
flask. Detached cells were further cultured for 3 passages
until only the neoplastic stromal cells survived. To verify
Lehner et al. BMC Cancer 2014, 14:495
/>
the purity of the isolated GCTSCs they were tested for
the absence of the monocytic/histiocytic markers CD163
and CD34 and the absence of colony stimulating factor
1 receptor (CSF1R) expressed by giant cells by RT-qPCR
as described earlier [8].
In a previous study we investigated the microRNA
expression profiles of GCTSCs and MSCs in order to
identify possible candidates involved in the neoplastic
transformation of MSCs during GCT pathogenesis. We
could demonstrate that these two cell types differ in a
microRNA signature consisting of only 26 differentially
expressed microRNAs, mostly downregulated in GCTs.
Interestingly, the coding region of five of these microRNAs is located within the Dlk1-Dio3 locus on chromosome 14 regulated by the differentially methylated regions
IG-DMR and Meg3-DMR (Figure 1). RT-qPCR analysis
showed a significant downregulation of these microRNAs
in GCTSCs compared to MSCs (Figure 2). As the whole
Dlk1-Dio3 region is known to be under the control of
two differentially methylated regions, we assumed that
GCTSCs and MSCs might also differ in gene expression
patterns. In fact, we could detect a significant downregulation of Dlk1 and the non-coding, maternally expressed
genes Meg3 and Meg8 in GCTSCs. Although not significant, expression of Rtl1 and Dio3 was also reduced in
GCTSCs (Figure 3A). A possible explanation for the observed differences in gene and microRNA expression
might be chromosomal rearrangements, especially deletions within the Dlk1-Dio3 region. However, we could
exclude this possibility by performing a DNA copy
number assay based on real time PCR amplification and
detection with an IG-DMR specific TaqMan probe. Two
copies were detected in MSCs, GCTSCs and normal
osteoblasts taken as controls (Figure 3B). To investigate
the involvement of epigenetic mechanisms in the regulation of microRNA and gene expression we treated
GCTSCs with the demethylating agent Aza (5-Aza-2′deoxycytidine), the histone deacetylase inhibitor PBA
(phenyl butyric acid) or a combination of both. Expression
of the genes Dlk1, Meg3, Meg8, Rtl1 and Dio3 slightly
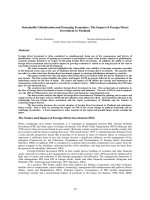
Figure 1 Schematic illustration of the Dlk1-Dio3 locus on human
chromosome 14q32. The location of the noncoding maternally
expressed genes Meg3 and Meg8, the paternally expressed genes
Dlk1, Rtl1 and Dio3, the differentially methylated regions (DMRs) and
the position of the microRNA clusters are indicated.
Page 4 of 10
increased after treatment with Aza but no significant
differences could be detected. However, a considerable
increase in gene expression could be induced by PBA.
The combined treatment of GCTSCs with Aza and
PBA further increased expression of all analyzed genes
(Figure 4A). A significant but more selective influence
of epigenetic modifiers could also be observed on microRNA expression levels. While expression of miR-136,
miR-376a and miR-377 did not significantly change during treatment, expression of miR-376c and miR-127-3p
was significantly increased by Aza treatment and was
further elevated by the combined treatment with Aza
and PBA. Interestingly, PBA alone had no effect on
microRNA expression (Figure 4B). Notably, during RTqPCR analysis of Meg3 expression, we observed a different melting temperature of the amplification product in
GCTSCs compared to MSCs, indicating the synthesis of
a different DNA fragment. The Meg3 gene contains 10
exons, while the original Meg3 transcript identified in a
human EST library is restricted to exons 1, 2, 3, 8, 9 and
10 [17]. Until now, at least 12 Meg3 isoforms have been
described that contain one or more of the additional
exons 4–7 [18]. To analyze the expression of Meg3
splice variants in GCTSCs we performed conventional
PCR using forward primers located in exon 3, 4, 5 and 6
in combination with a reverse primer located in exon 8.
In MSCs, that were taken as controls, primers located
in exon 3 and 8 that should amplify all Meg3 isoforms,
produced a main fragment of 186 bp that corresponds
to the isoform consisting of exons 1, 2, 3, 4, 8, 9 and 10.
This isoform has already been shown to be the most
abundant Meg3 transcript in many other cell types [18].
In addition, larger fragments of additional isoforms
could also be detected in untreated MSCs. In contrast,
the main transcript is completely missing in untreated
GCTSCs that only express very low amounts of some
other splice variants, explaining the observed differences
in the melting temperature during RT-qPCR analysis of
untreated cells. Treatment of GCTSCs with epigenetic
modifiers restored expression of all Meg3 isoforms to
comparable levels observed in untreated MSCs. Based
on the location of the primer and the size of the PCR
products, we could identify all known Meg3 isoforms
in GCTSCs treated with Aza and PBA (Figure 5A,B).
Our data suggested that epigenetic mechanisms are
involved in the observed downregulation of genes and
microRNAs in GCTSCs. Thus, we aimed to investigate
the degree of methylation within the IG-DMR and the
Meg3-DMR in GCTSCs and MSCs. The methylation
status of 31 CpG dinucleotides within a 909 bp DNA
fragment covering the IG-DMR and 44 CpG dinucleotides within a 819 bp fragment covering the Meg3-DMR
was investigated. Analysis was done using bisulfite sequencing of cloned DNA fragments. Methylation frequencies
Lehner et al. BMC Cancer 2014, 14:495
/>
Page 5 of 10
Figure 2 Silencing of specific microRNAs in GCTSCs. Total RNA including microRNAs was extracted from cultured GCTSCs (n = 10) and MSCs
(n = 10) and expression of microRNAs was quantified relative to the expression of the small nuclear RNA RNU6B. The white lines indicate the
median, the lower and upper boundaries of the box indicate the 25th and 75th percentile. The whiskers indicate the highest and lowest values.
(**p < 0.01 determined by Mann–Whitney-U test).
were calculated for each CpG as percent methylation in
all analyzed samples. In a first step we analyzed 10 individual clones derived from one GCTSC and one MSC
cell line. Within the analyzed Meg3-DMR region we
could not detect any hypermethylation in the GCTSC
cell line compared to MSC that could contribute to
gene and microRNA silencing. Detected methylation
frequencies were rather decreased in the GCTSC sample. However, we could detect elevated methylation
frequencies within the range of the first 13 analyzed
CpGs of the IG-DMR region in GCTSC compared to
the MSC sample (Figure 6A,B). To validate these results
we extended the analysis to eight different GCTSC and
MSC cell lines and observed comparable methylation
frequencies. A significant hypermethylation of CpGs 1–13
within the analyzed IG-DMR region was consistently
detected in all GCTSC cell lines compared to MSCs
(Figure 6C-E).
Discussion
There is growing evidence that GCTSCs, the neoplastic
cell population within GCTs, develop from MSCs.
Particularly, the expression of mesenchymal stem cell
markers and the observation of an osteoblastic, chondroblastic and adipogenic differentiation potential of
GCTSCs support this hypothesis [6,7]. However, the
molecular mechanisms involved in the neoplastic
transformation of MSCs are largely unknown. In order
to identify possible mediators of this progress we performed comparative gene and microRNA expression
analysis of GCTSCs and MSCs obtained from the same
patient in previous studies [8,9]. We identified a microRNA signature consisting of 26 microRNAs which clearly
differentiates between GCTSCs and MSCs. Interestingly,
23 of these microRNAs are silenced or downregulated in
GCTSCs and five of them are located within the imprinted
Dlk1-Dio3 locus on chromosome 14q32. In addition to
Figure 3 Significant downregulation of Dlk1, Meg3 and Meg8 in GCTSCs. (A) Expression of Dlk1, Meg3, Meg8, Rtl1 and Dio3 was analyzed
by RT-qPCR in GCTSCs (n = 5) and MSCs (n = 5). Data were normalized on the basis of the ribosomal protein L19 (RPL19) expression in the
corresponding sample. Data are presented as mean ± SD. (*p < 0.05 **p < 0.01 determined by Mann–Whitney-U test). (B) IG-DMR copy number assay.
The IG-DMR copy number was determined by RT-qPCR in MSCs, GCTSCs and osteoblasts and calculated using the genomic RNAse P region
as reference.
Lehner et al. BMC Cancer 2014, 14:495
/>
Page 6 of 10
Figure 4 Restoration of gene and microRNA expression in GCTSCs after treatment with epigenetic modifiers. GCTSCs (n = 5) and MSCs
(n = 5) were cultured in medium containing 10 μM 5-Aza-2′-deoxycytidine (Aza), 3 mM phenylbutyric acid (PBA) or both for 10 days. (A) Expression of
Dlk1, Meg3, Meg8, Rtl1 and Dio3 normalized to the RPL19 expression in the corresponding sample. (B) Expression of miR-127-3p andmiR-376c
normalized to the RNU6B expression in the corresponding sample. Data are presented as mean ± SD. (*p < 0.05 **p < 0.01 compared to
untreated control cells determined by Mann–Whitney-U test).
the paternally expressed genes Dlk1, Rtl1 and Dio3 and
the maternally expressed genes Meg3 and Meg8 this
region harbors one of the largest microRNA clusters in
the human genome consisting of 54 microRNAs [19].
Aberrant expression of several microRNAs located
within this region has been implicated in the pathogenesis of several tumors including esophageal squamous
cell carcinoma [20], gastric cancer [21], gastrointestinal
stromal tumor [13], colorectal cancer [22] and hepatocellular carcinoma [23]. At least eight microRNAs within
this cluster have been identified as potential tumor suppressors, among them mir-376a and miR-377, silenced
in GCT [9,11]. Besides alterations in microRNA expression also deregulations of gene expression within this
chromosomal region have been observed in several
types of tumors including neuroblastoma, pituitary
adenomas, hepathocellular carcinomas and multipla
myelomas [24-27]. For example, expression of the noncoding, maternally expressed gene Meg3 has been
shown to be lost in many kinds of primary human tumors
and tumor cell lines. Re-expression of Meg3 inhibits cell
proliferation and induces apoptosis and accumulation of
p53, thus, influencing the expression of p53 target genes.
Therefore, Meg3 is supposed to have tumor suppressor
properties [28]. Likewise, tumor suppressor characteristics
have been demonstrated for the paternally expressed gene
Dlk1. In contrast to normal kidney tissue, loss of Dlk1
expression has been shown in renal cell carcinoma and
re-expression of Dlk1 markedly increased anchorageindependent cell death and suppressed tumor growth in
nude mice [29]. In agreement with these findings we
could observe a significant downregulation of Dlk1,
MEG3 and MEG8 expression in GCTSCs compared to
MSCs. Together with our observation of microRNA
silencing in GCTSCs, these data indicate that deregulations within the Dlk1-Dio3 locus are also involved in
GCT pathogenesis and might play an important role in
the malignant transformation of MSCs. With respect to
the assumed development of GCTSCs from MSCs the
observation of an involvement of the Dlk1-Dio3 locus
in the regulation of cellular stemness is of particular
importance. Gene and microRNA transcript levels have
been shown to correlate with pluripotency status of
induced pluripotent stem cells from mice [30,31].
Lehner et al. BMC Cancer 2014, 14:495
/>
Page 7 of 10
Figure 5 Identification of Meg3 splice variants. (A) Schematic illustration of the Meg3 gene exon structure. Exons found in all Meg3 isoforms
are shown in white, variable exons are shown in black. The location of the primers used to detect the different Meg3 isoforms are marked by
arrows. (B) GCTSCs were cultured with or without the addition of Aza and PBA before Meg3 splice variants were amplified by PCR using primers
located in different exons. PCR products were separated on a 1.6% agarose gel. Untreated MSCs served as controls. The structure of the main
transcript is indicated. Additional splice variants appear as larger transcripts above the main product.
Further, aberrant expression of specific microRNAs within
this region has been attributed to a stem-like subtype of
hepatocellular carcinoma associated with poor prognosis
[23]. While frequently allelic loss (LOH) of chromosome
14q has been reported to be responsible for aberrant gene
expression [32-34], epigenetic alterations have also been
shown to influence gene and microRNA expression within
this chromosomal region, mainly mediated by the differentially methylated regions IG-DMR and MEG3-DMR
[12,26,35]. In GCTSCs we could not detect any copy
number variations of the IG-DMR locus suggesting that
predominantly epigenetic alterations are responsible for
the observed downregulation of gene and microRNA expression. While methylation analyses of the Meg3-DMR
could not reveal any hypermethylated regions that might
be associated with gene and microRNA silencing in
GCTSCs, we identified a region within the IG-DMR
spanning 13 CpG dinucleotides that is frequently
hypermethylated in GCTSCs compared to MSCs. Our
observation of a restored gene expression after a combined treatment with the demethylating agent Aza and
the histondeacetylase inhibitor PBA further confirmed
the importance of epigenetic regulatory mechanisms
within the Dlk1-Dio3 locus of GCTSCs. The fact, that
PBA alone or in combination with Aza showed the
most pronounced effects on gene expression suggests
that, in addition to the identified alterations in DNA
methylation, additional epigenetic mechanisms like histone modifications are involved in the regulation within
the Dlk1-Dio3 region in GCTs. Further, we observed
different effects of epigenetic modification on gene and
microRNA expression. While all analyzed genes within
the Dlk1-Dio3 locus responded to Aza and PBA treatment, the expression of only 2 out of 5 analyzed microRNAs was affected. In contrast to the analyzed genes,
PBA alone had no effect on microRNA expression.
These data suggest that in addition to the central role
of the differentially methylated regions IG-DMR and
Meg3-DMR additional regulatory elements must be
present. Taken together, besides silencing of specific
microRNAs we could demonstrate that further genes
located within the Dlk1-Dio3 region are downregulated
in GCTSCs compared to MSCs. We could identify a
range of CpG dinucleotides within the IG-DMR that is
frequently hypermethylated in GCTSCs and might thus
contribute to the observed gene and microRNA downregulation. Treatment with epigenetic modifiers could
restore gene and microRNA expression, but suggests
further mechanisms involved in the regulation of this
complex chromosomal region.
Lehner et al. BMC Cancer 2014, 14:495
/>
Page 8 of 10
Figure 6 Identification of a hypermethylated region within the IG-DMR of GCTSCs. Cellular DNA was extracted from GCTSCs (n = 8) and
MSCs (n = 8) and DNA fragments covering the Meg3-DMR (44 CpGs) and the IG-DMR (31 CpGs) were amplified by PCR, bisulfite treated, cloned
into pCR4-TOPO vector and sequenced. (A, B) Calculated methylation frequencies of all analyzed CpGs within the Meg3-DMR and the IG-DMR of
10 individual clones derived from one GCTSC and one MSC cell line. (C, D) Calculated methylation frequencies within the Meg3-DMR and the
IG-DMR of eight different GCTSC and MSC cell lines. (E) Methylation analysis restricted to the first 13 CpGs analyzed within the IG-DMR. Data are
presented as mean ± SD. (*p < 0.05 determined by Mann–Whitney-U test).
Conclusion
Our data suggest that epigenetic silencing of genes
and microRNAs within the Dlk1-Dio3 region is a
common event in GCTSCs that is in part mediated by
hypermethylation within the IG-DMR. However, further mechanisms seem to be involved in the regulation of this complex chromosomal region that have to
be investigated. The identified genes, microRNAs and
microRNA target genes might be involved in the neoplastic transformation of MSCs and thus represent
valuable targets for the improvement of GCT diagnosis and therapy.
Abbreviations
GCT: Giant cell tumor; GCTSC: Giant cell tumor stromal cell;
MSC: Mesenchymal stem cell; FGFR1: Fibroblast growth factor receptor3;
Dlk1: Delta-like homolog 1; Rtl1: Retrotransposon-like 1; Dio3: Iodothyronine
deiodinase 3; Meg3: Maternally expressed gene 3; Meg8: Maternally
expressed gene 8; RPL19: Ribosomal protein L19; CSFR1: Colony stimulating
factor 1 receptor; DMR: Differentially methylated region; Aza: 5-Aza-2′deoxycytidine; PBA: Phenyl butyric acid.
Competing interests
The authors declare that they have no competing interests.
Authors’ contributions
BL, PK and JF contributed in conception and design of the study. HS and
JF performed the experiments and acquired the data. PK, HS and JF
Lehner et al. BMC Cancer 2014, 14:495
/>
performed analysis and interpretation of data. BL supervised the study
and provided financial support. JF drafted and wrote the manuscript. BL,
PK and JF revised the manuscript. All authors read and approved the final
manuscript.
Acknowledgements
This work was supported by a grant from the Medical Faculty Heidelberg.
We acknowledge financial support by Deutsche Forschungsgemeinschaft
and Ruprecht-Karls-Universität Heidelberg within the funding programme
“Open Access Publishing”.
Received: 18 March 2014 Accepted: 4 July 2014
Published: 9 July 2014
References
1. Gupta R, Seethalakshmi V, Jambhekar NA, Prabhudesai S, Merchant N, Puri
A, Agarwal M: Clinicopathologic profile of 470 giant cell tumors of bone
from a cancer hospital in western India. Ann Diagn Pathol 2008,
12:239–248.
2. Wulling M, Engels C, Jesse N, Werner M, Delling G, Kaiser E: The nature of
giant cell tumor of bone. J Cancer Res Clin Oncol 2001, 127:467–474.
3. Gamberi G, Benassi MS, Bohling T, Ragazzini P, Molendini L, Sollazzo MR,
Merli M, Ferrari C, Magagnoli G, Bertoni F, Picci P: Prognostic relevance of
C-myc gene expression in giant-cell tumor of bone. J Orthop Res 1998,
16:1–7.
4. Osaka S, Toriyama M, Taira K, Sano S, Saotome K: Analysis of giant cell
tumor of bone with pulmonary metastases. Clin Orthop Relat Res 1997,
335:253–261.
5. Capanna R, Fabbri N, Bettelli G: Curettage of giant cell tumor of bone.
The effect of surgical technique and adjuvants on local recurrence rate.
Chir Organi Mov 1990, 75:206.
6. Robinson D, Segal M, Nevo Z: Giant cell tumor of bone. The role of
fibroblast growth factor 3 positive mesenchymal stem cells in its
pathogenesis. Pathobiology 2002, 70:333–342.
7. Wulling M, Delling G, Kaiser E: The origin of the neoplastic stromal cell in
giant cell tumor of bone. Hum Pathol 2003, 34:983–993.
8. Fellenberg J, Lehner B, Witte D: Silencing of the UCHL1 gene in giant cell
tumors of bone. Int J Cancer 2010, 127:1804–1812.
9. Fellenberg J, Saehr H, Lehner B, Depeweg D: A microRNA signature
differentiates between giant cell tumor derived neoplastic stromal cells
and mesenchymal stem cells. Cancer Lett 2012, 321:162–168.
10. Seitz H, Royo H, Bortolin ML, Lin SP, Ferguson-Smith AC, Cavaille J: A large
imprinted microRNA gene cluster at the mouse Dlk1-Gtl2 domain.
Genome Res 2004, 14:1741–1748.
11. Zhang L, Volinia S, Bonome T, Calin GA, Greshock J, Yang N, Liu CG,
Giannakakis A, Alexiou P, Hasegawa K, Johnstone CN, Megraw MS, Adams S,
Lassus H, Huang J, Kaur S, Liang S, Sethupathy P, Leminen A, Simossis VA,
Sandaltzopoulos R, Naomoto Y, Katsaros D, Gimotty PA, DeMichele A,
Huang Q, Butzow R, Rustgi AK, Weber BL, Birrer MJ, et al: Genomic and
epigenetic alterations deregulate microRNA expression in human
epithelial ovarian cancer. Proc Natl Acad Sci U S A 2008, 105:7004–7009.
12. Zehavi L, Avraham R, Barzilai A, Bar-Ilan D, Navon R, Sidi Y, Avni D,
Leibowitz-Amit R: Silencing of a large microRNA cluster on human
chromosome 14q32 in melanoma: biological effects of mir-376a and
mir-376c on insulin growth factor 1 receptor. Mol Cancer 2012, 11:44.
13. Haller F, von Heydebreck A, Zhang JD, Gunawan B, Langer C, Ramadori G,
Wiemann S, Sahin O: Localization- and mutation-dependent microRNA
(miRNA) expression signatures in gastrointestinal stromal tumours
(GISTs), with a cluster of co-expressed miRNAs located at 14q32.31.
J Pathol 2010, 220:71–86.
14. da Rocha ST, Edwards CA, Ito M, Ogata T, Ferguson-Smith AC: Genomic
imprinting at the mammalian Dlk1-Dio3 domain. Trends Genet 2008,
24:306–316.
15. Kagami M, Sekita Y, Nishimura G, Irie M, Kato F, Okada M, Yamamori S,
Kishimoto H, Nakayama M, Tanaka Y, Masumoto K, Utsunomiya T, Kouzan H,
Komatsu Y, Ohashi H, Kurosawa K, Kosaki K, Ferguson-Smith AC, Ishino F,
Ogata T: Deletions and epimutations affecting the human 14q32.2
imprinted region in individuals with paternal and maternal upd(14)-like
phenotypes. Nat Genet 2008, 40:237–242.
Page 9 of 10
16. Bock C, Reither S, Mikeska T, Paulsen M, Walter J, Lengauer T: BiQ Analyzer:
visualization and quality control for DNA methylation data from bisulfite
sequencing. Bioinformatics 2005, 21:4067–4068.
17. Miyoshi N, Wagatsuma H, Wakana S, Shiroishi T, Nomura M, Aisaka K, Kohda
T, Surani MA, Kaneko-Ishino T, Ishino F: Identification of an imprinted
gene, Meg3/Gtl2 and its human homologue MEG3, first mapped on
mouse distal chromosome 12 and human chromosome 14q. Genes Cells
2000, 5:211–220.
18. Zhang X, Rice K, Wang Y, Chen W, Zhong Y, Nakayama Y, Zhou Y, Klibanski
A: Maternally expressed gene 3 (MEG3) noncoding ribonucleic acid:
isoform structure, expression, and functions. Endocrinology 2010,
151:939–947.
19. Benetatos L, Hatzimichael E, Londin E, Vartholomatos G, Loher P,
Rigoutsos I, Briasoulis E: The microRNAs within the DLK1-DIO3
genomic region: involvement in disease pathogenesis. Cell Mol Life Sci
2013, 70:795–814.
20. Zhang C, Wang C, Chen X, Yang C, Li K, Wang J, Dai J, Hu Z, Zhou X, Chen
L, Zhang Y, Li Y, Qiu H, Xing J, Liang Z, Ren B, Yang C, Zen K, Zhang CY:
Expression profile of microRNAs in serum: a fingerprint for esophageal
squamous cell carcinoma. Clin Chem 2010, 56:1871–1879.
21. Ueda T, Volinia S, Okumura H, Shimizu M, Taccioli C, Rossi S, Alder H, Liu CG,
Oue N, Yasui W, Yoshida K, Sasaki H, Nomura S, Seto Y, Kaminishi M, Calin
GA, Croce CM: Relation between microRNA expression and progression
and prognosis of gastric cancer: a microRNA expression analysis. Lancet
Oncol 2010, 11:136–146.
22. Bandres E, Cubedo E, Agirre X, Malumbres R, Zarate R, Ramirez N, Abajo A,
Navarro A, Moreno I, Monzo M, Garcia-Foncillas J: Identification by
Real-time PCR of 13 mature microRNAs differentially expressed in
colorectal cancer and non-tumoral tissues. Mol Cancer 2006, 5:29.
23. Luk JM, Burchard J, Zhang C, Liu AM, Wong KF, Shek FH, Lee NP, Fan ST,
Poon RT, Ivanovska I, Philippar U, Cleary MA, Buser CA, Shaw PM, Lee CN,
Tenen DG, Dai H, Mao M: DLK1-DIO3 genomic imprinted microRNA
cluster at 14q32.2 defines a stemlike subtype of hepatocellular
carcinoma associated with poor survival. J Biol Chem 2011,
286:30706–30713.
24. Astuti D, Latif F, Wagner K, Gentle D, Cooper WN, Catchpoole D,
Grundy R, Ferguson-Smith AC, Maher ER: Epigenetic alteration at the
DLK1-GTL2 imprinted domain in human neoplasia: analysis of
neuroblastoma, phaeochromocytoma and Wilms’ tumour. Br J Cancer
2005, 92:1574–1580.
25. Cheunsuchon P, Zhou Y, Zhang X, Lee H, Chen W, Nakayama Y, Rice KA,
Tessa Hedley-Whyte E, Swearingen B, Klibanski A: Silencing of the
imprinted DLK1-MEG3 locus in human clinically nonfunctioning pituitary
adenomas. Am J Pathol 2011, 179:2120–2130.
26. Anwar SL, Krech T, Hasemeier B, Schipper E, Schweitzer N, Vogel A,
Kreipe H, Lehmann U: Loss of imprinting and allelic switching at the
DLK1-MEG3 locus in human hepatocellular carcinoma. PLoS One 2012,
7:e49462.
27. Benetatos L, Dasoula A, Hatzimichael E, Georgiou I, Syrrou M, Bourantas KL:
Promoter hypermethylation of the MEG3 (DLK1/MEG3) imprinted gene
in multiple myeloma. Clin Lymphoma Myeloma 2008, 8:171–175.
28. Zhou Y, Zhang X, Klibanski A: MEG3 noncoding RNA: a tumor suppressor.
J Mol Endocrinol 2012, 48:R45–R53.
29. Kawakami T, Chano T, Minami K, Okabe H, Okada Y, Okamoto K: Imprinted
DLK1 is a putative tumor suppressor gene and inactivated by
epimutation at the region upstream of GTL2 in human renal cell
carcinoma. Hum Mol Genet 2006, 15:821–830.
30. Liu L, Luo GZ, Yang W, Zhao X, Zheng Q, Lv Z, Li W, Wu HJ, Wang L,
Wang XJ, Zhou Q: Activation of the imprinted Dlk1-Dio3 region
correlates with pluripotency levels of mouse stem cells. J Biol Chem 2010,
285:19483–19490.
31. Stadtfeld M, Apostolou E, Akutsu H, Fukuda A, Follett P, Natesan S, Kono T,
Shioda T, Hochedlinger K: Aberrant silencing of imprinted genes on
chromosome 12qF1 in mouse induced pluripotent stem cells. Nature
2010, 465:175–181.
32. Abujiang P, Mori TJ, Takahashi T, Tanaka F, Kasyu I, Hitomi S, Hiai H: Loss of
heterozygosity (LOH) at 17q and 14q in human lung cancers. Oncogene
1998, 17:3029–3033.
33. Bando T, Kato Y, Ihara Y, Yamagishi F, Tsukada K, Isobe M: Loss of
heterozygosity of 14q32 in colorectal carcinoma. Cancer Genet Cytogenet
1999, 111:161–165.
Lehner et al. BMC Cancer 2014, 14:495
/>
Page 10 of 10
34. Ihara Y, Kato Y, Bando T, Yamagishi F, Minamimura T, Sakamoto T, Tsukada
K, Isobe M: Allelic imbalance of 14q32 in esophageal carcinoma. Cancer
Genet Cytogenet 2002, 135:177–181.
35. Kagami M, O’Sullivan MJ, Green AJ, Watabe Y, Arisaka O, Masawa N,
Matsuoka K, Fukami M, Matsubara K, Kato F, Ferguson-Smith AC, Ogata T:
The IG-DMR and the MEG3-DMR at human chromosome 14q32.2:
hierarchical interaction and distinct functional properties as imprinting
control centers. PLoS Genet 2010, 6:e1000992.
doi:10.1186/1471-2407-14-495
Cite this article as: Lehner et al.: Epigenetic silencing of genes and
microRNAs within the imprinted Dlk1-Dio3 region at human
chromosome 14.32 in giant cell tumor of bone. BMC Cancer 2014 14:495.
Submit your next manuscript to BioMed Central
and take full advantage of:
• Convenient online submission
• Thorough peer review
• No space constraints or color figure charges
• Immediate publication on acceptance
• Inclusion in PubMed, CAS, Scopus and Google Scholar
• Research which is freely available for redistribution
Submit your manuscript at
www.biomedcentral.com/submit