Analysis of short-term droughts in the mewar region of Rajasthan by standard precipitation index
Bạn đang xem bản rút gọn của tài liệu. Xem và tải ngay bản đầy đủ của tài liệu tại đây (462.23 KB, 11 trang )
Int.J.Curr.Microbiol.App.Sci (2017) 6(6): 182-192
International Journal of Current Microbiology and Applied Sciences
ISSN: 2319-7706 Volume 6 Number 6 (2017) pp. 182-192
Journal homepage:
Original Research Article
/>
Analysis of Short-Term Droughts in the Mewar Region of Rajasthan by
Standard Precipitation Index
K.A. Basamma1*, R.C. Purohit1, S.R. Bhakar1, Mahesh Kothari1, R.R. Joshi2,
Deepak Sharma3, P.K. Singh1 and H.K. Mittal1
1
Department of Soil and Water Engineering, CTAE, Udaipur - 313 001, India
2
Department of Electrical Engineering, CTAE, Udaipur-313 001, India
3
Department of RES, CTAE, Udaipur-313 001, India
*Corresponding author
ABSTRACT
Keywords
Standardized
precipitation
index, Short term,
Spatial
and temporal.
Article Info
Accepted:
04 May 2017
Available Online:
10 June 2017
Agricultural drought has become a prime concern worldwide because of its
severe effect on productivity of rain-fed crops and indirect effect on
employment as well as per capita income. These agricultural droughts
occur due to short term moisture stresses. This work was carried out to
analyze droughts in the Mewar region of Rajasthan using Standardized
Precipitation Index (SPI). SPI_1 and SPI_3 which are representatives of
short term drought are used for analysis. Its application can be related
closely to meteorological types of drought along with short-term soil
moisture and crop stresses. Efforts have been made in monitoring the
temporal and spatial extent of drought in the region. Study indicated that
region affected by short term droughts frequently in the past three decades.
Introduction
Drought is an insidious hazard of nature; it
affects more people than any other form of
natural catastrophe. It is world‟s most
expensive natural disaster causing an
estimated loss of between $6 and $8 billion
USD each year globally (Keyantash et al.,
2002). Drought manifests itself as a regional
entity rather than a local event which often
covers large areas extending across several
catchments or river basins. So the spatial
extent and temporal aspects such as a
drought‟s
persistence
are
considered
important characteristics of the drought event
(Andreadis et al., 2005; Hisdal et al., 2003)
beside the characteristics such as severity and
duration of a drought, the National
Commission on Agriculture in India defines
three
types
of
droughts
namely,
meteorological, agricultural and hydrological
droughts. Meteorological drought is defined
as a situation when there is significant
decrease from normal precipitation over an
area (i.e. more than 25 %). Agricultural
drought occurs when rain fall and soil
moisture become inadequate during the
growing season to support healthy crop
182
Int.J.Curr.Microbiol.App.Sci (2017) 6(6): 182-192
growth to maturity and causes crop stress and
wilting. Hydrological droughts occur when
meteorological droughts last for long time
eventually lead to situations like drying up of
reservoirs, lakes, streams and rivers and fall in
groundwater level (NRSC, 2008). By seeing
the changes in meteorological and
hydrological conditions influencing and
threatening the reduction of supply of some
goods and services such as energy, food and
drinking water, American Meteorological
Society (1997) introduced another drought
category called socio-economic drought
(American Meteorological Society, 1997).
preparedness plan can help the decision
makers to reduce the effect of drought. In this
context, the present study attempts to assess
agricultural drought by using Standard
Precipitation Index (SPI) and GIS techniques
for monitoring the spatio-temporal extent of
agricultural drought in Mewar region of
Rajasthan.
Materials and Methods
Study area
When we hear about Rajasthan first thing that
comes to mind is it has deserts and deserts are
formed due to low rainfall resulting in
scarcity of water. That‟s true to most extent
because out of 13 states repeatedly declared
as drought-prone, Rajasthan is the most
critical state in the country with highest
probabilities of drought occurrence and
rainfall deficiencies (Rathore, 2005). In more
recent times, Rajasthan has experienced
severe and frequent spells of droughts than
any other region in India. According to study
conducted by state control board Rajasthan is
likely to suffer from further increase in water
shortages due to overall reduction in rainfall
and increase in evapotranspiration as
consequences of global warming (Rathore et
al., 2013).
Agriculture is the immediate victim of
drought disaster – impacting crop area, crop
production and farm employment (Rathore et
al., 2014). In India more than 68% people are
directly and indirectly dependent upon
agriculture (Jain et al., 2010). About 68% in
net sown area of 140 million hectares is
vulnerable to drought conditions and about
50% of such vulnerable area is classified as
„severe‟, where frequency of drought is
almost regular. The 2002 drought reduced the
sown area to 112 million hectares from 124
million hectares. According to (Murthy et al.,
2010), the 1987 drought in India damaged
58.6 million hectares of cropped area
affecting over 285 million people. The 2002
drought reduced food grain production to 174
million tons from 212 million tons, thus
leading to a 3.2 per cent decline in
agricultural GDP. So agricultural drought
plays a major role in the economy of agrarian
countries like India, when drought occurs it
makes the land incapable of cultivation
throughout the year and this situation creates
harsh and unfriendly environmental condition
for human being, livestock population,
biomass potential and plant species (Siddiqui,
2004). So, there is an urgent need to make an
effort to monitor and mitigate drought disaster
with reference to span of time (Rathore,
2004). A well designed mitigation and
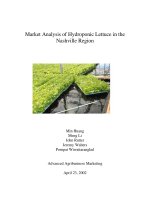
Mewar region which is selected as a Study
area is located south of the Great Indian
Desert of Rajasthan, India with total area of
34437 km2. Located between 72059‟ 32‟‟E to
750 49‟ 21‟‟ E longitude to 230 47‟ 55‟‟ N to
25 57‟ 58‟‟ N latitude and encompasses,
broadly the districts of Rajsamand, Udaipur,
Bhilwara and Chittorgarh (Fig. 1).
Climatically the region is transitional between
sub-humid in south-east to semi-arid in north,
north-west. The annual range of temperature
varies from a maximum of 23.10°C in
January and 37.43°C in May. The mean
temperatures range for January and May are
183
Int.J.Curr.Microbiol.App.Sci (2017) 6(6): 182-192
17.13°C to 34.36°C, respectively (Rathore,
2011). Rainfall in the region is characterized
by moderate amount, seasonality, limited
number of rainy days but with a larger
number of cloudy days, variability in terms of
time and space, uncertainty and unreliability
again regarding time, space and amount.
Rainfall averages 660 mm/year and is
generally higher in the southwest and lower in
the northeast of the region. Over 90% of the
rain typically falls in the period June to
September every year, during the southwest
monsoon (Rathore, 2010).
30 (Figure 1). Monthly rainfall recorded at 17
stations for 34 years (1981-2014) were
interpolated by ArcGIS 9.3, using Inverse
Distance Weighing (IDW) algorithm and
gridded monthly rainfall was created. Mean
monthly areal rainfall of region was estimated
by averaging gridded rainfall to find out the
regional representative of SPI, assessing the
regional behavior of drought characteristics.
Gridded monthly rainfall data was used for
the estimation of the SPI at each grid for each
month of the period of analysis at multiple
time scales for assessing the spatial extent of
drought characteristics in the region in terms
of percent of area affected (Manikandan et al.,
2015).
Data acquisition and Methodology
The monthly rainfall data for the period of 34
years (1981-2014) of 17 rain gauge stations
located in the Mewar was collected from the
website of Water Resource Department,
Rajasthan. Distribution of rain gauge stations
in study area is given in figure 1.
Standardized Precipitation Index (SPI)
Drought assessment involves thorough
understanding
of
variations
of
its
characteristics over time. Drought Index (DI)
is a significant indicator which assists to
assess the effect of drought and different
drought characteristics viz., Intensity,
duration, Severity and Spatial extent in terms
of numerical numbers which are believed to
be far more functional than raw data. DI helps
in sizing and quantifying drought condition.
DI gives information of drought in numerical
figures and it is most widely used drought
assessment tool besides many other tools.
Drought Indices are effective during decision
making (Hayes, 2003) in the events such as to
initiate drought relief programs, to measure
the deficits of water in water resources, to
assess drought severity etc. Various indices
were introduced by researchers, PDSI
(Palmer, 1965), Deciles (Gibbs et al., 1967),
SPI (McKee et al., 1993), PN (Willeke et al.,
1994), SWSI (Shafer et al., 1982), ADI
(Keyantash et al., 2004) and NADI (Barua,
2010).
Spatial interpolation of rainfall
Since rainfall is never evenly distributed over
the area of study due to the topographic
variability of
the
catchment
areas,
hydrologists are frequently required to
estimate point rainfall at unrecorded locations
from measurements at surrounding sites.
Optimizing rain gauge network design and
selecting an appropriate interpolation method
requires knowledge of rainfall spatial
variability. The spatial explicit data are often
obtained by geostatistical methods. Among a
large number of interpolation algorithms,
geostatistical methods are widely used.
Geostatistical methods allow the interpolation
of spatially referenced data and the prediction
of values for arbitrary points in the area of
interest (Nohegar et al., 2013). In this study,
IDW approach is used for spatial interpolation
of rainfall and drought characteristics over the
Mewar region (Mishraet al., 2005). Total area
of Mewar region is divided into grids of 30 ×
The Standardized Precipitation Index (SPI) is
developed by McKee et al.,, (1993) at
184
Int.J.Curr.Microbiol.App.Sci (2017) 6(6): 182-192
Colorado State University, US to quantify
precipitation deficits on multiple time scales.
Soil moisture conditions respond to
precipitation anomalies on a relatively short
scale.
Results and Discussion
The temporal characteristics of short term
droughts in Mewar region were analyzed
based on the regional representative of SPI
value to assess the regional drought. A
regional drought characters i.e. Drought
occurrence, most intense, severity, duration,
intensity and frequency were studied.
Regional representative of monthly SPI
values have been computed at 1-month and 3month time scales using mean monthly areal
rainfall. Use of different time scales helps to
identify different types of drought. In this
study SPI_1 and SPI_3 time series values are
used to analyze the short duration drought.
These (SPI_1 and SPI_3) SPI are useful in
monitoring
agricultural
drought
and
meteorological drought (Cacciamani et al.,
2002). 1-month SPI reflects short-term
conditions and it is a good indicator of the
deviation of precipitation from the long-term
average (Belayneh, 2012). Its application can
be related closely to meteorological types of
drought along with short-term soil moisture
and crop stress, especially during the growing
season. A 3-month SPI provides a seasonal
estimation of precipitation and it is effective
in highlighting available moisture conditions
when compared to currently available
hydrological indices (Belayneh, 2012).
Groundwater, streamflow, and reservoir
storage reflect the longer-term precipitation
anomalies. For these reasons, McKee et al.,
(1993) originally calculated the SPI for 1, 3,
6, 12, 24, and 48 month time scales. SPI is
recommended by the World Meteorological
Organization as a standard to characterize
meteorological droughts (Dutra et al., 2013).
SPI values can be categorized according to
classes (Table 1). SPI values are positive or
negative for greater or less than mean
precipitation, respectively. Procedure for
computation of SPI can be found in (Mishra
et al., 2005). In this study, an SPI program,
SPI_SL_6, developed by the National
Drought Mitigation Centre (NDMC) at the
University of Nebraska-Lincoln, was used to
compute time series of Standard Precipitation
Index.
Temporal and spatial analysis of drought
Occurrence of drought categories and
monthly distribution of occurrence of drought
categories were determined from the regional
representative of SPI series. Drought
parameters (most intense quantity of drought,
onset and end time of drought, drought
duration, drought severity and drought
frequency) were determined based on the
theory of runs proposed by (Belayneh, 2012).
Percentage of drought occurrence was
calculated by taking the ratio of drought
occurrences in each drought category to the
total drought occurrences for each grid.
Monthly distribution of occurrence of drought
categories were calculated by taking the ratio
of number of drought occurrence in each
category in each month to total number of
months over the period of analysis
(Yevjevich, 1967).
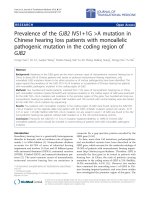
The 1-month and 3-month SPI values for
Mewar region are shown in figures 2 and 3
for periods of 1981-2014. As shown in figures
2 and 3, characteristics of drought change
with time (Manikandan et al., 2015). The time
series of monthly SPI showed that the region
experienced frequent droughts for the period
of drought analysis and detected several
severe and extreme drought events. These
droughts occur more frequently and it
assesses the effect of agricultural drought as
mentioned earlier. Analysis of the computed
SPI series for SPI_1 time scale (Figure 2)
showed that Mewar region has experienced
185
Int.J.Curr.Microbiol.App.Sci (2017) 6(6): 182-192
most extreme 1-month SPI (SPI_1=−3.83)
and the 3-month SPI (SPI_3=−2.69) was
occurred in July 2002 which were having
return period of >100 and 35 years,
respectively.
droughts in terms of severity and duration in
the middle of 1980s, start and end of 1990s
and initial years of 2000s. Greater than 30
percent of the years under study faced severe
and extreme drought in 1-month time scale.
Drought which accrued in July 2002 had
intensity of -3.83, which is the most intense
drought occurred in the study period and this
type of drought is very rare to found. 1987,
2002 and 2000 droughts had peak magnitude
of -5.2, -5.18 and -4.78 respectively. Longest
duration droughts in the study period in 1month time scale occurred in 1984 and 2002
which creped of four months had a substantial
impact on the region.
Occurrence of drought categories
Occurrence of drought categories provides
convincing answer to the question: “How
many droughts have occurred in the Mewar
region in the past?” Table 2 presents the
percentage of occurrence of drought
categories at multiple time scales in the
Mewar region. The results showed that for a
given time scale mild droughts occur most
frequently and extreme droughts occurs least
frequently. The percentage occurrence of
drought events with drought severity level of
mild to extreme drought has nearly
comparable values for all time scales. Similar
results were reported by (Manikandan et al.,
2015; Edossa et al., 2010).
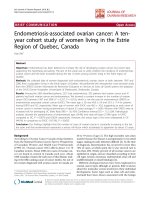
Basedon 3-month SPI values (Figure 3) years
1986-1988, 1990-1994 and 1998-2002 were
affected by severe and extreme droughts.
Years2002, 1987 and 2000 had peak
magnitude of -9.48, -9.02 and -8.62 produced
a greater impact in the region. In the Mewar
41 percent of the years under study faced
severe and extreme droughts at 3-month time
scale. As shown in figue SPI responds quickly
to wet and dry periods, which means that each
new month has a large influence on the period
sum of precipitation. This also means more
droughts of shorter duration. On the other
hand, as the time scale increases, the index
responds more slowly. In other words, as the
time scale increases, each new month has less
impact on the total, which is indicative of
fewer droughts of longer duration. The most
intense drought i.e., minimum negative of SPI
values
derived
from
the
regional
representative of SPI values over the study
period for Mewar region showed that, The
Monthly distribution of drought categories
The results of monthly distribution of
percentage of occurrence of droughts at
multiple time scales in the Mewar are
presented in table 3. From the table 3 it can be
observed that the Mewar region experienced
frequent droughts for all months of the year.
Analysis of percentage of occurrence of
drought at 1-month SPI showed that April,
May and October are the months during
which the SPI_1 values most frequently takes
the negative SPI value and it is followed by
June, August, September and July.
Table.1 Drought Classification based on SPI (McKee et al.,, 1993)
SPI Values
-0.99 to 0.99
-1 to -1.49
-1.5 to -1.99
<-2
Class
Near normal
Moderately dry
Very dry
Extremely dry
186
Int.J.Curr.Microbiol.App.Sci (2017) 6(6): 182-192
Table.2 Occurrence of drought categories (percentage) in the Mewar region
Sl.No
1
2
Month
SPI_1
SPI_3
Time Scale
Mild
Moderate
Severe
Extreme
SPI_1
26.23
2.21
0.98
1.96
SPI_3
38.24
5.39
2.70
1.96
Table.3 Monthly distributions of drought categories
Jan
0.00
4.17
Feb
0.00
4.17
Mar
0.00
4.90
Apr
8.33
4.66
May
4.17
3.68
Jun
3.92
4.41
Jul
3.43
3.43
Aug
3.68
3.43
Fig.1 Details of the study area
187
Sep
3.68
3.68
Oct
4.17
3.68
Total
31.37
48.28
Nov
0.00
3.43
Dec
0.00
4.66
Int.J.Curr.Microbiol.App.Sci (2017) 6(6): 182-192
Fig.2 Time series of SPI Values at 1-month timescale for Mewar region
Fig.3 Time series of SPI Values at 3-month timescale for Mewar region
188
Int.J.Curr.Microbiol.App.Sci (2017) 6(6): 182-192
Fig.4 Areal extent of drought categories in 1-month time scale
Fig.5 Areal extent of drought categories in 3-month time scale
Further analysis showed that SPI_1 droughts
were completely absent from November to
March in the Mewar region. Monthly
distribution of percentage of occurrence of
drought at 3-month time scale showed that the
negative SPI values occur most frequently
during March, April and December followed
by June, January and February.
189
Int.J.Curr.Microbiol.App.Sci (2017) 6(6): 182-192
frequently. More than 50% of the areas were
frequently affected by extreme and severe
droughts during study period.
Areal extent of annual drought categories
Areal extent of drought for a particular year
was computed using monthly SPI values for
each grid. In this respect, number of grids
which expressed mild, moderate, severe and
extreme drought conditions at multiple time
scales was determined for the corresponding
SPI values and plotted for the study period to
observe their areal extent (as percent of the
total area of region) Percentage of area
affected by different drought categories in
each year during 1981–2014 at multiple time
scale is given in the figures 4 and 5. For
SPI_1 greater than 50 percent of the areas
were affected by mild drought in the years
1991, 1998, 1995 and 2000. In 1987 and 2000
severe drought covered more than fifty
percent of the region. The year 2002 was
found worst year as about 98 percent of the
total area of the region was under extreme
drought condition, followed by the years 1987
and 2014 with more than 50 per cent of the
total areas of the region was affected by
extreme drought. For SPI_3, droughts in the
years 1981 followed by 1984, 1985, 1987,
1991, 1999, 1998, 1992, 1995 and 2001
distributed in more than fifty percent of the
Mewar region under moderate drought
condition. 1991, 1993, 1998 and 2002 were
affected 50 to 60 percent of the region under
severe drought condition. 1987 and 2000was
found to be the worst year, when about 75 per
cent of the total area of the region was under
extreme drought.
Abbreviations
USD - United States Dollar
GIS - Geographical Information System
IDW - Inverse Distance Weighting
DI - Drought Index
PDSI - Palmer Drought Severity Index
SPI - Standardized Precipitation Index
PN – Percent Normal
SWSI - Surface Water Supply Index
ADI - Aggregated Drought Index
NADI - Nonlinear Aggregated Drought Index
Acknowledgement
Author is thankful to Department Of Science
And Technology, Ministry Of Science And
Technology, New Delhi for financial support.
References
American Meteorological Society. 1997.
Meteorological
drought-policy
statement. Bulletin of the American
Meteorological Society, 78, 847-849.
Andreadis, K.M., Clark, E.A., Wood, A.W.,
Hamlet, A.F. and Lettenmaier, D.P.
2005. J. Hydrometeorol., 6: 985-1001.
Barua, S. 2010. Drought assessment and
forecasting using a nonlinear aggregated
drought index. Thesis submitted to
Victoria University, Australia.
Belayneh, A. 2012. Short term and long term
SPI drought forecasts using wavelet
neural networks and wavelet support
vector regression in the Awash River
Basin of Ethiopia. Thesis submitted to
Department
of
Bioresource
Engineering, MacDonald Campus of
McGill University. Canada.
Cacciamani, C., Morgillo, A., Marchesi, S.
and Pavan, V. 2007. Water Sci.
Technol. Library, 62(1): 29-48.
In conclusion, the present study attempts to
identify the spatio-temporal extent of
agricultural drought over Mewar region of
Rajasthan. SPI is used as a drought indicator
in this study and its found effective in
analyzing the short term droughts, which
cause significant impact on agriculture.
Analysis indicated that region experienced
short term droughts frequently during study
period, in which mild droughts occur more
frequently and extreme droughts occur least
190
Int.J.Curr.Microbiol.App.Sci (2017) 6(6): 182-192
Dutra, E., Giuseppe, F. Di., Wetterhall, F. and
Pappenberger, F. 2013. Hydrol. Earth
Syst. Sci., 17: 2359–2373.
Dutta, D., Kundu, A., Patel, N.R., Saha, S.K.,
Siddiqui, A.R. 2015. The Egyptian J.
Remote Sensing and Space Sci., 18; 53–
63.
Edossa, D.C., Babel, M.S. and Gupta, A.D.
2010. Water Resour. Manage, 24:
1441–1460.
Gibbs, W.J. and Maher, J.V. 1967. Rainfall
deciles as drought indicators, Bureau of
Meteorology
Bulletin
No.
4,
Commonwealth
of
Australia,
Melbourne, Australia.
Hayes, M.J. 2003. Drought Indices. National
Drought Mitigation Center. University
of Nebraska-Lincoln.
Hisdal, H. and Tallaksen, L.M. 2003. J.
Hydrol., 281(3): 230-247.
IDIC and NDMC. 1999. A Newsletter of the
International
Drought
Information
Center and the National Drought
Mitigation Center Drought network
news, 11(1): 1-23.
Jain, S.K., Keshri, R., Goswami, A., Sarkar,
A. 2010. Nat. Hazards, 54: 643– 656.
Keyantash, J. and Dracup, J.A. 2002. Bull.
American Meteorol. Soc., 83(8): 11671180.
Keyantash, J.A. and Dracup, J.A. 2004. Water
Res. Res., 40(9): 1-13.
Manikandan, M., and D. Tamilmani. 2015. J.
Inst. Eng. India. Series, 177-184.
McKee, T.B., Doesken, N.J. and Kleist, J.
1993. American meteorological society
Boston, 179–184.
Mishra, A.K. and Desai, V.R. 2005. Int. J.
River Basin Manage., 3(1): 31–41.
Mishra, A.K. and Singh, V.P. 2010. J.
Hydrol., 391(1–2): 202–216.
Murthy C.S. and Sesha Sai M.V.R. 2010,
„Agricultural Drought Monitoring and
Assesment‟. In Roy P.S, Dwivedi R.S
and Vijayan D. Eds): "Remote Sensing
Applications" (pp. 303-330. National
Remote Sensing Centre, Indian Space
Research Organization, Department of
Space, Government of India.
Nohegar, A., Heydarzadeh, M. and Malekian,
A. 2013. Desert, 18(1): 79-87.
NRSC. 2008. 'Agricultural Drought'. National
Remote Sensing Centre, Indian Space
Research Organization, Department of
Space, Government of India.
Palmer, W. 1965. Meteorological drought.
Tech. Rep., U.S. Weather Bureau,
Washington, D.C, 45, 1-58.
Rathore, B.M.S., Sud, R., Saxena, V.,
Rathore,
L.S.,
Rathore,
T.S.,
Subrahmanyam, V.G., and Roy, M.M.
2014.
Drought
Conditions
and
Management Strategies in India.
Country Report prepared for the
Regional Workshop for Asia-Pacific as
part of the UN-Water Initiative on
“Capacity Development to Support
National
Drought
Management
Policies” organized from 6-9th May
2014 in Hanoi, Vietnam, 1-7.
Rathore, M.S. 2004. State level analysis of
drought policies and impacts in
Rajasthan, India, Working paper 93,
Drought Series, Paper 6, Int. Water.
Manage. Inst.
Rathore, M.S. 2005. State level analysis of
drought policies and impacts in
Rajasthan, India. Colombo, Sri Lanka:
IWMI. 40p. Working paper 93: Drought
Series Paper, No (6).
Rathore, N.S. 2010. A Historical Perspective
of the Development of Rain Water
Harvesting Techniques in the Mewar
Region, Udaipur, Rajasthan, India.
Mountain Region of India. Conference
Proceeding;
4th
International
Conference on Water Resources and
Arid Environments 2010, Riyad,
Kingdom of Saudi Arabia, pp: 429-438.
Rathore, N.S. 2011. Int. J. Water Res. Arid
Environ., 1(4): 285-294.
191
Int.J.Curr.Microbiol.App.Sci (2017) 6(6): 182-192
Rathore, N.S. and Verma, N. 2013. Int. J.
Water Res. Arid Environ., 2(1): 45-50
Shafer, B.A., and Dezman, L.E. 1982. In
Proceedings of the western snow
conference in Reno, Nevada, USA, 50:
164-175.
Siddiqui, A.R. 2004. Regional Evaluation of
Desertification Hazards in the Aridlands
of Western Rajasthan (an unpublished
Ph. D. thesis. AMU, Aligarh, Uttar
Pradesh, India, pp. 221.
Willeke, G., Hosking, J.R., Wallis, J.R.,
Guttman, N.B. 1994. The national
drought atlas. Institute for water
resources report, 94-NDS-4.
WMO. 2012. Standardized Precipitation
Index User Guide 1-16.
Yevjevich, V. 1967. Objective approach to
definitions and investigations of
continental
hydrologic
droughts.
Hydrology Paper 23. Colorado State
University, Fort Collins, Colorado,
USA.
How to cite this article:
Basamma, K.A., R.C. Purohit, S.R. Bhakar, Mahesh Kothari, R.R. Joshi, Deepak Sharma, P.K.
Singh and Mittal, H.K. 2017. Analysis of Short-Term Droughts in the Mewar Region of
Rajasthan by Standard Precipitation Index. Int.J.Curr.Microbiol.App.Sci. 6(6): 182-192.
doi: />
192