Effects of payer status on breast cancer survival: A retrospective study
Bạn đang xem bản rút gọn của tài liệu. Xem và tải ngay bản đầy đủ của tài liệu tại đây (428.76 KB, 8 trang )
Shi et al. BMC Cancer (2015) 15:211
DOI 10.1186/s12885-015-1228-7
RESEARCH ARTICLE
Open Access
Effects of payer status on breast cancer survival:
a retrospective study
Runhua Shi1*, Hannah Taylor2, Jerry McLarty1, Lihong Liu1, Glenn Mills1 and Gary Burton1
Abstract
Background: Breast cancer outcomes are influenced by multiple factors including access to care, and payer status
is a recognized barrier to treatment access. To further define the influence of payer status on outcome, the National
Cancer Data Base data from 1998–2006 was analyzed.
Method: Data was analyzed from 976,178 female patients diagnosed with breast cancer registered in the National
Cancer Data Base. Overall survival was the primary outcome variable while payer status was the primary predictor
variable. Secondary predictor variables included stage, age, race, Charlson Comorbidity index, income, education,
distance travelled, cancer program, diagnosing/treating facility, and treatment delay. Multivariate Cox regression was
used to investigate the effect of payer status on overall survival while adjusting for secondary predictive factors.
Results: Uninsured (28.68%) and Medicaid (28.0%) patients had a higher percentage of patients presenting with
stage III and stage IV cancer at diagnosis. In multivariate analysis, after adjusting for secondary predictor variables,
payer status was a statistically significant predictor of survival. Patients with private, unknown, or Medicare status
showed a decreased risk of dying compared to uninsured, with a decrease of 36%, 22%, and 15% respectively.
However, Medicaid patients had an increased risk of 11% compared to uninsured. The direct adjusted median
overall survival was 14.92, 14.76, 14.56, 13.64, and 12.84 years for payer status of private, unknown, Medicare,
uninsured, and Medicaid respectively.
Conclusion: We observed that patients with no insurance or Medicaid were most likely to be diagnosed at stage III
and IV. Payer status showed a statistically significant relationship with overall survival. This remained true after adjusting
for other predictive factors. Patients with no insurance or Medicaid had higher mortality.
Keywords: Female breast cancer, Survival, Payer status, Insurance, Risk factors
Background
In 2014, there will be an estimated 232,670 new cases of
breast cancer and approximately 40,000 deaths in the
United States [1]. The estimated prevalence for women
living with breast cancer in the United States was
3,131,440 [2]. The median age of diagnosis for breast
cancer was 61 years [2]. The age-adjusted breast cancer
incidence rate for women was 124.6 per 100,000 [3].
While the age-adjusted incidence rate was similar between white and black women, black women had higher
mortality than white women [4].
Payer status, as well as income, education, age, and
ethnicity, may affect access to health care and influence
* Correspondence:
1
Department of Medicine & Feist-Weiller Cancer Center, LSU Health
Shreveport, 1501 Kings Hwy, Shreveport, LA 71103, USA
Full list of author information is available at the end of the article
breast cancer stage at diagnosis [5] and patient survival
[5-9]. Reduced access to healthcare has been linked to
advanced stage of cancer [5,7] and worse survival [6,7].
Lower survival rates have been found in individuals with
no insurance or Medicaid [6,7,10,11]. Lower education
attained has been associated with large tumor size and
advanced stage disease at breast cancer diagnosis [12],
however, the association with patient survival has been
mixed [13,14].
With the recent development of the Affordable Care
Act [15], there may be a shift in health insurance coverage
in the US. In the 2012 population, there were 50.90 million
(16.4%) people enrolled in Medicaid, 48.88 million (15.7%)
with Medicare, and 47.95 million (15.4%) with no insurance
[16]. As the type and availability of insurance changes, it
will be important to assess differential effects of payer status
© 2015 Shi et al.; licensee BioMed Central. This is an Open Access article distributed under the terms of the Creative
Commons Attribution License ( which permits unrestricted use, distribution, and
reproduction in any medium, provided the original work is properly credited. The Creative Commons Public Domain
Dedication waiver ( applies to the data made available in this article,
unless otherwise stated.
Shi et al. BMC Cancer (2015) 15:211
on the outcome of patient survival. This study used the
large National Cancer Data Base (NCDB) data to evaluate
how payer status, as well as secondary factors, impacts
breast cancer survival.
Secondary factors, which may also reflect access to
healthcare, include the following indicators: (1) The patient’s choice of treatment facility type (cancer program),
(2) whether they are diagnosed and treated in the same
facility (diagnosing/treating facility), (3) the distance a
patient must travel to the facility (distance travelled), (4)
the length of the delay to start treatment once diagnosed
(treatment delay), and (5) their Charlson Comorbidity
index.
Studies have demonstrated an improved prognosis for
female breast cancer patients treated in large community
hospitals compared with small community hospitals and
Health Maintenance Organization (HMO) hospitals [17].
This is supported by evidence that shows better outcomes for high-risk surgery in high-volume hospitals
[18]. Teaching hospitals, known for awareness of current
treatment methods and higher medical research involvement, have also shown an advantage over nonteaching
facilities [17,19,20]. Stage at diagnosis has been linked to
distance travelled for healthcare [21]. Differences in survival rates [22] and timely mammography for breast cancer in women [23] have been found between urban and
rural settings. A few studies have found that treatment
delay has no significant relationship with breast cancer
survival [24-26]. In contrast, one study found an 85%
increased risk of breast cancer-specific mortality for
low-income, late-stage breast cancer patients who
waited >60 days to initiate treatment compared to
those who waited <60 days [27]. More co-existing conditions or a higher Charlson Comorbidity index has also
been found to be a predictor of late stage diagnosis in
colon cancer [21] and to be associated with increased risk
of breast cancer mortality [28]. This study investigated the
effects of payer status on female breast cancer survival.
Method
This study examined 976,178 female breast cancer patients who were diagnosed between 1998 and 2006 and
followed until December 31, 2011. The data used in this
study was derived from a de-identified NCDB file. The
NCDB captures approximately 70% of all newly diagnosed cases of cancer in the United States at the institutional level [29]. The International Classification of
Disease for Oncology, third edition (ICD-O-3) codes
(C500-C506, and C508, C509) associated with a diagnosis of breast cancer were used to select patients.
The primary outcome variable, survival time of breast
cancer patients, was calculated from date of diagnosis to
date of death, date of loss to follow-up, or date of study
end (December 31, 2011). The primary predictor variable
Page 2 of 8
was payer status. Secondary predictor variables included
tumor stage, age, race, Charlson Comorbidity score, income, education, distance travelled, cancer program, diagnosing/treating facility, and treatment delay.
Payer status was categorized as uninsured, private,
Medicaid, Medicare (or other government insurance
plan), or unknown. The American Joint Committee on
Cancer (AJCC) stage was categorized as I, II, III, or IV
for stage at diagnosis. Age was grouped as 18–49, 50–
64, 65–74, or ≥75 years. Patient race was categorized as
white, black, or other. The other race category included
patients with Asian and Hispanic ethnicity. Charlson
Comorbidity [28] is an index to reflect the overall health
status of a patient. Charlson Comorbidity was categorized as 0, 1, ≥2, or unknown. Income, or median household income at zip code level, was grouped as < $30,
$30-34, $35-45, or ≥ $46 k. Education, a measure of the
percent of adults in the patient's zip code who did not
graduate from high school, was grouped as ≥29%, 2028%, 14-19%, and <14%. Education was determined
using 2000 census data. Distance travelled, the distance
from the patient’s residential zip code to a medical center, was grouped as <10, 10–24, 25–49, 50–99, or ≥100
miles. Cancer program was categorized as community,
comprehensive, academic and research, or other (other
services and clinics) cancer program. Diagnosing/treating
facility was categorized as same or different. Treatment
Delay was grouped as 0–5, 6–20, 21–30, or ≥31 days.
Chi-Square statistical tests were used to compare the
distributions of stage by payer status and other categorical variables. Kaplan-Meier methods were used to
estimate survival curves. Log rank tests were used to
compare the survival distributions in univariate analysis.
Šidák correction method was used for adjustment in
Multiple Comparisons for the Log rank Test. Multivariate Cox regression was used to simultaneously estimate
the hazard of death (Hazard Ratio) of payer status and
adjusted other factors. Direct Adjusted Median Overall
Survival (MOS) was calculated by using Multivariate
Cox regression. Statistical Software SAS 9.4 (SAS Inc.
Gary, NC) and STATA 13.1 (College Station, TX: Stata
Corp LP) were used for data management, statistical
analysis, and modeling. All p-values <0.05 were considered statistically significant.
Results
The mean age at diagnosis for all patients was 60 years,
with mean ages of 60.5, 56.5, and 54.8 years for white,
black, and other race respectively. The mean age at diagnosis was 61.5, 58.2, 58.1, and 61.8 years for stage I, II,
III, and IV respectively.
The patient’s payer status distribution by stage is
shown in Table 1. For stage, 47.96%, 37.04%, 10.37%,
and 4.62% of patients presented with stage I, II, III, and
Shi et al. BMC Cancer (2015) 15:211
Page 3 of 8
Table 1 Insurance payer status distribution by stage of female breast cancer patients
Stage
Uninsured
Private
Medicaid
Medicare
Unknown
Total
7464
259536
12546
174552
14124
468222
I
n
%
30.04
47.81
30.07
52.23
43.29
47.96
II
n
10260
211217
17492
110231
12418
361618
%
41.29
38.91
41.93
32.99
38.06
37.04
III
n
4281
53672
7826
31570
3911
101260
%
17.23
9.89
18.76
9.45
11.99
10.37
IV
n
2844
18380
3854
17829
2171
45078
%
11.45
3.39
9.24
5.34
6.65
4.62
III + IV
n
7125
72052
11680
49399
6082
146338
%
28.68
13.28
28
14.79
18.64
14.99
Total
n
24849
542805
41718
334182
32624
976178
%
2.55
55.61
4.27
34.23
3.34
100
IV diseases, respectively. For payer status, 2.55%, 55.61%,
4.27%, 34.23%, and 3.34% of patients presented with uninsured, private, Medicaid, Medicare, and unknown payer
status at diagnosis, respectively. Uninsured (28.68%) and
Medicaid (28.0%) patients had a much higher proportion
of advanced stage (stage III and IV) disease. Private
(13.28%) and Medicare (12.79%) had a lower proportion of
stage III and stage IV disease. A statistically significant difference in the presentation of advanced stage at diagnosis
was found according to payer status (p < 0.05).
A statistically significant association was also found
between stage at diagnosis and all secondary factors
(data not shown). African American patients (28.15%)
had the highest stage III and stage IV, and the percentages for white (14.06%) and other (14.47%) were much
lower. Distinct patterns appeared in the stage distributions of Charlson Comorbidity, income, and education.
As the Charlson Comorbidity increased, the percentage
of stage II, III, and IV patients increased. As income and
education level increased, the percentage of stage II, III,
and IV patients decreased.
The results of univariate analysis can be seen in
Table 2. For payer status, the MOS value for each level
was statistically different from all other levels. Medicare
payer status had the shortest MOS (MOS = 10.13 years),
followed by Medicaid (13.08), unknown (14.56), uninsured (>14.89), and private (15.00).
Overall MOS was 14.75 years. With the exception of
distance travelled and treatment delay, all secondary factors
showed an MOS value for each level that was statistically
different from all other levels. The largest differences were
found for stage, age, and Charlson Comorbidity. MOS decreased as stage, age, and Charlson Comorbidity increased.
Age ≥75 (7.14) and ≥2 Charlson Comorbidity (5.58) had
the shortest survival for their groups. Stage III and IV
(1.70) had much shorter survival compared to stage I and
II. Education and income displayed a more subtle pattern.
As the patient’s level of education and income increased,
MOS also increased.
MOS was statistically inferior for distance travelled
greater than 50 miles. Results for MOS according to
treatment delay did not follow a clear pattern. Patients
with treatment delay of 0–5 days and ≥31 days were not
statistically different from each other but differed from
the other delay groups (6–20 and 20–30 days).
Tables 1 and 2 demonstrate the need for multivariate
regression to further investigate the effect of payer status. In these analyses, many factors are statistically related to survival.
Table 3 displays the results of hazard ratio (HR) of
death from a multivariate cox regression analysis. After
adjusting for secondary factors, payer status was a significant predicator for overall survival. Private, unknown, and
Medicare payer status had a decreased risk of dying compared to uninsured, with decreases of 36% (HR = 0.64),
22% (0.78), and 15% (0.85) respectively. Patients with Medicaid insurance, however, had an 11% (1.11) increased
risk of dying as compared to uninsured patients had.
Adjusting for other factors, age, race, Charlson Comorbidity index, and stage were also significant predictors of
survival in Table 3. HR increased with increasing age. The
HR was higher for age 50–64 (1.12), 65–74 (1.66), and ≥75
(4.0) compared with age 18–49. At age ≥75, patients were
4.0 times more likely to die than those age 18–49. Compared to white patients, black patients had a 31% (1.31)
increase, and other race had a 22% (0.78) decrease. Patients
with ≥2 (2.27) and 1 (1.43) Charlson Comorbidity were
more likely to die than those with no comorbid conditions.
Corresponding to the subtle pattern in Table 2, HR decreased as both income and education increased.
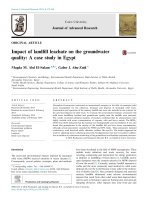
Figure 1 illustrates the Direct Adjusted MOS found for
payer status only. The Direct Adjusted MOS was 14.92,
14.76, 14.56, 13.64, and 12.84 years for private, unknown, Medicare, uninsured, and Medicaid payer status
Shi et al. BMC Cancer (2015) 15:211
Page 4 of 8
Table 2 Median overall survival (MOS)* for female breast cancer patients
Factor
Group factors
All Patients
Demographic
Age (Years)
Race
Education (%), did not graduate from high school
Clinical characteristic
Stage
Charlson Comorbidity
Access to health care
Payer Status
Income ($1000)
Distance Travelled (Miles)
Cancer Program
Level
n
MOS
Lower
Upper
976178
14.75
14.69
14.84
18-49
252080
>14.99
N/A
N/A
50-64
354102
>14.99
14.94
N/A
65-74
192042
13.59
13.48
13.73
≥75
177954
7.14
7.1
7.18
White
851863
14.77
14.71
14.86
Black
98641
13.25
13.03
13.66
Others
25674
>14.95
N/A
N/A
≥29
144440
13.5
13.35
13.74
20-28
202583
14.09
13.95
14.16
14-19
217587
14.49
14.37
14.64
<14
366118
14.92
14.9
N/A
Stage I
468222
14.99
14.92
N/A
Stage II
361618
14.78
14.69
14.94
Stage III
101260
7.81
7.7
7.91
Stage IV
45078
1.7
1.67
1.73
0
375270
10.33
10.16
N/A
1
41661
9.6
9.45
9.85
≥2
8322
5.58
5.4
5.81
Unknown
550925
14.71
14.67
14.8
Uninsured
24849
>14.89
14.06
N/A
Private
542805
15
N/A
N/A
Medicaid
41718
13.08
12.84
13.85
Medicare
334182
10.13
10.08
10.18
Unknown
32624
14.56
14.31
N/A
<30
117919
12.77
12.65
12.92
30-34
158762
13.92
13.79
14.05
35-45
256013
14.47
14.33
14.51
≥46
398086
14.92
14.9
N/A
<10
556476
14.58
14.47
14.66
10-24
234049
15
N/A
N/A
25-49
88994
14.77
14.63
N/A
50-99
39053
>14.94
14.64
N/A
≥100
22349
14.99
N/A
N/A
Community
110174
13.72
13.56
13.83
Comprehensive
563299
14.75
14.69
14.86
Academic Research
261484
>14.99
14.9
N/A
Others
41221
12.49
12.19
13.12
Diagnosing/Treating Facility
Same
662498
14.61
14.5
14.67
Different
313680
14.91
14.86
N/A
Treatment Delay (Days)
0-5
296904
14.76
14.69
14.92
6-20
284321
14.86
14.77
N/A
21-30
155774
14.84
14.67
N/A
≥31
193455
14.45
14.24
14.7
*All p-values <0.0001 by using Logrank Test. Median Overall Survival (MOS). N/A: not reached.
Shi et al. BMC Cancer (2015) 15:211
Page 5 of 8
Table 3 Hazard ratio (HR) of death and 95% confidence interval (CI) of HR* from multivariate Cox regression analysis
for female breast cancer patients
Hazard ratio, 95% CI
Lower
Upper
p-value#
1.12
1.1
1.13
<.0001
1.66
1.63
1.69
<.0001
≥75
4.00
3.93
4.07
<.0001
White
1
Black
1.31
1.29
1.33
<.0001
Others
0.78
0.75
0.8
<.0001
Group
Factor
Level
HR
Demographic
Age (Years)
18-49
1
50-64
65-74
Race
Education (%), did not graduate from high school
Clinical characteristic
Stage
Charlson Comorbidity
Access to health care
Payer Status
Income ($1000)
Distance Travelled (Miles)
Cancer Program
Diagnosing/Treating Facility
≥29
1
20-28
1
0.98
1.01
0.6894
14-19
0.96
0.95
0.98
<.0001
<14
0.89
0.88
0.91
<.0001
Stage I
1
Stage II
1.82
1.8
1.84
<.0001
Stage III
4.5
4.45
4.56
<.0001
Stage IV
15.54
15.32
15.75
<.0001
1.41
1.46
<.0001
0
1
1
1.43
≥2
2.27
2.19
2.34
<.0001
Unknown
1.24
1.22
1.25
<.0001
Uninsured
1
Private
0.64
0.62
0.65
<.0001
Medicaid
1.11
1.08
1.15
<.0001
Medicare
0.85
0.82
0.87
<.0001
Unknown
0.78
0.76
0.81
<.0001
<30
1
30-34
0.96
0.95
0.98
<.0001
35-45
0.95
0.94
0.96
<.0001
≥46
0.89
0.88
0.91
<.0001
<10
1
10-24
0.97
0.96
0.98
<.0001
25-49
0.95
0.94
0.96
<.0001
50-99
0.93
0.91
0.95
<.0001
≥100
0.9
0.87
0.93
<.0001
Community
1
Comprehensive
0.95
0.94
0.96
<.0001
Academic Research
0.90
0.89
0.92
<.0001
Others
1.08
1.05
1.11
<.0001
Same
1
Different
0.91
0.9
0.92
<.0001
Shi et al. BMC Cancer (2015) 15:211
Page 6 of 8
Table 3 Hazard ratio (HR) of death and 95% confidence interval (CI) of HR* from multivariate Cox regression analysis
for female breast cancer patients (Continued)
Treatment Delay (Days)
0-5
1
6-20
0.93
0.92
0.94
<.0001
21-30
0.90
0.89
0.92
<.0001
≥31
0.98
0.96
0.99
<.0001
*HR: Hazard Ratio of death. CI: Confidence Interval.
#p-value: Chi-test of HR is significantly different from 1 (the reference group of each factor).
For example, HR = 0.64 (0.62-0.65) for private payer status indicated that, adjusting for stage, age, race, etc. the patient with private payer status has a 36% (1–0.64 = 0.36)
lower risk of dying compared to uninsured payer status.
respectively. Patients with private insurance had a
2.1 year longer survival compared to patients with
Medicaid insurance.
Discussion
Payer status had a statistically significant relationship to
stage distribution and overall survival for female breast
cancer patients. Patients with no insurance or Medicaid
had the highest proportion at stage III and stage IV
when diagnosed (Table 1), a finding which supports the
results of another study [5]. In multivariate analysis,
adjusting for other factors including stage, payer status
was a significant predictor of overall survival. Patients
with private and unknown payer status were less likely
to die than uninsured and Medicaid patients. Private patients had a Direct Adjusted MOS over 1.3 and 2.1 years
longer than uninsured and Medicaid patients respectively (Figure 1). Our findings support other studies that
show higher stage at diagnosis [5] and worse survival
for patients with no insurance or Medicaid [6,7,10,11].
Higher stage at diagnosis and lower survival in these
populations might be explained by lower access to preventive screening and high-quality care. Further research
Figure 1 Direct adjusted survivor functions for payer status.
Direct adjusted median overall survival (MOS) was 14.9, 14.8, 14.6,
13.6, and 12.8 years for private, unknown, Medicare, uninsured,
and Medicaid respectively.
is needed to investigate the barriers for these populations and to develop targeted interventions.
In the multivariate analysis, the secondary significant
predictors of survival were age, race, Charlson Comorbidity index, and stage. Patient’s age ≥75 were 4.00 times
more likely to die than patients 18–49. As expected,
older patients have a higher risk because of the aging
process. African American patients had the highest mortality when compared to white patients. This was consistent with literature demonstrating lower survival in
African American patients [9,30,31]. Patients with ≥2
Charlson Comorbidity were 2.27 times more likely to die
than those with no comorbid conditions. Another study
indicated an association of one unit of change of Charlson
Index with a 2.3-fold increase in the 10-year mortality in
breast cancer patients [28]. As a measure of overall health
status, a higher risk of dying is expected with a higher
Charlson Index.
In this study, the HR estimation for various factors
was more reliable, with a narrow 95% confidence interval, because so many patients were studied. However,
because of this, the reader must differentiate between
statistical and clinical significance when interpreting the
results. Although all categories in the multivariate analysis were statistically significant, not all HR changes
would be clinically important. For example, with an HR
of 0.96, some factors were statistically significant even
though there was only a risk reduction of 4%.
This study investigated how a patient’s access to health
care can impact survival. The level of patient adherence
to National Comprehensive Cancer Network treatment
guidelines was not studied here, but could also be an important factor. Addressing patient adherence in future
research might provide a more complete understanding
of the influence of treatment characteristics.
Another issue was the information collected from the
NCDB. The database did not collect Charlson Comorbidity information consistently before 2003. The reference group (0 Charlson Comorbidity) for 2003–2006
was used to estimate the Charlson Comorbidity effect
for patients diagnosed before 2003 (coded as unknown
Charlson Comorbidity). This estimate may only represent an average of all Charlson Comorbidity conditions
Shi et al. BMC Cancer (2015) 15:211
in the earlier group. The NCDB also did not collect
cause-specific death information. We assessed the effect
of payer status on overall survival instead of causespecific survival. Measuring the effect on cause-specific
survival may produce different results. Additionally, education and income by zip-code was collected instead of
individual education and income. Using individual education and income level would strengthen the analysis of
these factors. The NCDB, a large retrospective national
database, may also be sensitive to bias in patient selection and variation in institution reporting [32].
Conclusion
We observed that uninsured and Medicaid patients were
most likely to be diagnosed at stage III and stage IV.
Payer status, our primary focus, showed a statistically
significant relationship with overall survival. This remained
true after adjusting for secondary predictive factors. Patients with no insurance or Medicaid had higher mortality
than private, Medicare, unknown insurance. Further research is needed to investigate patient treatment adherence
and cause-specific survival.
Ethics statement
With the support from the Chair of Louisiana State University Hospital in Shreveport (currently University Health
Shreveport) Cancer program, the corresponding author
has applied and has been awarded the National Cancer
Data Base (NCDB) Participant Use Data File (PUF) for
1998 to 2011 from the Commission on Cancer (CoC).
The PUF is a Health Insurance Portability and Accountability Act (HIPAA) compliant data file containing cases
submitted to the Commission on Cancer’s (CoC) National
Cancer Data Base (NCDB). The PUF contains deidentified patient level data that do not identify hospitals, healthcare providers, or patients as agreed to in the
Business Associate Agreement that each CoC-accredited
program has signed with the American College of Surgeons. The PUFs are designed to provide investigators associated with CoC-accredited cancer programs with a data
resource they can use to review and advance the quality of
care delivered to cancer patients through analyses of cases
reported to the NCDB. NCDB PUFs are only available
through an application process to investigators associated
with CoC-accredited cancer programs.
Abbreviations
HMO: Health Maintenance Organization; NCDB: National Cancer Data Base;
AJCC: American Joint Committee on Cancer; MOS: Median overall survival;
HR: Hazard ratio.
Competing interests
The authors declare that they have no competing interests.
Authors’ contributions
RS designed the study, obtained the dataset, performed all data
management, carried out the statistical data analysis, and drafted the
Page 7 of 8
manuscript. HT assisted with drafting the manuscript. JM, LL, GM, and GB
participated in the design of the study and drafted the manuscript. All
authors read and approved the final manuscript.
Acknowledgements
The authors wish to acknowledge the Commission on Cancer of the
American College of Surgeons and the American Cancer Society for making
public data available through the NCDB. The data used in this study were
derived from a de-identified NCDB file. The American College of Surgeons
and the Commission on Cancer have not verified and are not responsible for
the analytic or statistical methodology employed or the conclusions drawn
from these data by the investigator. The authors also wish to thank Mrs. Thu
Vu for her assistance in the preparation of the manuscript.
Author details
1
Department of Medicine & Feist-Weiller Cancer Center, LSU Health
Shreveport, 1501 Kings Hwy, Shreveport, LA 71103, USA. 2Feist-Weiller Cancer
Center, LSU Health Shreveport, 1501 Kings Hwy, Shreveport, LA 71103, USA.
Received: 29 July 2014 Accepted: 19 March 2015
References
1. Breast Cancer. [ />2. Society. AC. Cancer Treatment and Survivorship Facts & Figures 2014–2015.
Atlanta, Georgia: American Cancer Society; 2014. p. 1. Figure 1.
3. SEER Cancer Statistics Review 1975–2011 [ />1975_2011/browse_csr.php?sectionSEL=4&pageSEL=sect_04_table.05.html]
4. SEER Cancer Statistics Review 1975–2011 [ />1975_2011/browse_csr.php?sectionSEL=4&pageSEL=sect_04_table.12.html]
5. Farkas DT, Greenbaum A, Singhal V, Cosgrove JM. Effect of Insurance Status
on the Stage of Breast and Colorectal Cancers in a Safety-Net Hospital.
J Oncol Pract. 2012;8(3S):16s–21s.
6. Shi R, Mills G, McLarty J, Burton G, Shi Z, Glass J. Commercial insurance
triples chances of breast cancer survival in a public hospital. Breast J.
2013;19(6):664–7.
7. Ward E, Halpern M, Schrag N, Cokkinides V, DeSantis C, Bandi P, et al.
Association of insurance with cancer care utilization and outcomes. CA
Cancer J Clin. 2008;58(1):9–31.
8. Halpern MT, Bian J, Ward EM, Schrag NM, Chen AY. Insurance status and
stage of cancer at diagnosis among women with breast cancer. Cancer.
2007;110(2):403–11.
9. Newman LA, Mason J, Cote D, Vin Y, Carolin K, Bouwman D, et al. AfricanAmerican ethnicity, socioeconomic status, and breast cancer survival: a
meta-analysis of 14 studies involving over 10,000 African-American and
40,000 White American patients with carcinoma of the breast. Cancer.
2002;94(11):2844–54.
10. Sabik LM, Bradley CJ. Differences in mortality for surgical cancer patients by
insurance and hospital safety net status. Med Care Res Rev. 2013;70(1):84–97.
11. Niu X, Roche LM, Pawlish KS, Henry KA. Cancer survival disparities by health
insurance status. Cancer Med. 2013;2(3):403–11.
12. DeSantis C, Jemal A, Ward E. Disparities in breast cancer prognostic factors
by race, insurance status, and education. Cancer Cause Control.
2010;21(9):1445–50.
13. Albano JD, Ward E, Jemal A, Anderson R, Cokkinides VE, Murray T, et al.
Cancer mortality in the united states by education level and race. J Natl
Cancer Inst. 2007;99(18):1384–94.
14. Shariff-Marco S, Yang J, John EM, Sangaramoorthy M, Hertz A, Koo J, et al.
Impact of Neighborhood and Individual Socioeconomic Status on Survival
after Breast Cancer Varies by Race/Ethnicity: The Neighborhood and Breast
Cancer Study. Cancer Epidem Biomar. 2014;23(5):793–811.
15. Patient Protection and Affordable Care Act, 42 U.S.C. § 18001 et seq. (2010).
/>16. DeNavas-Walt, Carmen, Bernadette D. Proctor, and Jessica C. Smith, U.S.
Census Bureau, Current Population Reports, P60-245, Income, Poverty, and
Health Insurance Coverage in the United States: 2012, U.S. Government
Printing Office, Washington, DC, 2013. />2013pubs/p60-245.pdf
17. Lee-Feldstein A, Anton-Culver H, Feldstein PJ. Treatment differences and
other prognostic factors related to breast cancer survival. Delivery systems
and medical outcomes. JAMA. 1994;271(15):1163–8.
Shi et al. BMC Cancer (2015) 15:211
Page 8 of 8
18. Council. IoMaNR. Ensuring Quality Cancer Care. Washington, DC: The
National Academies Press; 1999.
19. Chaudhry R, Goel V, Sawka C. Breast cancer survival by teaching status of
the initial treating hospital. CMAJ. 2001;164(2):183–8.
20. Hartz AJ, Krakauer H, Kuhn EM, Young M, Jacobsen SJ, Gay G, et al. Hospital
characteristics and mortality rates. N Engl J Med. 1989;321(25):1720–5.
21. Massarweh NN, Chiang YJ, Xing Y, Chang GJ, Haynes AB, You YN, et al.
Association Between Travel Distance and Metastatic Disease at Diagnosis
Among Patients With Colon Cancer. J Clin Oncol. 2014;32(9):942 − +.
22. Klein J, Ji M, Rea NK, Stoodt G. Differences in male breast cancer stage,
tumor size at diagnosis, and survival rate between metropolitan and
nonmetropolitan regions. Am J Men's Health. 2011;5(5):430–7.
23. Doescher MP, Jackson JE. Trends in cervical and breast cancer screening
practices among women in rural and urban areas of the United States.
J Public Health Manage Pract. 2009;15(3):200–9.
24. Delgado DJ, Lin WY, Coffey M. The role of Hispanic race/ethnicity and
poverty in breast cancer survival. P R Health Sci J. 1995;14(2):103–16.
25. Redondo M, Rodrigo I, Pereda T, Funez R, Acebal M, Perea-Milla E, et al.
Prognostic implications of emergency admission and delays in patients with
breast cancer. Support Care Cancer. 2009;17(5):595–9.
26. Smith ER, Adams SA, Das IP, Bottai M, Fulton J, Hebert JR. Breast cancer
survival among economically disadvantaged women: The influences of
delayed diagnosis and treatment on mortality. Cancer Epidem Biomar.
2008;17(10):2882–90.
27. McLaughlin JM, Anderson RT, Ferketich AK, Seiber EE, Balkrishnan R, Paskett
ED. Effect on survival of longer intervals between confirmed diagnosis and
treatment initiation among low-income women with breast cancer. J Clin
Oncol. 2012;30(36):4493–500.
28. Charlson ME, Pompei P, Ales KL, Mackenzie CR. A NEW METHOD OF
CLASSIFYING PROGNOSTIC CO-MORBIDITY IN LONGITUDINAL-STUDIES - DEVELOPMENT AND VALIDATION. J Chronic Dis. 1987;40(5):373–83.
29. National Cancer Data Base [ />30. Simon MS, Banerjee M, Crossley-May H, Vigneau FD, Noone AM, Schwartz K.
Racial differences in breast cancer survival in the Detroit Metropolitan area.
Breast Cancer Res Treat. 2006;97(2):149–55.
31. Albain KS, Unger JM, Crowley JJ, Coltman Jr CA, Hershman DL. Racial
disparities in cancer survival among randomized clinical trials patients of the
Southwest Oncology Group. J Natl Cancer Inst. 2009;101(14):984–92.
32. Rueth NM, Lin HY, Bedrosian I, Shaitelman SF, Ueno NT, Shen Y, et al.
Underuse of trimodality treatment affects survival for patients with
inflammatory breast cancer: an analysis of treatment and survival trends
from the national cancer database. J Clin Oncol. 2014;32(19):2018–24.
Submit your next manuscript to BioMed Central
and take full advantage of:
• Convenient online submission
• Thorough peer review
• No space constraints or color figure charges
• Immediate publication on acceptance
• Inclusion in PubMed, CAS, Scopus and Google Scholar
• Research which is freely available for redistribution
Submit your manuscript at
www.biomedcentral.com/submit