Space-time clusters of breast cancer using residential histories: A Danish case–control study
Bạn đang xem bản rút gọn của tài liệu. Xem và tải ngay bản đầy đủ của tài liệu tại đây (7.35 MB, 12 trang )
Nordsborg et al. BMC Cancer 2014, 14:255
/>
RESEARCH ARTICLE
Open Access
Space-time clusters of breast cancer using
residential histories: A Danish case–control study
Rikke Baastrup Nordsborg1,2*, Jaymie R Meliker3, Annette Kjær Ersbøll2, Geoffrey M Jacquez4,5, Aslak Harbo Poulsen1
and Ole Raaschou-Nielsen1
Abstract
Background: A large proportion of breast cancer cases are thought related to environmental factors. Identification
of specific geographical areas with high risk (clusters) may give clues to potential environmental risk factors. The
aim of this study was to investigate whether clusters of breast cancer existed in space and time in Denmark, using
33 years of residential histories.
Methods: We conducted a population-based case–control study of 3138 female cases from the Danish Cancer Registry,
diagnosed with breast cancer in 2003 and two independent control groups of 3138 women each, randomly selected
from the Civil Registration System. Residential addresses of cases and controls from 1971 to 2003 were collected from
the Civil Registration System and geo-coded. Q-statistics were used to identify space-time clusters of breast cancer. All
analyses were carried out with both control groups, and for 66% of the study population we also conducted analyses
adjusted for individual reproductive factors and area-level socioeconomic indicators.
Results: In the crude analyses a cluster in the northern suburbs of Copenhagen was consistently found throughout the
study period (1971–2003) with both control groups. When analyses were adjusted for individual reproductive factors and
area-level socioeconomic indicators, the cluster area became smaller and less evident.
Conclusions: The breast cancer cluster area that persisted after adjustment might be explained by factors that were not
accounted for such as alcohol consumption and use of hormone replacement therapy. However, we cannot exclude
environmental pollutants as a contributing cause, but no pollutants specific to this area seem obvious.
Keywords: Space-time cluster analysis, Breast cancer, Residential histories, Q-statistics, Denmark
Background
With more than one million new cases each year, breast
cancer is the most common cancer among women,
accounting for one-fifth of all new female cancer cases
worldwide [1]. The industrialised parts of the World have
experienced a fast increase in breast cancer incidence
during the last decades and still have high incidence rates.
Low rates, on the other hand, are found in most Asian
and African countries; although incidence rates are also
rapidly increasing in these areas [2]. In Denmark the age
standardised incidence rate (world standard population)
doubled from 46.1 per 100.000 person-years in 1960 to
102.5 in 2010 [3].
* Correspondence:
1
Danish Cancer Society Research Center, Copenhagen, Denmark
2
National Institute of Public Health, University of Southern Denmark,
Copenhagen, Denmark
Full list of author information is available at the end of the article
The majority of the established breast cancer risk
factors are related to oestrogens. Early menarche and
late menopause increase the risk, while reproductive
factors such as many child births and young age at first
birth reduce the risk. Hormone replacement therapy (HRT)
for menopause, ionising radiation, alcohol intake, night
shift work and some specific genetic mutations are also
established risk factors [4-9]. Further, high socioeconomic
status is associated with increased risk [10].
Migrant studies of breast cancer found that women,
who migrate from areas of low risk to areas of high risk,
adopt the higher risk in the host country within a few
generations [11,12], and a large study of Scandinavian
twins estimated that only 27% of the breast cancer
risk was explained by heritable factors [13]. Therefore
environmental factors are thought to play a substantial
role in the development of breast cancer. Further, a study
© 2014 Nordsborg et al.; licensee BioMed Central Ltd. This is an Open Access article distributed under the terms of the
Creative Commons Attribution License ( which permits unrestricted use,
distribution, and reproduction in any medium, provided the original work is properly credited. The Creative Commons Public
Domain Dedication waiver ( applies to the data made available in this
article, unless otherwise stated.
Nordsborg et al. BMC Cancer 2014, 14:255
/>
in the USA estimated that only 41% of the US breast
cancer cases were attributable to established risk factors
(late age at first birth, nulliparity, family history of breast
cancer and high socioeconomic status) [14], leaving
the majority of cases unexplained. Persistent organic
pollutants such as PCB (polychlorinated biphenyl) and
DDT (dichlorodiphenyltrichloroethane) have frequently
been studied as environmental risk factors for breast cancer,
while the effect of cadmium, electromagnetic fields and
solar radiation has been examined to a lesser extent; however, the majority of the studies do not find associations
with breast cancer [6,15]. A number of previous studies
have used disease mapping and spatial analyses in the
search for environmental factors that could be related to
breast cancer, however many of these studies relied on
aggregated data and used space-only approaches by only
including one location to record health events e.g. place of
residence at date of diagnosis or date of death [16,17].
However, chronic diseases such as cancer develop over long
time, thus causative exposure could occur many years prior
to disease manifestation and during that time, individuals
may have moved to new addresses several times. Therefore,
it is crucial to take human mobility into account in the
search for cancer clusters. A study in Western New York
applied cluster analyses at selected points in time over
the life-course of the study population and identified clustering of breast cancer cases based on place of residence at
time of birth and at menarche [18,19]. Whereas, a recent
study continuously analyzed breast cancer risk through
space and time and found a cluster of breast cancer near a
military reservation on Upper Cape Cod, Massachusetts in
the 1940s and 1950s [20]. However, only few spatial analyses have led to new hypotheses about environmental risk
factors related to breast cancer, perhaps because the majority of the studies neglect human mobility. The aim of this
large population-based exploratory study was to investigate
if clusters of breast cancer existed in space and time in
Denmark, using 33 years of residential histories and
accounting for reproductive and socioeconomic factors.
Page 2 of 12
to the 7th Revision of the International Classification of
Diseases. Only primary cancers were included, however
previous diagnoses of non-melanoma skin cancer were
allowed. The study included 3138 cases in total.
Controls
Female controls were randomly selected from the
Danish Civil Registration System [22] using incidence
density sampling and individually matched with cases by
date of birth. Further, controls were alive, living in
Denmark and with no previous cancer diagnosis (except
from non-melanoma skin cancer) at the date of diagnosis
of the matched case. We selected two independent control
groups with 3138 women in each group. The selection
was carried out with replacement. The purpose of this
design was to investigate whether we were able to
replicate our findings based on one control group with a
second independent group of controls.
Residential histories
The Danish Data Protection Agency (2007-41-0437)
approved the study. In accordance with Danish law
written consent was not obtained as the study was
entirely register-based and did not involve biological
samples from, or contact with study participants.
We used the unique personal identification numbers of
cases and controls to trace residential histories from
1971 to date of diagnosis of cases and index date of their
matched controls by record linkage with the Danish
Civil Registration System. Recording of residential data
in the civil registration system was not complete before
1971; hence this year was used as the cut-off point. We
identified 45,916 unique addresses, each with a unique
identification number composed of a municipality code,
a road code, and a house number. The dates of moving
in and leaving each residence were registered. The
addresses were then linked to a register of all official
addresses in Denmark, resulting in geographical coordinates
for 45,404 of the residential addresses, and missing
coordinates for the last 512 (1%) addresses. In the
geocoding procedure, 86% of the addresses of both
cases and controls matched to the exact house. Four
percent matched to one of the neighbouring houses,
2% matched to the centre of the road, and 7%
matched at the municipality level, which means that
centroid coordinates of the municipality were assigned
to these addresses. Equal proportions of addresses of
cases and controls were geocoded in each of these
categories. The ages of cases and their matched controls
were calculated at the beginning and end of each residence,
which enabled us to use different time scales in the
spatio-temporal cluster analyses [23].
Cases
Covariates
Female breast cancer cases were identified in the virtually
complete population-based Danish Cancer Registry, to
which it has been mandatory to report all new cancer
diagnoses since 1987 [21]. We included all women
diagnosed in 2003 with diagnosis code 170 according
We obtained reproductive data for all cases and controls
born in 1935 and onwards using record linkage of the
personal identification numbers of cases and controls to
the Medical Birth Register [24] and the Danish Family
Relations Database, which is based on kinship links
Methods
Ethics statement
Nordsborg et al. BMC Cancer 2014, 14:255
/>
Page 3 of 12
between all persons registered in the Danish Civil
Registration System [25]. The maternal linkage in the
Danish Civil Registration System is considered complete
and correct for women born in 1935 and later. Thus,
reproductive data were not available for one-third of the
study population (1060 cases and 2 sets of 1060 controls)
as they were born before 1935. The reproductive data
included information on number of live births and age at
first live birth. Only children born before date of diagnosis
of cases and index date of their matched controls were
considered. If there was no information on children in the
registers, the women (born in 1935 and onwards) were
regarded nulliparous.
From Statistics Denmark we obtained information
on socioeconomic indicators aggregated in a 100
meter x 100 meter grid cell net covering all addresses in
Denmark. Cells contained average values on income and
education in 2008 for a minimum of 100 households at
the time. The income variable was based on the yearly
disposable household income, while the educational level
was based on the person with the highest education in
each household. These area-level aggregated measures of
income and education were linked with cases and controls
based on their most recent residential address.
Q-statistics
We used Q-statistics in the software called SpaceStat
(BioMedware Inc., Ann Arbor, MI) to investigate potential
space-time clusters of breast cancer. The method has been
extensively described in previous studies [23,26,27]. Briefly,
this novel approach takes all locations over the entire
life-course into account in the cluster analysis. The
spatial and temporal local case–control cluster statistic is
given in Equation 1:
ðk Þ
Qi;t ¼ ci
k
X
j¼1
ðk Þ
ηi;j;t cj
ð1Þ
Where for individuals i and j, ci and cj are defined to
ðk Þ
be 1 if and only if a case, and 0 otherwise. The term ηi;j;t is
a binary spatial proximity metric that is 1 when participant
j is a k nearest neighbour at time t of participant i;
otherwise it is 0. Qði;tk Þ can take on a range of values
from 0 to k based on the fact that an individual can
have up to k unique nearest neighbours. This statistic
is recalculated for each case every time there is a
change in place of residence. In the present study we
also calculated Qiðk Þ , which is the sum of each individual’s
Qi;tðk Þ values. This statistic identifies which individuals tend
to be centers of clusters over their life-course, while Qði;tk Þ
determines when and where an individual is a center of a
local cluster. We used these two measures in combination
to identify when individuals with significant clustering
over their life-course co-occurred in space and time. The
value of k is specified by the user; however there is no
standard method to determine the optimal value of k.
The statistical significance of the Q-statistics was determined by randomly assigning the case–control status to
the residential histories under the null hypothesis of no
association between places of residence and case–control
status. Monte Carlo simulations were used to generate the
distributions for hypothesis testing, and the randomization
procedure was repeated over 999 iterations, resulting in a
minimum p-value of 0.001.
For simplicity, we leave out the superscript (k) in the
reminder of the paper, but it is understood that the value
of the statistic depends on the specification of k. Thus
Qi;tðk Þ (the local statistic) is written Qit and Qiðk Þ (the subject
specific life-course statistic) is written Qi.
Recently, our group conducted a simulation study to
evaluate the performance of Q-statistics given the propensity for multiple testing and to explore the sensitivity of results to the choice of k nearest neighbours [27]. Based on a
Danish case–control dataset of similar size as the present
study, the simulation study indicated that a k of 15 performed well and served as a good starting point. It was also
found that a cluster could be further evaluated as a possible
true cluster if four or more significant cases were detected
in the same area with a Qi p = 0.001 and Qit p ≤ 0.05 [27].
We used these guidelines in the present study, and performed the first set of analyses with k = 15. Subsequently,
more analyses were carried out with k = 25, 35, 50, and 100.
Adjustment for covariates
To account for geographical variations in known breast
cancer risk factors that may cause clusters, we performed a
conditional logistic regression analysis to obtain risk estimates for the association between reproductive and socioeconomic factors and risk of breast cancer. Based on
existing knowledge on breast cancer risk factors and data
availability we included child birth (ever/never), age at first
child birth (continuous), number of children (continuous),
area income (continuous) and area education level (continuous) in the model. The risk estimates were then converted into probabilities that a location would be assigned
case status as a function of the reproductive and socioeconomic factors. These probabilities were used for adjustment
in the spatio-temporal analyses [28]. Consequently, clusters
identified in the adjusted analysis would not be attributable
to geographical variation in the modelled risk factors.
Analyses
We ran both unadjusted and adjusted analyses and all
analyses were conducted twice, first with control group
1 and then with control group 2. Calendar year and age
Nordsborg et al. BMC Cancer 2014, 14:255
/>
were applied as two different underlying time scales.
Finally, we analyzed data with the two control groups
combined in a 1:2 individually matched design. We
repeated selected analyses of potential clusters in
SaTScan (version 9.1.1) [28,29]. These analyses were
conducted on subsets of the original space-time data,
with only one location per individual representing time
periods with statistically significant clusters identified by
Q-statistics. We used a Bernoulli model in SaTScan, and
the p-value for test of significance was obtained from
Monte Carlo simulations (999 replications). We analysed
elliptical clusters with a maximum cluster size of 15% of
the total population and with the option “No Cluster
Centers in Other Clusters”.
For clusters that were consistently found across both
control groups and in several analyses, we calculated the
relative risk of breast cancer associated with a residential
history (minimum 5 years) inside the cluster area.
Further, we examined if age and extent of tumour at
date of diagnosis were different for cases living inside
versus outside the cluster areas.
Results
The study included 3138 cases of breast cancer and two
independent control groups with 3138 controls in each.
The average age at diagnosis for cases was 63 years,
and both cases and controls lived at 4.8 addresses, on
average, during the period 1971–2003. Reproductive
and socioeconomic data were available for 2078 of
the cases and 4155 of the controls corresponding to
Page 4 of 12
66% of the study population; descriptive statistics are
summarized in Table 1. The statistics in Table 1 indicate
that breast cancer cases had fewer children, were slightly
older when they had their first child and that they were
living in areas with higher socioeconomic status.
Space-time clusters
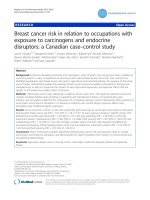
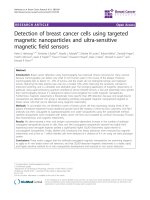
Figure 1a shows an overview map of the Danish municipalities, with two boxes indicating areas where clusters
were detected: the Odense area (Figure 1b) and the
Copenhagen area (the capital of Denmark Figure 1c).
Further; these maps show the density (number of
addresses per square kilometre) of the study population in
each of the 98 Danish municipalities. Overall, clusters
were detected in three different areas of Denmark:
northern Copenhagen, Odense and Høje Taastrup
(south-west of Copenhagen), however; results differed
depending on control group, choice of k, size of study
population and adjustment for covariates.
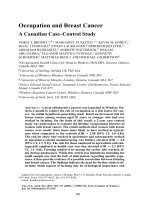
Figure 2 shows statistically significant breast cancer
clusters identified by unadjusted space-time cluster
analyses (Q-statistics) using k = 25 (Figure 2a) and k = 100
(Figure 2b) and with calendar year as time scale. With
k = 25 both control groups and the combined group
detected a small cluster north of Copenhagen during
the 1980s and 1990s (Figure 2a). Further, control
group 1 indentified a cluster north of Copenhagen
persisting throughout the study period and a short-term
cluster in the city of Copenhagen (red areas in Figure 2a).
The second and the combined control groups found a
Table 1 Descriptive statistics of breast cancer cases and matched controls by factors used for adjustment
Descriptive statistics
Cases
Controls
Full data set
3138
6276
Women with missing data on adjustment variables
1060
2121
Women with data on adjustment variables
2078
4155
62.6 (41.5 - 85.9)
62.6 (41.5 - 85.9)
Age at diagnosis/index datea
Adjustment variables
p-value
Child birth yes/no
1838/240 (88%/12%)
3734 / 421 (90%/10%)
0.01e
Number of children
a,b
Age at first child birth
0
240 (12%)
421 (10%%)
-
1
328 (16%)
623 (15%)
-
2
953 (46%)
1910 (46%)
-
≥3
557 (27%)
1201 (29%)
-
24.1 (18.6 - 33.5)
23.6 (18.3 - 32.7)
0.0004e
6.5 (1–31)
5.9 (1–28.2)
0.007e
4.9 (2.9 - 7.6)
4.8 (2.8 - 7.4)
0.052e
a,c
Area-level education
Area-level income in 100.000 DKKa
a
Numbers are medians (5% - 95% percentiles).
Among parous women.
c
Percentage of households in the area having the highest possible educational level.
DKK: the Danish currency.
d
Univariate χ2-test of categorical variable.
e
Univariate Wilcoxon test of linear variables.
b
0.09d
Nordsborg et al. BMC Cancer 2014, 14:255
/>
Page 5 of 12
Figure 1 Overview map of the study area. 1a shows the 98 municipalities of Denmark with two boxes indicating areas where clusters were
detected. 1b shows an enlargement of the Odense area. 1c shows an enlargement of the Copenhagen area with names of the municipalities
referred to in the text. The colours indicate for each municipality the density (number of addresses per square kilometre) of geo-coded residential
addresses included in the study. The maps contain data from the Danish Geodata Agency.
cluster in Odense lasting for about 15 years (blue and
yellow areas in Figure 2a). When k was increased to
100 both control groups and the combined control
group found a larger cluster area with up to 50 cases
north of Copenhagen persisting for the whole study
period (Figure 2b). Another cluster was identified in
the Høje Taastrup area; however only when control
group 2 was used (blue area in Figure 2b).
With age as the underlying time scale, application of
each of the control groups identified clusters in the area
north of Copenhagen at several levels of k, also when
the control groups were combined. The cluster areas
existed when participants were in their 40s to 60s and in
the same area (results not shown) as detected when
calendar year was applied.
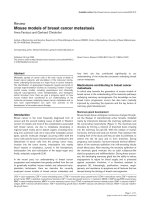
Figure 3 shows results of confirmatory analyses
performed with SaTScan at two selected points in
time 1987 (Figure 3a) and 1997 (Figure 3b) and with
each control group and groups combined. In 1987
borderline significant clusters with more than 100
cases covering Copenhagen and its northern suburbs
were identified by SaTScan by each control group
(red and blue area in Figure 3a). When groups were
combined the cluster became statistically significant
(yellow area in Figure 3a). The combined control
group also yielded a statistically significant cluster in
Odense (yellow area in Figure 3a). In 1997 control
group 1 and the combined group identified a large
and statistically significant cluster in the northern
Copenhagen area (red and yellow areas in Figure 3b),
while control group 2 identified a cluster in Odense
(blue area in Figure 3b). Additional analyses with
each of the control groups and the combined group
confirmed the cluster area north of Copenhagen in
1977 and at age 50 (results not shown).
Figure 4 shows results of the unadjusted (Figure 4a)
and adjusted (Figure 4b) space-time cluster analyses. In
the unadjusted analyses both control groups and the
combined group detected time persistent clusters of
varying size north of Copenhagen (Figure 4a). Additionally,
Nordsborg et al. BMC Cancer 2014, 14:255
/>
Page 6 of 12
Figure 2 Results of unadjusted space-time cluster analyses performed in SpaceStat. Analyses were carried out with 999 permutations,
k =25 and 100. 2a shows cluster areas detected at k = 25 in the Odense (inserted map) and Copenhagen areas with each of the two control groups as
well as when control groups were combined. 2b shows cluster areas detected at k = 100 with each of the two control groups and the combined
control group. The cluster areas presented in the figures illustrate the maximum extent of the cluster areas based on the location of significant cases,
and the colours of the areas indicate the control group used. This presentation of results secures the anonymity of the study participants (in contrast
to presenting the actual address points on the maps). For each cluster area the text box show how many cases it comprised and its temporal extent.
CG: Control Group. The maps contain data from the Danish Geodata Agency and © OpenStreetMap (and) contributors, CC- BY-SA.
control group 2 found a small, short term cluster in
Copenhagen City (Figure 4a). The cluster north of
Copenhagen was confirmed in analyses with other levels
of k and there was better agreement on the location of the
area across the two control groups (results not shown). A
small cluster of 1–3 statistically significant cases was
detected in Odense with the second and the combined
control groups, but it was too small to be regarded a true
cluster (not shown).
When analyses were adjusted for reproductive and
socioeconomic factors, only the combined control group
identified a cluster north of Copenhagen (Figure 4b).
The combined control group continued to identify two
significant cases in Odense after the adjustment, but
applying the control groups separately did not. Findings
from the cluster analyses are summarized in table 2, from
which it appears that the cluster north of Copenhagen
was consistently found across control groups in most
analyses, while the Odense and Høje Taastrup areas were
detected in fewer analyses and with less agreement.
Finally, 138 cases and 203 controls had resided inside
the northern Copenhagen cluster area for at least five
years, resulting in a relative risk of breast cancer of 1.39
(95% CI: 1.11-1.74) for women who had lived within the
area compared to those who had not. Cases from the
cluster area were on average seven years younger and
had fever metastases at time of diagnosis than cases
living outside the Copenhagen cluster area.
Discussion
This population-based case–control study consequently
found a statistically significant cluster of breast cancer in
an area comprising the northern suburbs of Copenhagen
present at almost the entire study period. A second
cluster was found in Odense; however, this cluster
was less evident.
Nordsborg et al. BMC Cancer 2014, 14:255
/>
Page 7 of 12
Figure 3 Results of space-only cluster analyses performed in SaTScan. Analyses were based on residential addresses of cases and controls in
1987 (3a) and 1997 (3b). Clusters were found in the Odense (inserted maps) and Copenhagen areas. The colours of the areas indicate the control
group used. The number of cases and the p-value for each cluster are given in the text boxes. CG: Control Group. The maps contain data from
the Danish Geodata Agency and © OpenStreetMap (and) contributors, CC- BY-SA.
The northern suburbs of Copenhagen
The Odense area
Clusters in the northern suburbs of Copenhagen were
consistently identified spatially and temporally by use of
each of the two control groups and when control groups
were combined into one. Further, the cluster area was
found at several levels of k and confirmed by supplementary analyses in SaTScan. The cluster area persisted
in crude analyses restricted to the 66% of the study
population with data on reproduction and socioeconomic indicators. However, when analyses were adjusted
for reproductive and area-level socioeconomic factors
the cluster area was smaller and only identified with the
combined control group. This could suggest that the
clustering of cases in this area is caused by geographical
differences in reproductive and/or socioeconomic factors. But as the cluster area did not disappear entirely as
a result of the adjustment it is also possible that other
factors have contributed to the cluster. Further, with the
cluster being persistent when the control groups were
combined but not when they were used separately could
also indicate that sample size has influenced the results.
Results also suggested a small cluster of breast cancer
cases in Odense; however, this area was only statistically
significant when the second and the combined control
groups were applied, and when the study population was
reduced to 66%, the area only had 1–3 statistically significant cases, which, according to a previous simulation
study [27], is too few cases to be regarded a true cluster.
This borderline result was further weakened when analyses were adjusted, but it cannot be ruled out that a
small cluster existed in this area. On the other hand, as
the first control group did not detect this cluster area, it
is likely that this finding is merely driven by the geographical pattern of the second control group rather that
the cases.
The Høje Taastrup area
Finally, a cluster was also found in the Høje Taastrup
area (south-west of Copenhagen), with the second control group and Q-statistics. Results of selected analyses
in SaTScan with the second and the combined control
Nordsborg et al. BMC Cancer 2014, 14:255
/>
Page 8 of 12
Figure 4 Unadjusted and adjusted results of space-time cluster analyses. Analyses were based on the 66% of the study population with
data on reproduction and socioeconomic indicators and performed in SpaceStat with 999 permutations, k = 100. 4a shows cluster areas in the
Copenhagen areas with each of the two control groups and the combined control group before adjustment. 4b shows cluster areas detected by
identical analyses after adjustment for ever/never child birth, age at first birth, number of child births, area-level income and education. The cluster
areas presented in the figures illustrate the maximum extent of the cluster areas based on the location of significant cases, and the colours of the
areas indicate the control group used. For each cluster area the text box shows how many cases it comprised and its temporal extent. CG: Control
Group. The maps contain data from the Danish Geodata Agency and © OpenStreetMap (and) contributors, CC- BY-SA.
group agreed on this area, however since the area was
not found by Q-statistics with the first or the combined
control group nor by SaTScan using the first control
group, we regard this a chance finding.
Time scales
In the space-time cluster analyses we modelled time
both as calendar year and as age, because if age-specific
susceptibility exists in the development of breast cancer
it might be revealed by use of the age time scale [23]. In
general, the detected clusters existed for long periods of
time in several of the analyses, thus results did not point
out any specific time interval for the clusters. However,
residential data were not available prior to 1971, thus we
did not have information on residential addresses during
child- or young adulthood for the majority of the study
population, consequently we did not have the possibility
to detect clusters that could have occurred during that
potentially important period of life.
Socioeconomic status and breast cancer risk
Breast cancer is one of the few cancers that is associated with high socioeconomic status [10]. However, at
the same time affluent women are usually diagnosed
at earlier stages and have better survival rates compared to deprived women [30,31]. Although socioeconomic status itself is not regarded a risk factor, its
association with breast cancer is thought mediated by
other well-established breast cancer risk factors such
as high age at first birth, use of HRT and alcohol
intake which are frequent among women with high
socioeconomic status compared to less affluent women
[32]. As the suburbs north of Copenhagen are characterised by a wealthy and highly educated population, it
Nordsborg et al. BMC Cancer 2014, 14:255
/>
Page 9 of 12
Table 2 Summary of findings from space-time cluster analyses performed in SpaceStat and confirmatory “space-only”
cluster analyses performed in SaTScan
Analysis
Identified cluster areas
Copenhagen
Q-statistics (SpaceStat)
Figure no.
Odense
ka
1b
2c
1 & 2d
25
x
x
x
100
x
x
x
25
x
100
x
25
x
100
x
1
Høje Taastrup
2
1&2
x
x
1
2
1&2
Unadjusted, all cases
Calendar year
Age
2.a
x
2.b
-
x
x
-
Unadjusted, 66% of cases
Calendar year
Age
x
x
-
x
4.a
25
-
100
-
25
-
Adjusted, 66% of cases
Calendar year
100
Age
x
4.b
25
-
100
-
Scan statistics (SaTScan)
Year 1987
xe
Year 1997
x
xe
x
x
x
x
3.a
3.b
For each cluster area, the “x” indicates in which analyses the cluster was detected according to method, number of cases, adjustment, time scale, choice of
a
k-nearest neighbours and by control group b1, c2 and d1 & 2 combined. eOnly borderline significant. For selected analyses the cluster areas are depicted in the
figures listed in the last column.
seems plausible that the cluster in this area could be
explained by factors related to high socioeconomic status.
This also agrees with our finding of younger age at
diagnosis and lower frequency of metastasis among cases,
who lived inside the cluster area compared to those
who lived outside. The fact that the cluster area mostly
disappeared after adjustment for reproductive factors
and area-level income and education (the cluster area
was only detected with the combined control group)
supports this hypothesis. On the other hand, the area
persisted to have a smaller significant cluster when
the combined control group was used, which could
also suggest that other factors may have contributed
to the observed breast cancer cluster. Data from the
Danish National Health Survey 2010, including
177,639 responders, show that the municipalities
north of Copenhagen have some of the highest proportions of women with potential problematic alcohol
consumption compared to the rest of the country [33].
Further, the Danish prescription database indicates that
the HRT use might be slightly higher in the capital region
than in the remaining four Danish regions [34], however
the differences are small and numbers are aggregated
to very large geographical units. Nevertheless, it seems
possible that alcohol and/or HRT could have contributed
to the observed breast cancer cluster.
Previous studies have found that high socioeconomic
status at the individual- and at the area-level independent
of each other were associated with higher risk of breast
cancer [35,36]. The area-level socioeconomic adjustment
performed in the present study would therefore have
been improved if we had also been able to adjust for
individual-level socioeconomic factors.
Finally, we cannot exclude that other factors (e.g.
environmental) with geographical variation might have
contributed to the observed cluster. Since the cluster
persisted through time, the responsible factor(s) are
likely to have similarly persisted across many years.
The area north of Copenhagen, where the cluster was
detected, is mainly a residential area with single family
houses, green spaces, forests and lakes. The area has lower
population density than Copenhagen City, but higher than
in municipalities further away from Copenhagen. Farming
and heavy industry is not present in the area; but a highway
and some major roads, railways and power lines intersect
the area. However, large parts of Denmark have such
infrastructure, therefore it seems unlikely that these factors
could be related to the clustering of cases.
Nordsborg et al. BMC Cancer 2014, 14:255
/>
Previous cluster studies of breast cancer
Several previous studies have identified clusters of breast
cancer, however it is difficult to compare these to the
present study because they were conducted in other
populations (in the US and Canada) and they use different
methods and types of data. One previous study found high
breast cancer mortality in a large region covering New
York and Philadelphia metropolitan areas, using the scan
statistic of SaTScan [16]. Applying a different approach
(Moran’s I) and focusing on Long Island only, Jacquez and
Greiling identified local clusters of high breast cancer
morbidity rates in the Southampton area [37]. Both
studies relied on aggregated data, thus they were unable
to take human mobility and potential latency periods into
account. Further, clusters of mortality (in contrast to
incidence) might reflect differences in cancer treatment
and survival. Studying clustering of breast cancer in two
New York state counties, Han et al. applied different
cluster detection techniques to the spatial pattern
described by place of residence at several selected points
in time over the life-course of breast cancer cases and
controls, and found clustering of pre-menopausal breast
cancer cases’ residential addresses at time of birth
and at time of menarche [18,19]. Although the study was
based on residential histories and attempted to identify susceptible time periods related to breast cancer
development, it only investigated the spatial distribution
of cases and controls at a few selected points in time over
the life-course.
A recent Canadian study applied the scan statistics of
SaTScan and found excess incidence rates of breast cancer
in five counties in southern Ontario, which were
suggested related to environmental pollution from
industry and farming characterising these areas [17].
The study was based on aggregated incidence data and
results should therefore be interpreted with caution. A
study on Cape Cod, Massachusetts, however, acknowledged
that exposures at past residencies rather than exposures at
time of diagnosis may be more relevant in the development
of breast cancer. Thus, the study was based on 40 years of
residential histories and used generalised additive models to
identify clusters of breast cancer in space and time
simultaneously, adjusting at the same time for known
risk factors such as parity and age at first birth. A
large area of elevated breast cancer risk was found
near Massachusetts Military Reservation in the 1940s
and 1950s (many years before cases were diagnosed),
suggesting that activities at this site in that time window
could have exposed women living close by to hazardous
substances [20,38]. In contrast to these previous studies
on Cape Cod, results of our present study do not
point to specific environmental causes, rather it suggests
that the cluster north of Copenhagen may be a result of
already established factors related to high socioeconomic
Page 10 of 12
status. There was no organised breast cancer screening
programme established in the municipalities north of
Copenhagen at the time when cases of the present study
were diagnosed, but we cannot exclude that affluent
women are more likely to seek breast cancer screening on
own initiative than deprived women, which could have
contributed to the observed cluster.
Strengths and limitations
The present study is among the first examinations of
clusters of breast cancer in both space and time using
residential histories. Cases were identified in the
virtually complete high-quality population-based Danish
Cancer Registry [21,39], thus the study had very
reliable case ascertainment. Furthermore, the Danish
Civil Registration System provided an ideal frame for
bias-free control selection and collection of residential
addresses back to 1971 [22]. Compared to other case–
control studies that usually have to rely on residential histories collected by interview, our register-based residential
histories strengthened the study. The advantageous study
design with two independent control groups and the
ability to adjust for reproductive factors and area-level
socioeconomic indicators was very helpful in the
interpretation of the findings. Further, the scan statistics
of SaTScan confirmed the location of the cluster areas. In
a previous study of non-Hodgkin Lymphoma using the
same study design, there was no consistent finding across
the two independent control groups and combining the
control groups into one made the clusters disappear,
leading to the conclusion that there were no space-time
clusters of incident non-Hodgkin Lymphoma cases based
on residential histories in Denmark [40]. However, this
was not the case in the present study of breast cancer,
where we were able to replicate within-study findings
across control groups.
The lack of data on alcohol intake and use of HRT
limits our ability to interpret the likely causes of the
cluster in our study, as these known risk factors may
explain at least part of the detected cluster; however
the inability to adjust for all known risk factors is a
shortcoming of almost all cluster studies. Due to no
more than 33 years of residential history data we did
not have the possibility to detect clusters that could
have occurred early in life or young adulthood, which
is an important limitation of the study. Furthermore,
seven percent of the residential addresses were geocoded
at the municipality level, which could have introduced
some uncertainty to the study; however sensitivity
analyses that omitted these less precise addresses indicated
that results were not influenced by the geocoding uncertainty. Another limiting factor was related to computational
time. Due to the large data sets of residential histories, a
single analysis took up to 8 hours, thus we could not
Nordsborg et al. BMC Cancer 2014, 14:255
/>
explore a very wide range of different levels of k in the
analyses. But SaTScan spatial scan statistics, which search
for clusters using variable-sized scanning windows, were
used to confirm the clusters suggested by the Q-statistics.
The Q-statistics employ local space-time statistics for each
individual and the question of inference with multiple tests
arises. To address multiple testing we used two approaches
driven by our simulation study [27]. The first was to
combine information from two Q-statistics, such that
a possible true cluster warrants further investigation if
four or more significant cases were detected in the
same area with a Qi p = 0.001 and Qit p ≤ 0.05. The
second was to use SaTScan to corroborate clustering in
the time periods found significant under the Q-statistics.
While not strictly a multiple testing correction, using
SaTScan to corroborate results increased our confidence
in the finding provided by the Q-statistics, further
reducing the possibility of a false finding due to multiple
testing.
Conclusions
The present study found a space-time cluster of breast
cancer in the municipalities north of Copenhagen based
on 33 years of residential histories. The cluster was
consistently found across two independent control
groups, but after adjustment for reproductive factors and
area-level income and education the cluster became
less evident. The remaining less evident cluster might be
explained by socioeconomic factors that were not accounted
for such as individual-level income and education,
alcohol consumption and HRT use. We cannot exclude
environmental pollutants as a contributing cause, but no
pollutants specific to this area seem obvious.
Abbreviations
HRT: Hormone replacement therapy; CG: Control group.
Competing interests
Geoffrey M. Jacquez has an interest in BioMedware, the developer of the
SpaceStat software used in this study. This has not influenced interpretation
of the results and does not alter the authors’ adherence to all of the policies
of BMC Cancer. The authors declare that they have no further competing
interests.
Authors’ contributions
All authors have contributed to study design and interpretation of results.
RBN preformed data collection, carried out the analyses, and wrote the
paper. GMJ and JRM developed the method and provided analysis tools.
AHP, JRM, AKE, GMJ and ORN critically revised the manuscript. All authors
have read and approved the final manuscript.
Acknowledgements
We would like to thank Joachim Schüz for important input to study design;
Morten Lind for access to address coordinates; and Jan Wohlfahrt and Mads
Melbye for data from the Danish Family Relations Database. Andy Kaufmann
programmed the Q-statistics in the SpaceStat software that was used in this
study. The research was funded by the Danish Cancer Society and the
Danish Agency for Science, Technology and Innovation. National Institutes of
Health (NIH) grants to BioMedware funded methods development.
Page 11 of 12
Author details
Danish Cancer Society Research Center, Copenhagen, Denmark. 2National
Institute of Public Health, University of Southern Denmark, Copenhagen,
Denmark. 3Graduate Program in Public Health and Department of Preventive
Medicine, Stony Brook University, Stony Brook, NY, USA. 4BioMedware Inc,
Ann Arbor, MI, USA. 5Department of Geography, State University of New York
at Buffalo, Buffalo, NY, USA.
1
Received: 5 November 2013 Accepted: 8 April 2014
Published: 11 April 2014
References
1. Jemal A, Bray F, Center MM, Ferlay J, Ward E, Forman D: Global cancer
statistics. CA Cancer J Clin 2011, 61:69–90.
2. Parkin DM, Bray FI, Devesa SS: Cancer burden in the year 2000. The global
picture. Eur J Cancer 2001, 37:S4–66.
3. Engholm G, Ferlay J, Christensen N, Bray F, Gjerstorff ML, Klint A, Kotlum JE,
Olafsdottir E, Pukkala E, Storm HH: NORDCAN: Cancer Incidence, Mortality,
Prevalence and Prediction in the Nordic Countries, Version 5.3. Association of
Nordic Cancer Registries. Danish Cancer Society. />nordcan.htm.
4. Ewertz M, Mellemkjaer L, Poulsen AH, Friis S, Sorensen HT, Pedersen L,
McLaughlin JK, Olsen JH: Hormone use for menopausal symptoms and
risk of breast cancer. A Danish cohort study. Br J Cancer 2005,
92:1293–1297.
5. Hansen J, Lassen CF: Nested case–control study of night shift work and
breast cancer risk among women in the Danish military. Occup Environ
Med 2012, 69:551–556.
6. Key TJ, Verkasalo PK, Banks E: Epidemiology of breast cancer. Lancet Oncol
2001, 2:133–140.
7. Lacroix M, Leclercq G: The "portrait" of hereditary breast cancer. Breast
Cancer Res Treat 2005, 89:297–304.
8. Morch LS, Johansen D, Thygesen LC, Tjonneland A, Lokkegaard E, Stahlberg C,
Gronbaek M: Alcohol drinking, consumption patterns and breast cancer
among Danish nurses: a cohort study. Eur J Public Health 2007,
17:624–629.
9. Ronckers CM, Erdmann CA, Land CE: Radiation and breast cancer: a review
of current evidence. Breast Cancer Res 2005, 7:21–32.
10. Carlsen K, Hoybye MT, Dalton SO, Tjonneland A: Social inequality and
incidence of and survival from breast cancer in a population-based
study in Denmark, 1994–2003. Eur J Cancer 2008, 44:1996–2002.
11. Kliewer EV, Smith KR: Breast cancer mortality among immigrants in
Australia and Canada. J Natl Cancer Inst 1995, 87:1154–1161.
12. Ziegler RG, Hoover RN, Pike MC, Hildesheim A, Nomura AM, West DW,
Wu-Williams AH, Kolonel LN, Horn-Ross PL, Rosenthal JF, Hyer MB: Migration
patterns and breast cancer risk in Asian-American women. J Natl Cancer
Inst 1993, 85:1819–1827.
13. Lichtenstein P, Holm NV, Verkasalo PK, Iliadou A, Kaprio J, Koskenvuo M,
Pukkala E, Skytthe A, Hemminki K: Environmental and heritable factors in
the causation of cancer–analyses of cohorts of twins from Sweden,
Denmark, and Finland. N Engl J Med 2000, 343:78–85.
14. Madigan MP, Ziegler RG, Benichou J, Byrne C, Hoover RN: Proportion of
breast cancer cases in the United States explained by well-established
risk factors. J Natl Cancer Inst 1995, 87:1681–1685.
15. Coyle YM: The effect of environment on breast cancer risk. Breast Cancer
Res Treat 2004, 84:273–288.
16. Kulldorff M, Feuer EJ, Miller BA, Freedman LS: Breast cancer clusters in the
northeast United States: a geographic analysis. Am J Epidemiol 1997,
146:161–170.
17. Luginaah IN, Gorey KM, Oiamo TH, Tang KX, Holowaty EJ, Hamm C, Wright
FC: A geographical analysis of breast cancer clustering in southern
Ontario: generating hypotheses on environmental influences. Int J
Environ Health Res 2012, 22:232–248.
18. Han D, Rogerson PA, Nie J, Bonner MR, Vena JE, Vito D, Muti P, Trevisan M,
Edge SB, Freudenheim JL: Geographic clustering of residence in early life
and subsequent risk of breast cancer (United States). Cancer Causes
Control 2004, 15:921–929.
19. Han D, Rogerson PA, Bonner MR, Nie J, Vena JE, Muti P, Trevisan M,
Freudenheim JL: Assessing spatio-temporal variability of risk surfaces
using residential history data in a case control study of breast cancer.
Int J Health Geogr 2005, 4:9.
Nordsborg et al. BMC Cancer 2014, 14:255
/>
20. Vieira VM, Webster TF, Weinberg JM, Aschengrau A: Spatial-temporal
analysis of breast cancer in upper Cape Cod, Massachusetts. Int J Health
Geogr 2008, 7:46.
21. Gjerstorff ML: The Danish Cancer Registry. Scand J Public Health 2011,
39(7):42–45.
22. Pedersen CB: The Danish Civil Registration System. Scand J Public Health
2011, 39(7):22–25.
23. Meliker JR, Jacquez GM: Space-time clustering of case–control data
with residential histories: insights into empirical induction periods,
age-specific susceptibility, and calendar year-specific effects.
Stoch Environ Res Risk Assess 2007, 21:625–634.
24. Knudsen LB, Olsen J: The Danish Medical Birth Registry. Dan Med Bull
1998, 45:320–323.
25. Boyd HA, Poulsen G, Wohlfahrt J, Murray JC, Feenstra B, Melbye M: Maternal
contributions to preterm delivery. Am J Epidemiol 2009, 170:1358–1364.
26. Jacquez GM, Meliker JR, Avruskin GA, Goovaerts P, Kaufmann A, Wilson ML,
Nriagu J: Case–control geographic clustering for residential histories
accounting for risk factors and covariates. Int J Health Geogr 2006, 5:32.
27. Sloan CD, Jacquez GJ, Galllagher CM, Ward MH, Raaschou-Nielsen O,
Nordsborg RB, Meliker JR: Performance of cancer cluster Q-statistics for
case–control residential histories. Spat Spatiotemporal Epidemiol 2012,
3:297–310.
28. Kulldorff M: A spatial scan statistic. Communications in Statistics - Theory
and Methods 1997, 26:1481–1496.
29. Kulldorff M, Huang L, Pickle L, Duczmal L: An elliptic spatial scan statistic.
Stat Med 2006, 25:3929–3943.
30. Dalton SO, During M, Ross L, Carlsen K, Mortensen PB, Lynch J, Johansen C:
The relation between socioeconomic and demographic factors and
tumour stage in women diagnosed with breast cancer in Denmark,
1983–1999. Br J Cancer 2006, 95:653–659.
31. Dalton SO, Ross L, During M, Carlsen K, Mortensen PB, Lynch J, Johansen C:
Influence of socioeconomic factors on survival after breast cancer–a
nationwide cohort study of women diagnosed with breast cancer in
Denmark 1983–1999. Int J Cancer 2007, 121:2524–2531.
32. Larsen SB, Olsen A, Lynch J, Christensen J, Overvad K, Tjonneland A,
Johansen C, Dalton SO: Socioeconomic position and lifestyle in relation
to breast cancer incidence among postmenopausal women: a
prospective cohort study, Denmark, 1993–2006. Cancer Epidemiol 2011,
35:438–441.
33. Christensen AI, Ekholm O, Glümer C, Andreasen AH, Hvidberg MF,
Kristensen PL, Larsen FB, Ortiz B, Juel K: The Danish National Health Survey
2010. Study design and respondent characteristics. Scand J Public Health
2012, 40:391–397.
34. National Institute for Health Data and Disease Control,Denmark: Medstat.
.
35. Robert SA, Strombom I, Trentham-Dietz A, Hampton JM, McElroy JA,
Newcomb PA, Remington PL: Socioeconomic risk factors for breast
cancer: distinguishing individual- and community-level effects.
Epidemiology 2004, 15:442–450.
36. Webster TF, Hoffman K, Weinberg J, Vieira V, Aschengrau A:
Community- and individual-level socioeconomic status and breast
cancer risk: multilevel modeling on Cape Cod, Massachusetts.
Environ Health Perspect 2008, 116:1125–1129.
37. Jacquez GM, Greiling DA: Local clustering in breast, lung and colorectal
cancer in Long Island, New York. Int J Health Geogr 2003, 2:3.
38. Vieira V, Webster T, Weinberg J, Aschengrau A, Ozonoff D: Spatial analysis of
lung, colorectal, and breast cancer on Cape Cod: an application of
generalized additive models to case–control data. Environ Health 2005, 4:11.
39. Storm HH, Michelsen EV, Clemmensen IH, Pihl J: The Danish Cancer
Registry - history, content, quality and use. Dan Med Bull 1997, 44:535–539.
40. Baastrup Nordsborg R, Meliker JR, Kjær Ersbøll A, Jacquez GM,
Raaschou-Nielsen O: Space-Time Clustering of Non-Hodgkin Lymphoma
Using Residential Histories in a Danish Case–control Study. PLoS ONE
2013, 8:e60800.
Page 12 of 12
Submit your next manuscript to BioMed Central
and take full advantage of:
• Convenient online submission
• Thorough peer review
• No space constraints or color figure charges
doi:10.1186/1471-2407-14-255
Cite this article as: Nordsborg et al.: Space-time clusters of breast cancer
using residential histories: A Danish case–control study. BMC Cancer
2014 14:255.
• Immediate publication on acceptance
• Inclusion in PubMed, CAS, Scopus and Google Scholar
• Research which is freely available for redistribution
Submit your manuscript at
www.biomedcentral.com/submit