RNA-binding protein RNPC1: Acting as a tumor suppressor in breast cancer
Bạn đang xem bản rút gọn của tài liệu. Xem và tải ngay bản đầy đủ của tài liệu tại đây (2.16 MB, 13 trang )
Xue et al. BMC Cancer 2014, 14:322
/>
RESEARCH ARTICLE
Open Access
RNA-binding protein RNPC1: acting as a tumor
suppressor in breast cancer
Jin-Qiu Xue†, Tian-Song Xia†, Xiu-Qing Liang, Wenbin Zhou, Lin Cheng, Liang Shi, Ying Wang and Qiang Ding*
Abstract
Background: RNA binding proteins (RBPs) play a fundamental role in posttranscriptional control of gene
expression. Different RBPs have oncogenic or tumor-suppressive functions on human cancers. RNPC1 belongs to
the RNA recognition motif (RRM) family of RBPs, which could regulate expression of diverse targets by mRNA
stability in human cancer cells. Several studies reported that RNPC1 played an important role in cancer, mostly
acting as an oncogene or up-regulating in tumors. However, its role in human breast cancer remains unclear.
Methods: In the present study, we investigated the functional and mechanistic roles of RNPC1 in attenuating
invasive signal including reverse epithelial-mesenchymal transition (EMT) to inhibit breast cancer cells
aggressiveness in vitro. Moreover, RNPC1 suppress tumorigenicity in vivo. Further, we studied the expression
of RNPC1 in breast cancer tissue and adjacent normal breast tissue by quantitative RT-PCR (qRT-PCR) and
Western blot.
Results: We observed that RNPC1 expression was silenced in breast cancer cell lines compared to breast epithelial
cells. More important, RNPC1 was frequently silenced in breast cancer tissue compared to adjacent normal breast
tissue. Low RNPC1 mRNA expression was associated with higher clinical stages and mutp53, while low level of
RNPC1 protein was associated with higher lymph node metastasis, mutp53 and lower progesterone receptor (PR).
Functional assays showed ectopic expression of RNPC1 could inhibit breast tumor cell proliferation in vivo and
in vitro through inducing cell cycle arrest, and further suppress tumor cell migration and invasion partly through
repressing mutant p53 (mutp53) induced EMT.
Conclusions: Overall, our findings indicated that RNPC1 had a potential function to play a tumor-suppressor role
which may be a potential marker in the therapeutic and prognostic of breast cancer.
Keywords: RNPC1, Breast cancer, p53, EMT, Tumor suppressor
Background
Breast cancer is the most commonly diagnosed cancer
in women and the leading cause of cancer deaths in the
developed world [1]. Despite advances to diagnose and
treat breast cancer keeping growing, the incidence is still
rising, and it remains a major fatal disease in women [2].
Breast cancer is a heterogeneous disease due to complicated etiology, results from accumulated genetic and
epigenetic alterations of various cancer genes, including
tumor-suppressor genes (TSGs) and oncogenes [3]. RNA
binding proteins (RBPs) have been realized as novel layer
* Correspondence:
†
Equal contributors
Jiangsu Breast Disease Center, the First Affiliated Hospital with Nanjing
Medical University, 300 Guangzhou Road, Nanjing 210029, China
of gene regulation and involved in breast cancer progression as TSGs or oncogenes.
RBPs play a key role in posttranscriptional control of
gene expression [4], such as polyadenylation, RNA splicing, transport, stability, and translation, all of which are
emerging as critical mechanisms for gene regulation in
mammalian cells [5]. RBPs contain one or more RNAbinding motifs, such as hnRNP K homology motif, RNA
recognition motif (RRM), RGG box, and dsRBD motif
[5-7]. RRM is the most prevalent type of eukaryotic
RNA-binding motifs [6]. RBPs are involved in the expression of various genes responsible for biological processes and cellular functions, so expected mutations or
aberrant production of RBPs can cause cancer progression [7,8]. Deregulation of splicing factors might lead to
© 2014 Xue et al.; licensee BioMed Central Ltd. This is an Open Access article distributed under the terms of the Creative
Commons Attribution License ( which permits unrestricted use, distribution, and
reproduction in any medium, provided the original work is properly credited. The Creative Commons Public Domain
Dedication waiver ( applies to the data made available in this article,
unless otherwise stated.
Xue et al. BMC Cancer 2014, 14:322
/>
alternative splicing of transcripts in cancer cells [9]. On
the other hand, translation of mRNA is also a regulatory
point for the expression of tumor suppressors or oncogenes in cancer cells [10]. Therefore translation factors
play critical role in tumorigenesis. Translation initiation
factor could be over-expressed in various tumor and behave as a characteristic proto-oncogene [4].
RNPC1 gene is located on chromosome 20q13 and
expressed in various tissues. It belongs to the RRM family
of RBPs, is expressed as RNPC1a with 239 amino acids
and RNPC1b with 121 amino acids [11]. RNPC1a is
capable of regulating biological characteristics, binding
and stabilizing the mRNA of p21, p73 and Hu antigen R
(HUR) [11-13]. Recently, RNPC1 is also found to bind and
stabilize the mRNA of Macrophage inhibitory cytokine-1
(MIC), which facilitates RNPC1-induced cell growth suppression [14]. Additional mRNAs bound by RNPC1 include p63, murine double minute-2 (MDM2) and p53
mRNAs. In these instances, RNPC1 binding mediates a
decrease in mRNA levels and attenuation of translation
[15-17]. It is solidly confirmed that RNPC1 play pivotal
roles in regulating wide biological processes, ranging from
cell proliferation, cell cycle arrest to cell myogenic differentiation [13,18]. However, its role in tumorigenesis is
scanty and contradictory in human cancers, particularly in
breast cancer. In many studies, RNPC1 was recognized as
an oncogene, frequently amplified in prostate cancer
[19,20], ovarian cancer [21], colorectal cancer [22,23],
chronic lymphocytic leukemia [24], colon carcinoma [25],
esophageal cancer [26], dog lymphomas [17], and breast
cancer [27,28]. Recently, new evidence suggested RNPC1
might act as a tumor suppressor. It was reported to be in
a negative feedback loop, which restricts E2F1 activity by
limiting cell-cycle progression at the G1-S boundary [29].
Expression of RNPC1 is highly correlated with increased
survival in human ovarian cancer [29]. Moreover, RNPC1
was silenced by promoter hypermethylation in breast cancer [30]. However, most of the available studies focused on
the various targets of RNPC1 binding in cancer. Its expression and biologic functions in human breast cancer
remains unclear.
In this study, we showed that RNPC1 was significantly
down-regulated in high-invasive breast cancer cell lines,
MDA-MB-231 and SUM1315, not low-invasive MCF-7
cell lines. RNPC1 potentiated tumor-suppressive signals to
suppress proliferation, growth, migration, and invasiveness
of breast cancer cells in vitro, and suppress tumorigenicity
in vivo. Importantly, we examined RNPC1 expressive situation in clinical cancer and adjacent normal breast specimens and analyzed the association with between RNPC1
expression and clinic pathological characters. RNPC1 was
found to be lower expressed in breast cancer compared to
adjacent normal breast tissue. RNPC1 mRNA expression
was associated with clinical stages and mutp53. RNPC1
Page 2 of 13
protein expression was associated with lymph node metastasis, mutp53 and progesterone receptor (PR). The clinical
data was consistent with the experimental results; both of
them strongly suggested that RNPC1 might act as a tumor
suppressor in breast cancer.
Methods
RNA extraction, reverse transcription and quantitative
RT-PCR (qRT-PCR)
Total RNA was extracted from cells and tissues using Trizol reagent (TaKaRa, A-79061), and cDNA was synthesized using Primescript RT Reagent (TaKaRa) following
manufacturer's instructions. The following PCR primers
were used:
RNPC1 forward, 5′-ACGCCTCGCTCAGGAAGTA3-′
RNPC1 reverse, 5′-GTCTTTGCAAGCCCTCTCAG3-′
β-actin forward, 5′-GCTGTGCT ATCCCTGTACGC3-′
β-actin reverse, 5′-TGCCTCAGGGCAGCGGAACC3-′
qRT-PCR for β-actin and other genes was performed
for every cDNA sample. All PCR reactions were performed using the fluorescent SYBR Green I methodology.
Real-time quantitative PCR was performed on StepOne
Plus Real-Time PCR system (Applied Biosystems, USA)
using FastStart Universal SYBR Green Master (Roche,
Switzerland) according to the manufacturer's instructions. As a result, the relative gene expression was normalized, with β-actin serving as the internal control.
Noticeable, this study showed clearly RNPC1instead of
RNPC1a.
Tissue samples
121 pairs of snap-frozen breast tumor and matched normal tissues from adjacent regions were provided by the
First Affiliated Hospital with Nanjing Medical University from February 2006 to August 2009, from patients
treated surgically for clinical stage I–III breast cancer
(aged 34–82 years). All the patients did not receive
chemotherapy, radiotherapy or hormone therapy before
surgery. Tumor and normal tissue samples had been
verified as tumor or non-tumor by histopathological
examination of hematoxylin stained paraffin sections.
Histologic types were classified according to the World
Health Organization (2003). TNM staging was defined
according to the American Joint Committee on Cancer
(AJCC) (the 6th version, 2002). All the cases were individually categorized by independent pathologists. All
the samples’ collection was according to the ethical
guidelines of the Declaration of Helsinki and approved
by the ethics and research committee of the First Affiliated Hospital of Nanjing Medical University. Before surgery patients are informed that their surgical specimens
would possibly be used for research purposes. All the
Xue et al. BMC Cancer 2014, 14:322
/>
participants provided their written informed consent
for inclusion in the data analysis and manuscript publication. Data were analyzed anonymously.
Cell culture
The human breast cancer cell lines (MCF-7, MDA-MB231, BT474 and ZR-75) and non-malignant breast epithelial cells (MCF-10A) were obtained from the American
Type Culture Collection (ATCC, VA, USA) and culture in
complete medium of High glucose Dulbecco's Modified
Eagle Medium (DMEM) supplemented with 10% fetal
bovine serum (FBS), 1% penicillin - streptomycin solution
at 5% CO2 and 37°C incubator. Cell line SUM1315 was
provided by Stephen Ethier (University of Michigan). The
184A1 immortalized breast epithelial cell line was provided by Ceshi Chen (Kunming Institute of Zoology).
Plasmid construction and lentivirus packaging
Lentivirus packaging cells were transfected with PGLV3h1-GFP-puro vector (GenePharma, Shanghai, China)
or pGLV5-h1-GFP-puro vector (GenePharma, Shanghai,
China) containing either the RNPC1a knockdown
(shRNPC1a) or RNPC1a overexpression (RNPC1a), and a
scrambled sequence (SCR) or a negative control sequence
(NC), respectively, following the manufacturer’s instructions. Three shRNA plasmids (sh1, sh2, sh3) were constructed against different RNPC1a targets, including a
scrambled sequence as a negative control (Additional
file 1: Table S1). All plasmids were verified by sequencing
(GenePharma, Shanghai, China). Cells were plated in 6
wells dishes at 30% confluence and infected with the retroviruses. Meanwhile, polybrene (5 μg/ml) was added with
the retroviruses to enhance the target cells infection efficiency. Stable pooled populations of breast cancer cells
were generated by selection using puromycin (2 μg/ml)
for 2 weeks. For knockdown, one construct (sh3), with
≥85% knockdown efficiency, was used for further studies
(Additional file 1: Figure S1).
Colony formation assay
Cell used for colony formation analysis were seeded into
6-well plates (500 cells/wells) and cultured normally for
15–20 days. The colonies were fixed in paraform and
stained with Giemsa after washed by phosphate-buffered
saline (PBS) twice, then dried at room temperature. The
colonies in each well were counted, and all cell colonies
contained 50 or more cells.
Cell counting kit (CCK-8) assay
Cell proliferation was assessed using CCK-8 kit (Dojindo,
Japan) according to the manufacturer’s instructions/protocol. Cells diluted serum-free medium, 2,000 cells/wells
were seeded in a 96-well cell culture plate, grown at 37°C
on the day of measuring the growth rate of cells, 100 μl of
Page 3 of 13
spent medium was replaced with an equal volume of fresh
medium containing 10% CCK8, then cells continued to be
incubated at 37°C for 3 h, and the absorbance was finally
determined at 450 nm using a micro plate reader (5082
Grodig, Tecan, Austria).
Wound healing assay
Breast cancer cells were seeded into 6-well plates, and
allowed to grow until 100% confluens. Then the cell layer
was gently scratched through the central axis using a sterile plastic tip and loose cells were washed away. Quantification of cell motility by measuring the distance between
the invading fronts of cells in three random selected
microscopic fields (200×) for each condition and time
point (0, 18 h).
Cell migration and invasion assays
In vitro cell migration and invasion assays were performed as described previously [31]. Images of three
random fields (200×) were captured from each membrane, and the number of migratory or invasive cells was
counted.
Tumorigenesis in nude mice
BALB/C female nude mice (4-6-weeks old, 18–22 g)
were randomly divided into two groups (each containing
7 mices). Stable RNPC1a-expression MDA-MB-231 cells
or control cells (1 × 10⁶ cells in 0.1 ml PBS) was subcutaneously orthotopically injected into mammary fat pads
of the mice and the growth of tumors was followed up
for 6 weeks. Tumor volume was measured weekly using
a caliper, calculated as (tumor length × width2)/2. After
6 weeks, mice were sacrificed and checked for final
tumor size. Mouse studies were conducted according to
the Guide for the Care and Use of Laboratory Animals
and approved by the Animal Care and Use Committee
of Nanjing Medical University. All the samples’ collection was according to the ethical guidelines of the Declaration of Helsinki and approved by the ethics and
research committee of the First Affiliated Hospital of
Nanjing Medical University.
Western blotting analysis
Western blot analysis was performed as described previously [32]. The primary antibodies used were anti-rabbit
RBM38 (Santa Cruz), p21 (Santa Cruz), p53 (Santa Cruz),
p53 (Millipore), Vimentin (Abcam), anti-mouse E-cadherin
(Abcam). The secondary antibodies were purchased from
Cell Signaling technology. The intensity of the bands was
determined using densitometric analysis. GAPDH (Santa
Cruz) was used to as loading control.
Xue et al. BMC Cancer 2014, 14:322
/>
DNA histogram analysis
Cell cycle was assessed by flow cytometry (Becton
Dickinson, San Jose, CA, USA). For cell cycle analysis,
cells were collected, washed with PBS and fixed in ethanol
at −20°C for 8 h before being collected by centrifugation.
Then cells were washed with PBS, and resuspended in
500 μl of PBS with 0.2% Triton X-100, 10 mM EDTA,
100 μg/ml RNase A, and 50 μg/ml propidium iodide (PI)
at room temperature for 30 min.
Statistical analysis
The data were analyzed using the SPSS 12.0 software
(SPSS, Chicago, IL, USA). All experiments in this study
were repeated in triplicate, unless otherwise specified.
Student t-test was used to analyze the statistical significance of the differences between groups. χ2 test and
Page 4 of 13
Fisher Exact test were used to assess the correlation
between RNPC1 and clinicopathologic parameters. For
all the tests p values < 0.05 was considered statistically
significant.
Results
RNPC1 was lower expressed in human breast cancer cells
RNPC1 expression in five breast cancer cell lines and
two breast epithelial cell lines were quantified by qRTPCR and Western blot (Figure 1A, p < 0.05). Among the
seven cell lines analyzed, RNPC1 was found lower expression in breast cancer cells compared to normal
mammary breast epithelial MCF-10A and 184A1 cells.
Among breast cancer cells, MCF-7, BT474, ZR-75 cells
expressed relatively higher levels of RNPC1, and low
expression or barely detectable levels were found in
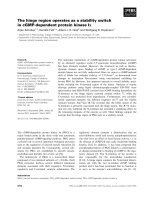
Figure 1 RNPC1 expressive in breast cancer cell lines and tissues. (A) qRT-PCR and Western blot analysis of RNPC1 expression in breast
cancer cell lines and normal breast cell lines MCF-10A and 184A1. The two normal breast cell lines showed higher expression of RNPC1 than
other cell lines (p < 0.05). The fold change of RNPC1a is shown below each lane. The intensity of the bands was determined using densitometric
analysis. (B) RNPC1 mRNA expression in 121 pairs of breast cancer and adjacent tissue. 26 cases showed for example. (C) Average expression level
of RNPC1 mRNA in 121 pairs of human breast cancer tissues and adjacent normal breast tissues. Adjacent breast tissues had higher expression of
RNPC1, where the breast cancer tissues showed the lower level of expression (p < 0.01). (D) RNPC1 protein expression in 121 pairs of breast
cancer and adjacent tissues. The 25 kDa band/GAPDH ratio was markedly lower in tumors compared to adjacent normal tissues. 12 cases showed
for example. The fold change of RNPC1a is shown below each lane. The intensity of the bands was determined using densitometric analysis.
(E) A scatter plot of RNPC1 protein expression in the same cancer tissue, adjacent tissue (p < 0.05). Data were means of two separate experiments
mean ± SEM, *p < 0.05, **p < 0.01.
Xue et al. BMC Cancer 2014, 14:322
/>
Page 5 of 13
Table 1 The association between RNPC1 mRNA expression
and clinicopathologic features of breast cancer
Clinicopathologic
parameters
Number
of case
RNPC1
RNPC1
Low
expression
High
expression
p-value
Age (years)
≤55
>55
68
53
42
40
26
0.109
13
Table 1 The association between RNPC1 mRNA expression
and clinicopathologic features of breast cancer (Continued)
PCNA
Negative
2
1
1
+
36
27
9
++
22
18
4
+++
12
8
4
ductal
106
71
35
special
15
11
4
0.567
Histology
Tumor Size (cm)
≤2
38
24
14
>2
83
58
25
0.463
TNM stage
I
24
11
13
II + III
97
71
26
≤3
96
69
27
>3
25
13
12
I
7
2
5
II
67
50
17
III
30
18
12
unclear
17
12
5
Negative
40
22
18
Positive
70
51
19
unclear
11
9
2
Negative
58
42
16
Positive
63
40
23
Negative
81
56
25
Positive
32
19
13
suspect
8
7
1
≤15%
43
30
13
>15%
52
40
12
Negative
46
35
11
Positive
15
11
4
Negative
42
26
16
Positive
52
42
10
0.010
Lymph node
metastasis
0.622
ER: estrogen receptor; PR: progesterone receptor; HER2: human epidermal
growth factor receptor 2.
TNM classification according to the Union Internationale Contre le Cancer
criteria. HER2 positivity 3+ in immunohistochemistry or positive fluorescent in
situ hybridisation test.
0.058
MDA-MB-231, SUM1315. Noticeable, this study showed
that clearly MB-231 could instead of MDA-MB-231.
0.066
RNPC1 protein and mRNA expression were down-regulated
in human breast cancer tissue
Grade
ER status
0.097
PR status
0.294
Her2 status
0.298
Ki67
0.430
CK5/6
0.830
P53
0.042
To determine RNPC1 expression in breast cancer tissues,
we use qRT-PCR and Western blot to analyze mRNA and
protein of RNPC1 in 121 breast cancer tissues and
marched adjacent non-cancerous tissue. RNPC1 transcripts were expressed at varying levels in the primary
breast tumors analyzed. We determined a gene expression
cut-off value of 0.61 (median value) that differentiated between RNPC1 low expression and high expression in
breast cancer. Similar to the cell lines’ data, of the 121
paired samples, 82 (68%) showed significantly lower
RNPC1 mRNA expression in the breast cancer tissue
compared to the adjacent tissue. Partial data was showed
in Figure1B and 1C (p < 0.01), mean level of RNPC1 in
tumors and tumor-adjacent normal tissue was 24.52,
37.58, respectively, which suggested that down-regulation
of RNPC1 was common in breast cancer. In Western blot
analysis, 84 (69%) patients showed significantly lower
RNPC1a expression in the breast cancer tissue compared
to the adjacent normal tissue, partial data was showed in
Figure 1D. The comparison obtained by calculating the ratio between RNPC1a and GAPDH expression (Figure 1E,
p < 0.05) also showed RNPC1a expression in tumors was
lower than the adjacent tissues (mean: 0.87, 1.37). Table 1
displayed the association of RNPC1 expression level and
clinicopathological features of 121 breast cancer patients,
which demonstrated that low RNPC1 mRNA expression
was significantly associated with advanced clinical stages
(p = 0.010), mutp53 (p = 0.042). In addition, it was related
with lymph node metastasis (p = 0.058) and grade (p =
0.066). There was no significant correlation between
RNPC1 mRNA expression and patient age, tumor size,
Ki67, PCNA, CK5/6, histology, estrogen receptor (ER),
Xue et al. BMC Cancer 2014, 14:322
/>
Page 6 of 13
Table 2 The association between RNPC1 protein expression
and clinicopathologic features in breast cancer
Clinicopathologic
parameters
Number
of case
RNPC1
RNPC1
Low
expression
High
expression
p-value
Age (years)
≤55
>55
68
53
46
38
22
0.631
15
Table 2 The association between RNPC1 protein expression
and clinicopathologic features in breast cancer (Continued)
PCNA
Negative
2
2
0
+
36
27
9
++
22
16
6
+++
12
7
5
ductal
106
75
31
special
15
9
6
0.619
Histology
Tumor Size (cm)
≤2
38
25
13
>2
83
59
24
0.557
TNM stage
I
24
15
9
II + III
97
69
28
0.411
0.397
ER: oestrogen receptor; PR: progesterone receptor; HER2: human epidermal
growth factor receptor 2.
TNM classification according to the Union Internationale Contre le Cancer
criteria. HER2 positivity 3+ in immunohistochemistry or positive fluorescent in
situ hybridisation test.
Lymph node
metastasis
≤3
96
62
34
>3
25
22
3
I
7
4
3
II
67
51
16
III
30
20
10
unclear
17
9
8
Negative
40
24
16
Positive
70
53
17
unclear
11
7
4
Negative
58
46
12
Positive
63
38
25
Negative
81
61
20
Positive
32
18
14
suspect
8
5
3
≤15%
43
30
13
>15%
52
32
20
Negative
46
29
17
Positive
15
10
5
Negative
42
32
10
Positive
52
29
23
0.024
Grade
0.215
progesterone receptor (PR) status or human epidermal
growth factor receptor 2 (HER2). Table 2, showed that
RNPC1 protein expression was significantly associated
with lymph node metastasis (p = 0.024), mutp53 (p =
0.039) and PR (p = 0.023). There was no significant correlation between RNPC1 protein expression and patient age,
advanced clinical stages, Ki67, PCNA, CK5/6, histology, or
ER status and HER2.
ER status
0.181
PR status
0.023
Her2 status
0.117
Ki67
0.402
CK5/6
0.800
P53
0.039
RNPC1a inhibited proliferation and growth in human
breast cancer cells in vitro
To further address the functions of RNPC1 in breast cancer cells, we infected MCF-7 cells and MDA-MB-231 cells
and selected stably infected cells. The over-expressed
cell lines were named as MCF-7-RNPC1a or MB-231RNPC1a, while the matched control cell lines were named
as MCF-7-NC or MB-231-NC, respectively. The silenced
cell line was named as MCF-7-shRNPC1a or MB-231shRNPC1a, while the matched control cell lines were
named as MCF-7-SCR or MB-231-SCR, respectively. We
confirmed the expression levels using both Western blot
(Figure 2A and E) and qRT-PCR (Figure 2B and F, both
p < 0.001).
The growth of the stable cell lines over 6 days was determined using Cell counting kit (CCK-8) assay. As shown in
Figure 2C and Figure 2D, RNPC1a overexpression led to
significantly decreased cell proliferation (p < 0.05), while
RNPC1a knockdown led to significantly increased cell
proliferation (Figure 2G and H, both p < 0.05). To further
study the mechanism by which RNPC1a overexpression
or knockdown affected proliferation, cell cycle progression
was analyzed using flow cytometry. MCF-7-RNPC1a cells
showed a delayed G1 phase compared to MCF-7-NC
cells (65.28 ± 1.495 vs 54.28 ± 1.121) (Figure 3B, p <
0.05), while MB-231-RNPC1a cells also showed a delayed
G1 phase compared to MB-231-NC cells (37.74 ± 2.559 vs
Xue et al. BMC Cancer 2014, 14:322
/>
Page 7 of 13
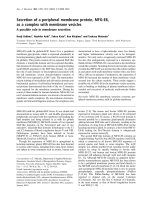
Figure 2 Effect of RNPC1a on proliferation and growth of breast cancer cell lines MCF-7 and MB-231. (A) Western blot and (B) qRT-PCR
were used to verify the efficiency of RNPC1a overexpression. The fold change of RNPC1a protein is shown below each lane. The intensity of the
bands was determined using densitometric analysis. (C, D) The growth of cells over 6 days was measured using cell counting kit (CCK-8) assays.
RNPC1a indicates RNPC1a overexpressing MCF-7 and MB-231 cells; NC indicates MCF-7 and MB-231 cells transfected with a vector-expressing
GFP. The proliferation rate of MCF-7-RNPC1a and MB-231-RNPC1a was significantly decreased compared with control cells, respectively.
Data were means of three separate experiments mean ± SEM, p < 0.05. (E) Western blot and (F) qRT-PCR were used to verify the efficiency of
RNPC1a-knockdown. The fold change of RNPC1a protein is shown below each lane. The intensity of the bands was determined using
densitometric analysis. (G, H) MCF-7-shRNPC1a and MB-231-shRNPC1a were significantly increased compared with control cells, respectively.
Data were means of three separate experiments mean ± SEM,*p < 0.05, ***p < 0.001.
28.44 ± 1.033) (Figure 3B, p < 0.05). RNPC1a overexpression inhibited the proliferation of breast cancer cells
via a delay in cell cycle progression. We obtained the similar results in RNPC1a knockdown MCF-7 (Additional
file 2: Figure S2).
Since anchorage-independent growth is strongly correlated with tumorigenicity [33]. The ability of MCF-7 or
MB-231 cell lines to form colonies was much fewer
when RNPC1a was over-expressed (Figure. 3C, p < 0.05).
The ability of MCF-7 or MB-231 cell lines to form colonies was much more when RNPC1a was knockdown
(Figure. 3D, p < 0.05).
RNPC1a suppressed migratory and invasive potential
As shown in Figure 4A and C, determined by their migration in the wound gap after 18 h, distance migrated of
Xue et al. BMC Cancer 2014, 14:322
/>
Page 8 of 13
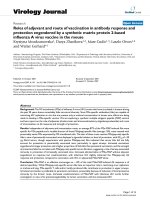
Figure 3 RNPC1a suppressed anchorage dependent growth of breast cancer cells. (A, B) Cell cycle progression was measured using flow
cytometry. The progression of MCF-7-RNPC1a and MB-231-RNPC1a cells was arrest in the G1 phase compared with control cells, respectively.
Representative photographs (upper) and quantification (lower) are shown. (C) The growth of cells over 15 days was measured using colony
formation assays. Clone formation of RNPC1a overexpression arbitrarily set at 100% in control cells (NC). The number and size of MCF-7-RNPC1a
or MB-231-RNPC1a was significantly decreased compared to control cells, respectively. Representative photographs (lower) and quantification
(upper) are shown. Data were means of three separate experiments mean ± SEM, p < 0.05. (D) Clone formation of RNPC1a knockdown arbitrarily
set at 100% in knockdown (shRNPC1a) cells. The number and size of MCF-7-shRNPC1a or MB-231-shRNPC1a was significantly increased compared
with control cells, respectively. Representative photographs (lower) and quantification (upper) are shown. Data were means of three separate
experiments mean ± SEM, p < 0.05. Colonies > 50 mm were counted. Anchorage–dependent growth assays were shown at the bottom.
Data were means of three separate experiments mean ± SEM, *p < 0.05.
RNPC1a overexpression decreased by 69 μm (Figure 4A,
p < 0.01), while RNPC1a knockdown increased by 110 μm
(Figure 4C, p < 0.01) compared to the control cells, respectively. We conducted three-dimensional cell migration assay using transwell chambers and invasion assay
with Matrigel-precoated transwell chambers. We found
that RNPC1a overexpression exhibited significantly decrease ability of migration and invasion (Figure 4B, both
p < 0.01). RNPC1a knockdown exhibited significantly increase ability of migration and invasion (Figure 4D, both
p < 0.05). Besides, we obtained the similar results of MCF7 cells (Additional files 3: Figure S3).
RNPC1a down-regulate mutp53 and up-regulate p21
protein expression in breast cancer cells
Previous study affirmed that translational of wild-type
p53 (wtp53) was repressed by RNPC1a [17]. However,
our study found wtp53 protein was no significantly altered in RNPC1a over-expressed or silent MCF-7 cells
(Figure 5A). Level of p21 protein was increased in RNPC1a
Xue et al. BMC Cancer 2014, 14:322
/>
Page 9 of 13
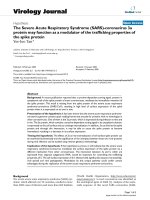
Figure 4 RNPC1a significantly decreased migratory and invasive potential of breast cancer cells. (A, C) Wound healing assay. Images of
wound repair were taken at 0, 18 h after wound. The distance of wound closure is shown by area at 18 h. Representative photographs (upper)
and quantification (lower) are shown, original magnification, ×200. (B, D) Transwell migration assay and Matrigel invasion assay. Representative
photographs (upper) and quantification (lower) are shown. Columns: average of three independent experiments, *p < 0.05, **p < 0.01, original
magnification, ×200.
over-expressed MCF-7 and MDA-MB-231 cells (Figure 5A
and B). Mutp53 protein was decreased in RNPC1a
over-expressed MDA-MB-231 cells. When RNPC1a was
silenced, p21 protein was decreased in MCF-7 and MDAMB-231 cells, while mutp53 was increased (Figure 5B).
RNPC1a up-regulate E-cadherin and down-regulate
vimentin protein expression in breast cancer cells
We observed that the RNPC1a knockdown in MCF-7 cells
led to a spindle-shaped fibroblastic morphology. This morphological change might suggest the phenotypic change of
Xue et al. BMC Cancer 2014, 14:322
/>
Page 10 of 13
Figure 5 RNPC1a regulated p53, p21, E-cadherin and vimentin in breast cancer cell. (A) RNPC1a positively regulated p21, while there was
no significantly correlation was found between RNPC1a and wtp53 in MCF-7 cells. (B) RNPC1a positively regulated p21, while negatively regulated
mutp53 in MDA-MB-231 cells. (C) RNPC1a positively regulated E-cadherin, while negatively regulated Vimentin in MDA-MB-231 cells. (D) RNPC1a
positively regulated of E-cadherin, while there was no significantly correlation was found between RNPC1a and Vimentin in MCF-7 cells. The fold
change of RNPC1a is shown below each lane. Arbitrarily set at 1.0 in control cells. The intensity of the bands was determined using
densitometric analysis.
EMT. In addition, RNPC1a over-expressed MDA-MB-231
cells lost their fibroblast-like morphology, which was accompanied by a cobblestone-like epithelial morphology
(data not shown). As shown in Figure 5C and Figure 5D
the levels of E-cadherin expression was increased in the
RNPC1a over-expressed cells, while decreased in the
RNPC1a knockdown cells. The levels of Vimentin expression was increased in the RNPC1a knockdown MDA-MB231 cells, while decreased in the RNPC1a over-expressed
cells in MDA-MB-231. But MCF-7 cells were not obviously changed in the protein level of the mesenchymal
markers such as Vimentin.
RNPC1a suppressed tumorigenesis in nude mice
To evaluate the tumor-suppressive functions of RNPC1a
in vivo, tumorigenicity of MDA-MB-231 cells expressing
RNPC1a was evaluated in nude mice. Over-expressed
RNPC1a and control cells were injected into mammary fat
pads of the mice. Control cells were discovered tumors
after 2 weeks, while tumors derived from over-expressed
RNPC1a cells were discovered after 4 weeks (Figure 6A,
p < 0.05). RNPC1a over-expressed cells formed smaller
tumor volume and weight compared to the control cells
(Figure 6B, p < 0.01).
Discussion
This study focused on the biological functions of RNPC1
and its potential clinical value in breast cancer. Among the
seven breast cell lines analyzed, RNPC1 was found to be
lower expressed in breast cancer cells compared to breast
epithelial cells. It implied a suppressive function of RNPC1
in breast cancer. Consistent with this, overexpression of
RNPC1 could reduce, whereas knockdown of RNPC1
could accelerate growth rate and number of colonies formation of breast cancer cells. In cancer, proliferation is
mostly driven by altered cell cycle progression, apoptosis,
or both [34]. Other studies reported that overexpression of
RNPC1 could induce cell cycle arrest in G1 in colon cancer RKO [11] and osteosarcoma U2OS [29]. Cell cycle arrest in G1 was also observed in RNPC1 expressed breast
cancer cells. Conversely, RNPC1 knockdown induced cell
cycle progression. Meanwhile, we observed that p21 was
changed concomitantly with RNPC1, suggesting RNPC1
in part induce cell cycle arrest in G1 via binding to and
stabilizing p21 transcript [11,35]. Further in vivo data finally supported the suppressive function of RNPC1 in
breast cancer cells. RNPC1 over-expressed MDA-MB-231
formed smaller tumor in nude mice compared to the control cell. These results were well consisted with experimental data both in vitro and in vivo.
Xue et al. BMC Cancer 2014, 14:322
/>
Figure 6 RNPC1a suppressed tumor growth in nude mice.
(A) RNPC1a over expressed (RNPC1a) MDA-MB-231 cells formed
smaller tumor volume compared to the control cells (NC).
(B) RNPC1a overexpression reduced tumor weight compared to
the control cells (NC). Data were means of experiments mean ± SEM,
*p < 0.05, **p < 0.01.
Motility and invasion are the major events in metastasis
of cancer [36]. In recent years, epithelial-mesenchymal
transition (EMT) has been proved to be an important step
during the progress from primary tumor to metastases
[37,38]. EMT is required for normal mammary gland
development [39] and breast cancer progression [40].
Among the tested cell lines, RNPC1 barely expressed in
mesenchymal phenotype breast cancer cell lines compared
to the epithelial breast cancer cell lines. We also observed
that MDA-MB-231 cells lost their fibroblast-like morphology, when RNPC1 was over-expressed, and transformed
to a cobblestone-like epithelial morphology. Inspiring of
that, we supposed that RNPC1 might inhibit migration
and invasion of breast cancer cells by regulating EMT. By
regulating RNPC1 expression, we found E-cadherin was
Page 11 of 13
promoted in the RNPC1 overexpression breast cancer cell
lines, whereas Vimentin level was reduced.
Mutations of p53 tumor suppressor was often highly
expressed and has a long half-life in various tumor [41].
Mutp53, is the commonest genetic variation detected in
primary breast cancer [42], which has various types of
functions requiring therapeutic targeting [43]. Former
study found RNPC1 and wtp53 were negative feedback
loop [17]. RNPC1 overexpression inhibited mutp53 in
colon cancer [17]. We first reported that RNPC1 overexpression decreased mutp53 protein expression in
breast cancer. Mutp53 could induce partial EMT-like
transitions reflected in the ability to suppress Ecadherin synthesis [44,45]. It implied that mutp53 may
participate in RNPC1 regulated process of EMT. The
mechanisms about how RNPC1 regulate transcriptional
factors to inhibit EMT are requiring more investigation
in the future.
Based on clinical samples, we observed that RNPC1 was
widely expressed in non-cancerous normal breast tissues
but frequently down-regulated in breast cancer tissue,
consisting with the in vitro data. The clinic RNPC1 low
expression may be explained by promoter hypermethylation correlates with wtp53 status [30]. By analyzing the
clinic data from 121 pairs of specimens, we found significantly negative correlation between RNPC1 mRNA expression and mutp53, clinical stages; significantly negative
correlation between RNPC1 protein expression and lymphonode metastasis; significantly positive correlation between RNPC1 protein expression and PR. The same trend
was also found between RNPC1 and mutp53protein.
These results were well consisted with experimental data
both in vitro and in vivo.
Since RNPC1 is one of p53’s targets, the level of
RNPC1 in breast cancer may depend on the p53 status.
Thus, it is also possible that the correlation between
RNPC1 mRNA and clinical stages actually represents
the correlation between the p53 status and clinical
stages. Just like ER regulating PR pathway, and both of
them making the most important molecular markers of
breast cancer, RNPC1 could develop to a novel molecular maker as a downstream factor of p53.
Conclusions
In summary, RNPC1 was frequently loss or low-expressed
in breast cancer. RNPC1 inhibits breast cancer cells proliferation and further suppressed tumor-cell migration and
invasion. RNPC1 significantly negative correlated between
RNPC1 protein and mutp53, lymphonode metastasis, clinic
stage. It suggested RNPC1 acting as a functional tumor
suppressor in breast tumorigenesis and metastasis. RNPC1
may become a potential marker in the therapeutic or prognostic practice of breast cancer.
Xue et al. BMC Cancer 2014, 14:322
/>
Additional files
Additional file 1: Table S1. RNPC1a shRNA sequences. Figure S1.
Identification of stably transfected MCF-7 and MB-231 cells. (A, C)
Western blot was used to verify the efficiency of knockdown. The cells
transduced with the three shRNAs and one control shRNA are designated
as ‘sh1’, ‘sh2’, ‘sh3’ and ‘SCR’. RNPC1a-knockdown MCF-7 and MB-231 cells
had 85% lower expression when compared with SCR cells. The fold
change of RNPC1a is shown below each lane. Arbitrarily set at 1.0 in
control cells. The intensity of the bands was determined using
densitometric analysis. (B, D) qRT-PCR was used to detect RNPC1a
expression. The results are similar to those seen in the Western blot analyses.
Data were means of two separate experiments mean ± SEM, * p < 0.05.
Additional file 2: Figure S2. Cell cycle was progress in RNPC1a
knockdown MCF-7 cells. (A) The progression of MCF-7-SCR cells was more
arrested in the G1 phase compared to MCF-7-shRNPC1a cells.
(B) Histogram of cell cycle analyses. Data were means of three separate
experiments mean ± SEM, *p < 0.05.
Additional file 3: Figure S3. RNPC1a decreased migration and invasion
in MCF-7 cells. (A) The number of migrating and invading cells was
higher in MCF-7-NC than the MCF-7-RNPC1a cells. (B) The number of
migrating and invading cells was lower in MCF-7-SCR than the MCF-7shRNPC1a cells. Data presented average number of cells/field for three
fields. (C, D) Columns: average data of three independent experiments,
mean ± SEM, *p < 0.05, ***p < 0.001.
Competing interests
The authors declare that have no competing interests.
Authors’ contributions
QD and J-QX have contributed to the conception and design of the study,
T-SX performed the analysis and interpretation of data, as well as final
approval of the version to be submitted. X-QL and WZ participated in the
design of the study, performed the statistical analysis, drafted and revised
the article. LC, LS, YW performed the experimental study. All authors read
and approved the final version of manuscript.
Page 12 of 13
9.
10.
11.
12.
13.
14.
15.
16.
17.
18.
19.
20.
21.
22.
Acknowledgements
This work was financially supported by the Natural Science Foundation of
China (81272916 and 81202077), the Natural Science Foundation of Jiangsu
Province (BK2011855), the key projects of Jiangsu Provincial Health Office (to
Qiang Ding), the Project of Jiangsu Province Traditional Chinese medicine
bureau (LZ11084), the Six Talents Peak projects of Jiangsu province (IB09),
and a project Funded by the Priority Academic Program Development of
Jiangsu higher Education Institutions (PAPD).
24.
Received: 5 November 2013 Accepted: 29 April 2014
Published: 7 May 2014
25.
References
1. Smith RA, Cokkinides V, Brooks D, Saslow D, Brawley OW: Cancer screening
in the United States, 2010 A Review of Current American Cancer Society
Guidelines and Issues in Cancer Screening. CA Cancer J Clin 2010,
60(2):99–119.
2. Siegel R, Naishadham D, Jemal A: Cancer statistics, 2013. CA Cancer J Clin
2013, 63(1):11–30.
3. Feinberg AP, Tycko B: The history of cancer epigenetics. Nat Rev Cancer
2004, 4(2):143–153.
4. Kim MY, Hur J, Jeong S: Emerging roles of RNA and RNA-binding protein
network in cancer cells. BMB Rep 2009, 42(3):125–130.
5. Krecic AM, Swanson MS: hnRNP complexes: composition, structure, and
function. Curr Opin Cell Biol 1999, 11(3):363–371.
6. Dreyfuss G, Matunis MJ, Pinol-Roma S, Burd CG: hnRNP proteins and the
biogenesis of mRNA. Annu Rev Biochem 1993, 62:289–321.
7. Audic Y, Hartley RS: Post-transcriptional regulation in cancer. Biol Cell
2004, 96(7):479–498.
8. Yisraeli JK: VICKZ proteins: a multi-talented family of regulatory
RNA-binding proteins. Biol Cell 2005, 97(1):87–96.
23.
26.
27.
28.
29.
Li HJ, Watford W, Li CL, Parmelee A, Bryant MA, Deng CX, O'Shea J, Lee SB:
Ewing sarcoma gene EWS is essential for meiosis and B lymphocyte
development. J Clin Invest 2007, 117(5):1314–1323.
Sonenberg N, Hinnebusch AG: New modes of translational control in
development, behavior, and disease. Mol Cell 2007, 28(5):721–729.
Shu L, Yan W, Chen X: RNPC1, an RNA-binding protein and a target of
the p53 family, is required for maintaining the stability of the basal and
stress-induced p21 transcript. Genes Dev 2006, 20(21):2961–2972.
Yan W, Zhang J, Zhang Y, Jung YS, Chen X: p73 expression is regulated by
RNPC1, a target of the p53 family, via mRNA stability. Mol Cell Biol 2012,
32(13):2336–2348.
Cho SJ, Zhang J, Chen X: RNPC1 modulates the RNA-binding activity of,
and cooperates with, HuR to regulate p21 mRNA stability. Nucleic Acids
Res 2010, 38(7):2256–2267.
Yin T, Cho SJ, Chen X: RNPC1, an RNA-binding protein and a p53 target,
regulates macrophage inhibitory cytokine-1 (MIC-1) expression through
mRNA stability. J Biol Chem 2013, 288(33):23680–23686.
Zhang J, Jun Cho S, Chen X: RNPC1, an RNA-binding protein and a target
of the p53 family, regulates p63 expression through mRNA stability.
Proc Natl Acad Sci U S A 2010, 107(21):9614–9619.
Xu E, Zhang J, Chen X: MDM2 expression is repressed by the RNA-binding
protein RNPC1 via mRNA stability. Oncogene 2013, 32(17):2169–2178.
Zhang J, Cho SJ, Shu L, Yan W, Guerrero T, Kent M, Skorupski K, Chen H,
Chen X: Translational repression of p53 by RNPC1, a p53 target
overexpressed in lymphomas. Genes Dev 2011, 25(14):1528–1543.
Miyamoto S, Hidaka K, Jin D, Morisaki T: RNA-binding proteins Rbm38 and
Rbm24 regulate myogenic differentiation via p21-dependent and
-independent regulatory pathways. Genes Cells 2009, 14(11):1241–1252.
Zheng SL, Xu JF, Isaacs SD, Wiley K, Chang BL, Bleecker ER, Walsh PC, Trent
JM, Meyers DA, Isaacs WB: Evidence for a prostate cancer linkage to
chromosome 20 in 159 hereditary prostate cancer families. Hum Genet
2001, 108(5):430–435.
Bar-Shira A, Pinthus JH, Rozovsky U, Goldstein M, Sellers WR, Yaron Y, Eshhar
Z, Orr-Urtreger A: Multiple genes in human 20q13 chromosomal region
are involved in an advanced prostate cancer xenograft. Cancer Res 2002,
62(23):6803–6807.
Tanner MM, Grenman S, Koul A, Johannsson O, Meltzer P, Pejovic T, Borg A,
Isola JJ: Frequent amplification of chromosomal region 20q12-q13 in
ovarian cancer. Genes Cells 2000, 6(5):1833–1839.
Korn WM, Yasutake T, Kuo WL, Warren RS, Collins C, Tomita M, Gray J,
Waldman FM: Chromosome arm 20q gains and other genomic
alterations in colorectal cancer metastatic to liver, as analyzed by
comparative genomic hybridization and fluorescence in situ
hybridization. Genes Chromosomes Cancer 1999, 25(2):82–90.
Knosel T, Schluns K, Stein U, Schwabe H, Schlag PM, Dietel M, Petersen I:
Genetic imbalances with impact on survival in colorectal cancer patients.
Histopathology 2003, 43(4):323–331.
Krackhardt AM, Witzens M, Harig S, Hodi FS, Zauls AJ, Chessia M, Barrett P,
Gribben JG: Identification of tumor-associated antigens in chronic
lymphocytic leukemia by SEREX. Blood 2002, 100(6):2123–2131.
Carvalho B, Postma C, Mongera S, Hopmans E, Diskin S, van de Wiel MA,
van Criekinge W, Thas O, Matthaei A, Cuesta MA, Droste JST, Craanen M,
Schroeck E, Ylstra B, Meijer GA: Multiple putative oncogenes at the
chromosome 20q amplicon contribute to colorectal adenoma to
carcinoma progression. Gut 2009, 58(1):79–89.
Hotte GJ, Linam-Lennon N, Reynolds JV, Maher SG: Radiation sensitivity of
esophageal adenocarcinoma: the contribution of the RNA-binding
protein RNPC1 and p21-mediated cell cycle arrest to radioresistance.
Radiat Res 2012, 177(3):272–279.
Ginestier C, Cervera N, Finetti P, Esteyries S, Esterni B, Adelaide J, Xerri L,
Viens P, Jacquemier J, Charafe-Jauffret E, Chaffanet M, Birnbaum D, Bertucci
F: Prognosis and gene expression profiling of 20q13-amplified breast
cancers. Clin Cancer Res 2006, 12(15):4533–4544.
Letessier A, Sircoulomb F, Ginestier C, Cervera N, Monville F, Gelsi-Boyer V,
Esterni B, Geneix J, Finetti P, Zemmour C, Viens P, Charafe-Jauffret E,
Jacquemier J, Birnbaum D, Chaffanet M: Frequency, prognostic impact,
and subtype association of 8p12, 8q24, 11q13, 12p13, 17q12, and 20q13
amplifications in breast cancers. BMC Cancer 2006, 6(1):245.
Feldstein O, Ben-Hamo R, Bashari D, Efroni S, Ginsberg D: RBM38 is a direct
transcriptional target of E2F1 that limits E2F1-induced proliferation.
Mol Cancer Res 2012, 10(9):1169–1177.
Xue et al. BMC Cancer 2014, 14:322
/>
Page 13 of 13
30. Leveille N, Elkon R, Davalos V, Manoharan V, Hollingworth D, Oude Vrielink
J, le Sage C, Melo CA, Horlings HM, Wesseling J, Ule J, Esteller M, Ramos A,
Agami R: Selective inhibition of microRNA accessibility by RBM38 is
required for p53 activity. Nat Commun 2011, 2:513.
31. Zheng MJ, Wang J, Chen YW, Xu L, Xue DD, Fu W, Zhang YF, Du Q, Zhao Y,
Ling LJ, Ding Q, Liu XA, Zha XM, Zheng W, Xia TS, Wang S: A novel mouse
model of gastric cancer with human gastric microenvironment.
Cancer Lett 2012, 325(1):108–115.
32. Pan H, Zhou W, He W, Liu X, Ding Q, Ling L, Zha X, Wang S: Genistein
inhibits MDA-MB-231 triple-negative breast cancer cell growth by
inhibiting NF-kappaB activity via the Notch-1 pathway. Int J Mol Med
2012, 30(2):337–343.
33. Colburn NH, Bruegge WF, Bates JR, Gray RH, Rossen JD, Kelsey WH, Shimada
T: Correlation of anchorage-independent growth with tumorigenicity
of chemically transformed mouse epidermal cells. Cancer Res 1978,
38(3):624–634.
34. Evan GI, Vousden KH: Proliferation, cell cycle and apoptosis in cancer.
Nature 2001, 411(6835):342–348.
35. Cho SJ, Jung YS, Zhang J, Chen X: The RNA-binding protein RNPC1
stabilizes the mRNA encoding the RNA-binding protein HuR and
cooperates with HuR to suppress cell proliferation. J Biol Chem 2012,
287(18):14535–14544.
36. Stetler-Stevenson WG, Aznavoorian S, Liotta LA: Tumor cell interactions
with the extracellular matrix during invasion and metastasis. Annu Rev
Cell Biol 1993, 9:541–573.
37. Thiery JP, Sleeman JP: Complex networks orchestrate epithelialmesenchymal transitions. Nat Rev Mol Cell Biol 2006, 7(2):131–142.
38. Kang Y, Massague J: Epithelial-mesenchymal transitions: twist in
development and metastasis. Cell 2004, 118(3):277–279.
39. Simian M, Hirai Y, Navre M, Werb Z, Lochter A, Bissell MJ: The interplay of
matrix metalloproteinases, morphogens and growth factors is necessary
for branching of mammary epithelial cells. Development 2001,
128(16):3117–3131.
40. Wiseman BS, Werb Z: Stromal effects on mammary gland development
and breast cancer. Science 2002, 296(5570):1046–1049.
41. Brosh R, Rotter V: When mutants gain new powers: news from the
mutant p53 field. Nat Rev Cancer 2009, 9(10):701–713.
42. Bartek J, Iggo R, Gannon J, Lane DP: Genetic and immunochemical
analysis of mutant p53 in human breast cancer cell lines. Oncogene 1990,
5(6):893–899.
43. Maslon MM, Hupp TR: Drug discovery and mutant p53. Trends Cell Biol
2010, 20(9):542–555.
44. Wang SP, Wang WL, Chang YL, Wu CT, Chao YC, Kao SH, Yuan A, Lin CW,
Yang SC, Chan WK, Li KC, Hong TM, Yang PC: p53 controls cancer cell
invasion by inducing the MDM2-mediated degradation of Slug. Nat Cell
Biol 2009, 11(6):694–704.
45. Kogan-Sakin I, Tabach Y, Buganim Y, Molchadsky A, Solomon H, Madar S,
Kamer I, Stambolsky P, Shelly A, Goldfinger N, Valsesia-Wittmann S, Puisieux
A, Zundelevich A, Gal-Yam EN, Avivi C, Barshack I, Brait M, Sidransky D,
Domany E, Rotter V: Mutant p53(R175H) upregulates Twist1 expression
and promotes epithelial-mesenchymal transition in immortalized
prostate cells. Cell Death Differ 2011, 18(2):271–281.
doi:10.1186/1471-2407-14-322
Cite this article as: Xue et al.: RNA-binding protein RNPC1: acting as a
tumor suppressor in breast cancer. BMC Cancer 2014 14:322.
Submit your next manuscript to BioMed Central
and take full advantage of:
• Convenient online submission
• Thorough peer review
• No space constraints or color figure charges
• Immediate publication on acceptance
• Inclusion in PubMed, CAS, Scopus and Google Scholar
• Research which is freely available for redistribution
Submit your manuscript at
www.biomedcentral.com/submit