Loss of MTUS1/ATIP expression is associated with adverse outcome in advanced bladder carcinomas: Data from a retrospective study
Bạn đang xem bản rút gọn của tài liệu. Xem và tải ngay bản đầy đủ của tài liệu tại đây (2.45 MB, 14 trang )
Rogler et al. BMC Cancer 2014, 14:214
/>
RESEARCH ARTICLE
Open Access
Loss of MTUS1/ATIP expression is associated with
adverse outcome in advanced bladder
carcinomas: data from a retrospective study
Anja Rogler1, Sabine Hoja1, Johannes Giedl1, Arif B Ekici2, Sven Wach3, Helge Taubert3, Peter J Goebell3,
Bernd Wullich3, Michael Stöckle4, Jan Lehmann5, Sabrina Petsch6, Arndt Hartmann1 and Robert Stoehr1*
Abstract
Background: Seventy percent of all bladder tumours tend to recur and need intensive surveillance, and a subset of
tumours progress to muscle-invasive and metastatic disease. However, it is still difficult to find the adequate treatment
for every individual patient as it is a very heterogeneous disease and reliable biomarkers are still missing. In our study
we searched for new target genes in the critical chromosomal region 8p and investigated the potential tumour
suppressor gene candidate MTUS1/ATIP in bladder cancer.
Methods: MTUS1 was identified to be the most promising deleted target gene at 8p in aCGH analysis with 19 papillary
bladder tumours. A correlation with bladder cancer was further validated using immunohistochemistry of 85 papillary and
236 advanced bladder tumours and in functional experiments. Kaplan-Meier analysis and multivariate Cox-regression
addressed overall survival (OS) and disease-specific survival (DSS) as a function of MTUS1/ATIP expression. Bivariate
correlations investigated associations between MTUS1/ATIP expression, patient characteristics and histopathology. MTUS1
expression was analysed in cell lines and overexpressed in RT112, where impact on viability, proliferation and migration
was measured.
Results: MTUS1 protein expression was lost in almost 50% of all papillary and advanced bladder cancers. Survival,
however, was only influenced in advanced carcinomas, where loss of MTUS1 was associated with adverse OS and DSS. In
this cohort, there was also a significant correlation of MTUS1 expression and histological subtype: positive expression was
detected in all micropapillary tumours and aberrant nuclear staining was detected in a subset of plasmocytoid urothelial
carcinomas. MTUS1 was expressed in all investigated bladder cell lines and overexpression in RT112 led to significantly
decreased viability.
Conclusions: MTUS1 is a tumour suppressor gene in cultured bladder cancer cells and in advanced bladder tumours. It
might represent one new target gene at chromosome 8p and can be used as an independent prognostic factor for
advanced bladder cancer patients. The limitation of the study is the retrospective data analysis. Thus, findings should be
validated with a prospective advanced bladder tumour cohort.
Keywords: MTUS1, ATIP, Bladder cancer, Chromosome 8p deletions
* Correspondence:
1
Institute of Pathology, University Hospital Erlangen, Krankenhausstr. 8-10,
91054 Erlangen, Germany
Full list of author information is available at the end of the article
© 2014 Rogler et al.; licensee BioMed Central Ltd. This is an Open Access article distributed under the terms of the Creative
Commons Attribution License ( which permits unrestricted use, distribution, and
reproduction in any medium, provided the original work is properly credited. The Creative Commons Public Domain
Dedication waiver ( applies to the data made available in this article,
unless otherwise stated.
Rogler et al. BMC Cancer 2014, 14:214
/>
Background
For bladder cancer, it is still difficult to predict disease
progression and outcome for every individual patient as
reliable biomarkers are missing. In the past few years
many studies were published, which investigated new potential progression-associated factors [1-5], however prospective validation studies are needed.
For example, aberrantly methylated TBX4 was identified
as a novel potential marker for disease progression [1] and
Cathepsin E, Maspin, Plk1 and Survivin were proposed as
new markers for progression in non-muscle-invasive bladder cancer [2]. Also an involvement of mTOR signalling
pathway, as assessed by S6 protein phosphorylation, seems
to be associated with increased disease recurrence, progression and worse disease specific survival [3]. Munksgaard
et al. could identify one hitherto unknown gene, ANXA10,
which was correlated with shorter progression-free survival
when expressed at low levels [4]. Using whole exome next
generation sequencing technique, Gui et al. were able to
detect for the first time mutations in chromatin remodeling
genes, like UTX and MLL, which were associated with
bladder cancer [5]. Deletions on chromosome 8p are also a
hallmark of bladder cancer and seem to be associated with
more advanced tumour stage and increased tumour progression [6,7]. We previously found allelic loss on chromosome 8p in 25% of all investigated bladder cancers, which
was significantly correlated with invasive tumour growth
and with papillary growth pattern. In this context, the
SFRP1 gene was identified as one potential progression
marker at 8p in bladder cancer [8].
The aim of the present study was, to identify new target
genes at chromosome 8p, which are affected by chromosomal deletions and which may play a role in general
tumour development, progression and outcome of bladder
cancer patients.
Therefore, we analysed 9 pTa and 10 pT1 papillary bladder tumours in high-resolution array-based comparative
genomic hybridization (aCGH). One promising candidate
gene, MTUS1, was selected for further analysis.
Methods
Patient cohorts and tumour specimen
For aCGH analysis 9 papillary pTa and 10 papillary pT1
cryo-conserved tumours were randomly chosen from the
tissue bank of the Comprehensive Cancer Center ErlangenEMN located at the Institute of Pathology in Erlangen and
DNA was isolated as described below. Tissue specimens
were investigated by frozen section and all specimens contained at least 80% tumour cells.
Tissue micro arrays (TMAs) of two different bladder
cancer patient cohorts were used for immunohistochemical analysis of MTUS1: group 1 consisted of 85 patients
with non-muscle invasive (pTa or pT1) papillary tumours
and group 2 of 236 patients with advanced bladder
Page 2 of 14
tumours (≥ pT3 and/or pN1), who all underwent radical
cystectomy and received adjuvant chemotherapy. TMAs
of the advanced tumour group were available at the Institute of Pathology Erlangen resulting from a previous
prospective study [9], originally consisting of 327 patients. Due to tissue availability only a subgroup of 236
patients of the initial cohort was analysed. For this
study IRB approval was obtained from the German Association of Urological Oncology (AUO) as well as informed written consent was obtained from all patients
of participating local centers and clinics. All relevant
patient characteristics and clinico- and histopathological parameters were summarized previously [9].
Papillary bladder tumours were newly assembled for this
study from the tumour bank of the Comprehensive Cancer
Center Erlangen-EMN located at the Institute of Pathology
in Erlangen. Formalin-fixed and paraffin-embedded tumour
tissues and corresponding haematoxylin-eosin stained sections were selected, tumour areas were marked and reevaluated according to histopathological stage and grade by
two experienced surgical pathologists (AH, JG). Clinical
Follow-up data for the papillary tumour group were obtained in collaboration with the Tumorzentrum (TUZ)
Erlangen.
Informed written consent was obtained from all patients
of the papillary tumour group as well as from aCGH
tumour patients, and we obtained approval from the Clinical Ethics Committee of the University Hospital Erlangen
for retrospective use of patient material in the context of
the Comprehensive Cancer Center-tissue bank.
All relevant patient characteristics, histopathological
data and follow-up are shown in Table 1. Additional characteristics of the advanced bladder cancer cohort, used for
adjusting to multivariate Cox-regression are shown in
Table 2.
Cell lines and transfection
For functional analysis of MTUS1-expression, the bladder
cancer cell lines RT112, RT4, J82 and BFTC905 [10-13] as
well as the two presumably normal urothelial cell lines
UROtsa and HCV29 were screened using qRT-PCR and
Westernblot analysis. UROtsa was isolated from a primary
culture of normal human urothelium and immortalized
with a construct containing SV40 large T antigen [14]. For
HCV29 various characterizations can be found in literature. Riesenberg et al. describes HCV29 as non-malignant
cell line of the ureter region [15], whereas other groups
designate it as pre-malignant or even malignant cell line
[16-18]. Thus, it seems more appropriate to term these apparently normal cell lines UROtsa and HVC29 as immortal
urothelial cell lines with no or low malignant potential.
Cells were cultured in RPMI medium supplemented with
10% fetal calf serum (FCS), 1% sodium-pyruvate and 1% Lglutamine at 37°C and 5% CO2. The prostate carcinoma
Rogler et al. BMC Cancer 2014, 14:214
/>
Page 3 of 14
Table 1 Patient characteristics
Patients
Age
aCGH bladder tumour cohort
Papillary bladder tumour cohort
Advanced bladder tumour cohort
n = 19
n = 85
n = 236
Mean: 69.3 years
Mean: 70 years
Mean: 63 years
Median: 68 years
Median: 71 years
Median: 63.5 years
(± 9.9 years)
(± 11.6 years)
(± 8.4 years)
Range: 53 – 95 years
Range: 29–97 years
Range: 38–81 years
Female: n = 5
Female: n = 22
Male: n = 14
Male: n = 63
n.a. n = 4
Gender
Female: n = 56
Male: n = 177
n.a. n = 3
Stage
pTa n = 9
PUNLMP n = 1
pT1 n = 6
pT1 n = 10
pTa n = 47
pT2 n = 29
pT1 n = 31
pT3 n = 141
pT2 n = 4
pT4 n = 37
pT3 n = 1
n.a. n = 23
pT4 n = 1
Grade
Follow-up OS
lg n = 6
lg n = 40
G2, hg n = 28
hg n = 13
hg n = 42
G3, hg n = 203
n.a. = 3
n.a. n = 5
n.a.
Alive n = 65
Alive n = 76
Dead n = 15
Dead n = 129
n.a. n = 5
Follow-up DSS
n.a.
Alive n = 70
Alive n = 63
Dead n = 8
Dead n = 142
n.a. n =7
Abbreviations: aCGH array based comparative genomic hybridization, OS overall survival, DSS disease-specific survival.
cell line LNCaP was used as positive control for MTUS1expression [19].
Transfection was carried out in 6-well plates seeding
300 000 cells per well. After 48 hours of cell adhesion
MTUS1 was transiently overexpressed in RT112 using the
MTUS1 human cDNA clone in pCMV6-XL5 vector (Origene Technologies, Rockville/USA, SC300343, transcript
variant 1 = ATIP3) and MegaTran 1.0 transfection reagent
(Origene Technologies) with a ratio of 1:3 (DNA:MegaTran) according to manufacturer’s instructions.
DNA-, RNA isolation and cDNA synthesis
To investigate 19 bladder tumours in aCGH analysis,
tumour specimens were manually microdissected and
DNA was isolated using the QIAamp DNA Mini Kit (Qiagen, Hilden/Germany) according to manufacturer’s protocol. To analyse MTUS1 gene expression with qRT-PCR,
RNA was isolated using RNeasy® Mini Kit (Qiagen) and
cDNA was converted using the RevertAid™ H Minus First
Strand cDNA Synthesis Kit (Fermentas Life Sciences, St.
Leon-Rot/Germany) according to manufacturer’s instructions. For cDNA-synthesis 1 μg total RNA was used.
DNA- and RNA-quality was controlled using the Multiplate Reader Synergy 2 (BioTek, Bad Friedrichshall/
Germany).
aCGH analysis
DNA of 19 papillary bladder tumours (500 ng each) was
investigated for chromosomal alterations and copy
number changes with array-based comparative genomic
hybridization (aCGH) using Genome-Wide SNP Array
6.0 (Affymetrix, Munich/Germany) according to manufacturer’s protocol. Array chips were scanned with GeneChip Scanner 3000 7G. Hybridization was performed
at the IZKF Z3 Core Unit Genomics of the Institute of
Human Genetics in Erlangen. Data analysis was performed with Genotyping Console (Affymetrix). Tumour
DNAs were compared with DNAs from 167 anonymous
healthy controls, which were provided by the IZKF Z3
Core Unit Genomics.
qRT-PCR
To analyse MTUS1 wildtype mRNA expression in cell
lines and to control overexpression of MTUS1 in RT112,
Rogler et al. BMC Cancer 2014, 14:214
/>
Page 4 of 14
Table 2 Additional characteristics of the advanced
bladder cancer cohort, used for adjusting to multivariate
Cox-regression
Histological variant (n)
Common urothelial carcinoma
201
Plasmocytoid urothelial carcinoma
17
Micropapillary urothelial carcinoma
10
n.a.
8
Type of adjuvant chemotherapy (n)
Gemcitabine-cisplatin
55
Mono gemcitabine
37
MVEC
64
Cisplatin-methotrexate
74
n.a.
6
Lymph-node invasion (n)
pN0
98
pN1
45
pN2
70
pN3
1
n.a.
22
P53 expression (n)
< 5%
85
≥ 5%
133
n.a.
18
Abbreviations: n.a. not available, MVEC methotrexate, vinblastine, epirubicine,
cisplatin, n number.
SYBR Green-based quantitative real-time PCR (qRTPCR) was performed in 7500 Fast Real-time PCR-system
(Applied Biosystems, Darmstadt/Germany) with standard thermal cycling conditions. For qRT-PCR 25 ng
cDNA template, 200 nM MTUS1-Primermix (sense:
5′-AGCTTCGGGACACTTACATT-3′, antisense: 5′-A
TAGGCCTTCTTTAGCAATTC-3′), 250nM GAPDHprimermix (sense: 5′-TGGTCACCAGGGCTGCTT-3′,
antisense: 5′- AGCTTCCCGTTCTCAGCC-3′) and 6.25 μl
SYBR Green Mix (2×) was used in a total volume of 12.5 μl.
Data analysis was performed with 7500 Software v2.0.5 (Applied Biosystems) and gene-expression ratios were calculated with ΔΔCT-method [20].
FGFR3 mutation analysis
FGFR3 mutation analysis was performed as previously described [21-23]. Extended primers were separated by capillary electrophoresis in the Genetic Analyser 3500 Dx
(Applied Biosystems), and the presence or absence of a
mutation was indicated by the incorporated wildtype or
mutant labelled dideoxy nucleotide.
Western blotting
To analyze MTUS1 protein expression in cell lines, immunoblotting was performed with 30 μg total protein of
whole cell lysates after SDS-PAGE on 7.5% PAA-gels on
nitrocellulose membrane using wet blotting method with
Mini Protean® Tetra System (BioRad Laboratories, Munich/
Germany) according to manufacturer’s protocol. Membranes were blocked with Immunoblot Blocking Reagent
(Millipore, Billerica/USA) and treated with anti-MTUS1
antibody (mouse IgG clone 1C7, Abnova H00057509-M01,
1:130, 1 hour/RT, contains epitopes against ATIP1 (49 kDa),
ATIP3 (140 kDa) and ATIP4 (59 kDa)) or β-AKTIN
(mouse, Sigma-Aldrich, Taufkirchen/Germany, A5441,
1:10 000, 1 hour, RT) and HRP-conjugated secondary
antibody (goat-anti-mouse, Dianova/Jackson ImmunoResearch Laboratories, Baltimore/USA, 40 min, RT). Luminescence signal detection was performed using Immobilion
Western Chemiluminescent HRP Substrate (Millipore) according to manufacturer’s instructions with Fusion FX7
(Vilber-Lourmat, Eberhardzell/Germany). Cell lysates of
LNCaP were included as positive control.
Immunohistochemistry
Immunohistochemistry was performed on formalin-fixed,
paraffin-embedded (FFPE-) 4 μm TMA sections of tumour
tissue specimen transferred to glass slides. TMA construction was performed as described previously [24,25]. TMAs
were stained with monoclonal mouse anti-MTUS1 antibody (Abnova, Heidelberg/Germany, overnight, RT). This
was followed by incubation with secondary rabbit antimouse antibody (1:100 diluted in TRIS-buffer, DakoCytomation, Glostrup/Denmark) for 30 min at room
temperature. Then, slides were incubated for 20 min
with ABC-solution (antibody-biotin-complex VECTASTAIN® Elite ABC kit, Vector Laboratories, Burlingame/
USA), followed by a 10 min incubation with TSA-solution
(TSA™ indirect, Perkin Elmer, Waltham/Massachusetts)
and 20 min reincubation with ABC according to manufacturer’s protocols. AEC-solution (AEC Peroxidase Substrate
Kit, Vector Laboratories) was added until staining intensity was sufficient (approx. 10 min). Slides were counterstained for 2 min with haemalaun (Carl Roth, Karlsruhe/
Germany) and mounted with Aquatex (Merck, Darmstadt/
Germany).
Stainings were examined and evaluated by an experienced uropathologist (AH) and immunoreactivity (IRS =
immune reactive score) was scored as follows: Intensity
(0 = negative, 1 = weak, 2 = moderate, 3 = strong) and
number of tumour cells (in percent) was determined.
Number of stained cells was correlated to numbers from 0
to 4. No staining of cells was evaluated as 0, <10% as 1,
10-50% as 2, 51-80% as 3 and 81-100% as 4. Numbers
were multiplied with staining intensity and immunoreactive values between 0 and 12 were created. For MTUS1-
Rogler et al. BMC Cancer 2014, 14:214
/>
staining two immunoreactive groups were created: group
1 = IRS 0, group 2 = IRS 1–12.
Viability and proliferation assay
To investigate functional consequences of MTUS1 overexpression, effects on viability and proliferation were analysed. Therefore 15 000 cells per well were seeded into
white (viability) or clear (proliferation) 96-well plates in
RPMI medium. Viability and proliferation were measured
after 24 hours with CellTiter-Glo Luminescent Cell Viability Assay (Promega, Mannheim/Germany) and with the
colorimetric QIA58 BrdU Cell Proliferation Assay (Merck),
respectively, according to manufacturer’s protocol using
the Multiplate Reader Synergy 2 (BioTek).
Wound-healing assay
To analyse effects on migration, wound-healing assay was
performed using Culture-Inserts for Live Cell Analysis
(Ibidi, Martinsried/Germany) and photo documentation
with Olympus IX81 (Olympus Europe Holding, Hamburg/
Germany). Transfected and control cells were seeded in
culture-inserts with a concentration of 500 000 cells/ml
using 70 μl of cell suspension per well. After cells have
grown to a dense cell layer, inserts were removed and
growth pattern was documented photographically within
24 hours. Area of overgrown surface between transfected
cells and controls was compared using Axio Vision Rel
4.8.2 Software (Olympus Europe Holding).
Statistical analysis
For statistical analysis PASW/SPSS 19.0 (IBM, Armonk/
New York State) was used. To determine statistical significance of differences in functional cell culture experiments,
non-parametrical Kruskal-Wallis-test (for k-independent
random samples, univariate analysis of variance) was used.
To determine MTUS1-dependant survival, Kaplan-Meier
analysis was performed using Log-Rank test. Survival
probability and survival risk was determined with multivariate Cox-Regression analysis (95% CI). To correlate patient data amongst each other and to detect significant
associations, bivariate correlation with Spearman’s rhotest and Chi-square-test was performed. P-values <0.05
were considered as statistically significant.
Results
aCGH analysis
We analysed a cohort of 9 pTa and 10 pT1 papillary bladder tumours for characteristic chromosomal alterations
using aCGH.
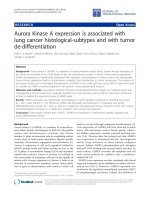
Figure 1 depicts chromosome 8 alterations in all investigated tumours in horizontal view. In general pTa tumours
(1A) had a smaller number of chromosomal alterations,
than pT1 tumours (1B). In pT1 tumours there was an increased occurrence of deletions on chromosome 8p and of
Page 5 of 14
amplifications on 8q compared to pTa tumours. To find
deleted target genes that might identify potentially progressing pTa tumours, we analysed all occurring microdeletions in pTa tumours and compared them with pT1
tumours. We found that two non-invasive tumours
showed sporadic deletions on 8p. In pT1 tumours, 6/10
tumours showed almost complete loss of whole chromosome arm 8p and 2/10 tumours showed local microdeletions. Only two pT1 tumours had no detectable deletion
on 8p. In Figure 1C and D, one representative microdeletion on chromosome 8p22 is shown. Only one pTa
tumour (11%, 1C), but five pT1 tumours (50%, 1D) were
affected by this heterozygous deletion. At this locus the
following candidate target genes were identified: SLC7a2
(solute carrier family 7, member 2), PDGFRL (platelet-derived growth factor receptor-like), MTUS1 (microtubule-associated tumour suppressor 1), FGL1 (fibrinogen-like 1)
and PCM1 (pericentriolar material 1). Thereof MTUS1
was the most promising gene, as it was previously described
to be a tumour suppressor gene in various malignancies,
e.g. pancreatic, ovarian, colon and breast carcinomas [26-29].
As there was no known association between MTUS1
and bladder cancer during time of analysis, we selected
this gene for further characterization. In the meantime
another study group also found an association between
MTUS1 expression and bladder cancer [30].
MTUS1 mRNA and protein expression in cell lines
We screened four bladder cancer cell lines (RT112, RT4,
J82 and BFTC905) as well as two presumably normal and
immortalized urothelial cell lines, UROtsa and HCV29,
for MTUS1 mRNA expression using qRT-PCR. Quantitative RT-PCR analysis revealed positive MTUS1 mRNA expression in all cell lines investigated with HCV29, RT112
and J82 having the lowest levels and UROtsa having the
highest level of all bladder cell lines (Figure 2). Expression
level of RT112 was defined as 100%.
These results were in line with western blotting results, where MTUS1 bands could be detected in all cell
lines analyzed (Figure 2B). However, depending on the
cell type, different protein bands could be detected. The
Uniprot database lists a total of 7 known protein isoforms
for MTUS1 ( />For RT112, J82, BFTC905, UROtsa and LNCaP (positive
control) a band at around 140 kDa was visible. According
to the molecular weight, this band can be attributed
to MTUS1 isoform 1 (141 kDa, ATIP3a) or isoform 2
(136 kDa, ATIP3b). A very distinct band could be observed
at ~60 kDA mainly in LNCaP, HCV29 and UROtsa cells.
According to the molecular weight, this band can be attributed to MTUS1 isoform 6 (59 kDa, ATIP4). Interestingly,
one additional band at approximately 80 kDA was detected
in all cell lines with the strongest intensity in RT4 and the
lowest in UROtsa. The origin of this band remains
Rogler et al. BMC Cancer 2014, 14:214
/>
Page 6 of 14
A
B
C
D
Figure 1 Results of aCGH analysis from 19 papillary bladder tumours. A Genotyping Console software depicts chromosomal alterations on
chromosome 8 of all pTa, 1B of all pT1 tumours that were analysed. Chromosome 8 is shown in horizontal view at the bottom of the figure. Red
triangles and shades stand for loss of genetic material, blue color indicates chromosomal gain. 1C and D show chromosomal loss at 8p22, where
MTUS1 is located, in 1/9 pTa tumours (1C) and in 5/10 pT1 tumours (1D).
unknown. Although there exists a MTUS1 isoform with a
molecular weight of 84 kDa (ATIP2), this known isoform
does not contain the protein epitope the antibody was
raised against.
Functional analysis after MTUS1 overexpression in RT112
As RT112 had the lowest expression on mRNA level of all
investigated bladder cancer cell lines, we selected this cell
line for overexpression analysis. Therefore we transiently
overexpressed MTUS1 in RT112 and analysed effects on
proliferation, viability and wound-healing after 24 hours.
For proliferation, we detected an approx. 10% reduction in
MTUS1 overexpressing RT112 cells. This reduction was
not statistically significant (p = 0.6, data not shown). However, it could be shown that viability was significantly decreased in MTUS1 overexpressing cells compared to
control RT112 cells (p = 0.002, Figure 3A). Regarding
wound-healing assay, we found that there was a distinct but
not significant difference between MTUS1 overexpressing
and wild type RT112 cells (p = 0.121). In MTUS1-overexpressing cells only 65.9% of the wound area was overgrown
after 24 hours, whereas in wild type cells already 92.4% of
the gap was closed (Figure 3B).
IHC analysis of MTUS1 expression in bladder tumours
In the papillary bladder cancer group MTUS1 expression
was lost in 50.6% of the tumours (43/85). Immunohistochemical staining showed the following distribution of
immunoreactive groups: IRS 0, n = 43; IRS 2, n = 29; IRS
4, n = 8; IRS 6, n = 3; IRS 8, n = 1; IRS 9, n = 1. MTUS1
was located in the cytoplasm, as expected. Representative examples of negative (4A, B) and positive (4C, D)
Rogler et al. BMC Cancer 2014, 14:214
/>
A
25
Relative MTUS1 expression
20
15
10
5
0
HCV29
B
RT112
J82
BFTC905
RT4
UROtsa
LNCaP
Cytoplasmatic ATP level (lum. value)
Relative gene expression
A
Page 7 of 14
70000
Viability Assay RT112
60000
50000
40000
30000
20000
10000
0
MTUS1+
ATIP3
ATIP2 ?
Control
B
ATIP4
RT112
wildtype
RT112
+ MTUS1
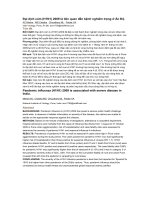
Figure 2 mRNA and protein expression of MTUS1 in cell lines.
A. Relative quantification results after qRT-PCR indicate that MTUS1 is
expressed in all cell lines investigated. Prostate cancer cell line
LNCaP, used as positive control, shows the highest expression,
HCV29, RT112 and J82 the lowest. B. Westernblot results with
anti-MTUS1 antibody. Detection of several ATIP isoforms could be
observed at 60, 80 and 140 kDa.
Figure 3 Functional effects of MTUS1 overexpression.
MTUS1 overexpression in RT112 influenced cell viability (3A) and
wound-healing (3B) significantly. RT112 cells with MTUS1
overexpression showed decreased viability and retarded
wound-healing after 24 hours compared to untreated control cells.
staining in papillary bladder carcinomas are shown in
Figure 4. Mean follow-up time was 49.5 months (median 39.1 months). Regarding overall, disease-specific,
progression-free, recurrence-free and metastasis-free
survival, no significant MTUS1-dependant differences
were found.
Interestingly a significant direct correlation between
MTUS1-expression and stage, grade, Ki67 and CK20expression was found (Figure 5). MTUS1-expressing tumours showed higher tumour grade (p = 0.005, 5A) and
stage (p = 0.004, 5B) as well as aberrant expression
of differentiation marker CK20 (p = 0.004, 5C) and proliferation marker Ki67 (p = 0.004, 5D). To prove the integrity of our papillary study cohort, we additionally
performed FGFR3 mutation analysis (representative examples SNaPshot analysis are shown in Figure 6A and
B). It is well-known that FGFR3 mutations occur predominantly in bladder tumours with papillary growth
pattern. Those mutations are connected with a lower
malignant potential of the bladder tumour as indicated
by lower tumour stage and/or grade. Therefore we correlated FGFR3 mutation status with tumour grade. The
mutation analysis revealed that the majority of our tumours (n = 54) had at least one mutation, which was
associated with non-invasive growth pattern, whereas only
27/85 tumours had FGFR3 wild type (correlated with
more invasive growth, p = 0.059, Figure 6C). Four tumours
could not be analysed in FGFR3 mutation analysis. Tumours with FGFR3 mutations showed more MTUS1 expression loss than wild type tumours (Figure 6D). This
was in line with the inverse correlations of the other histopathological parameters, as mentioned above.
In the advanced bladder tumour cohort 45.8% of the
tumours (108/236) showed loss of MTUS1 expression
and 54% (128/236) tumours were classified into IRS
group 1–12. Immunoreactivity showed the following
distribution: IRS 0, n = 108; IRS 2, n = 52; IRS 3, n = 2;
IRS 4, n = 43; IRS 6, n = 18; IRS 8, n = 5; IRS 9, n = 1 and
IRS 12 n = 7). Representative examples of positive and
negative staining of conventional advanced bladder
carcinoma are shown in Figure 7A and B. Regarding the
distribution of MTUS1 expression within different histopathological subtypes (divided into common urothelial
carcinoma (UC), plasmocytoid UC (PUC) and micropapillary UC), a significant expression difference was found
(p = 0.011). In all micropapillary tumours (n = 10) strong
positive MTUS1-expression was observed in the cytoplasm (Figure 7C). It was also striking that 8/17 PUCs
Rogler et al. BMC Cancer 2014, 14:214
/>
Page 8 of 14
A
B
200µm
50µm
100x
400x
D
C
100µm
50µm
200x
400x
Figure 4 Immunohistochemical expression of MTUS1 in papillary bladder tumours. Representative examples of immunohistochemical
stainings of papillary bladder carcinomas with anti-MTUS1 antibody. 4A and B show tumours with negative, 4C and D with positive staining.
Localization of MTUS1 is in the cytoplasm.
A
B
MTUS1 vs. grade
45
35
14
30
28
25
hg
20
15
lg
28
Number patients
Number patients
40
10
12
5
0
IRS 0
D
MTUS1 vs. CK20
50
45
40
35
30
25
20
15
10
5
0
12
25
pT1-4
pTa+PUNLMP
31
17
IRS 0
IRS 1-12
IRS 1-12
MTUS1 vs. Ki67
45
40
15
28
10%
<10%
28
Number patients
Number patients
C
MTUS1 vs. stage
50
45
40
35
30
25
20
15
10
5
0
35
14
30
28
25
≥15%
20
15
<15%
28
10
14
14
5
0
IRS 0
IRS 1-12
IRS 0
IRS 1-12
Figure 5 Associations of MTUS1 loss with histopathological parameters in papillary bladder tumours. Significant direct correlation of
MTUS1 expression with tumour grade (5A), stage (5B), CK20 (5C) and Ki67 (5D) expression in papillary bladder tumours. MTUS1 loss was
associated with decreased malignant potential of the cell as indicated through increased occurrence of low-grade differentiation, non-invasive
growth pattern and weak CK20 and Ki67 expression in carcinomas of the IRS0 (MTUS1-deficient) group.
Rogler et al. BMC Cancer 2014, 14:214
/>
Page 9 of 14
Figure 6 Association of MTUS1 loss with FGFR3 mutations in papillary bladder tumours. FGFR3 mutation analysis in the papillary bladder
tumour group. 6A and B show representative examples of FGFR3 wildtype (6A) and mutation R248C (6B) sequences. To assess data integrity we
correlated FGFR3 status with tumour stage (6C) and then with MTUS1 expression (6D). We showed that the majority of FGFR3 mutation tumours had a
predominantly non-invasive growth pattern compared to FGFR3 wildtype tumours, which showed more invasive phenotypes. FGFR3 mutation where,
however, correlated with MTUS1 loss.
showed positive MTUS1 expression in the nucleus
(Figure 7D), but not in the cytoplasm. The remaining
PUCs showed complete loss of expression.
Kaplan-Meier analysis revealed significantly better overall
(p = 0.029) and disease-specific (p = 0.027) survival for patients with MTUS1 expression in the bladder tumour (IRS
1–12). Patients with MTUS1 expression survived for
64 months (OS) and 69 months (DSS), whereas patients
without MTUS1 expression showed mean survival of only
46 (OS) and 50 months (DSS), respectively. Also in multivariate Cox-regression analysis with stepwise backward
elimination (adjusted to gender, stage, grade, node-invasion,
histological subtype, type of chemotherapy and P53 expression), this observation could be confirmed, however not
significantly. A hazard ration of 1.507 (95% CI 0.92-2.46,
p = 0.102) and 1.662 (95% CI 0.97-2.85, p = 0.066) was
found for overall and disease-specific survival, respectively.
OS and DSS survival curves are shown in Figure 8A to D.
Due to availability of survival time and/or status as well as
of additional patient characteristics, only 198/236 and 173/236
patients could be analysed in Kaplan-Meier and Coxregression analysis, respectively. Patients with MTUS1 expressing tumours also had better progression-free survival
(PFS, mean survival time: 60.5 months, n = 111) compared
to patients with MTUS1 expression loss (46.8 months,
n = 86, p = 0.179, PFS graphs not shown).
Discussion
In aCGH we found that pT1 tumours had more genomic
aberrations than pTa tumours, which strengthens the hypothesis that bladder tumours accumulate genetic alterations with progression of disease. Regarding chromosome
8p, our results were in line with previous studies, which reported loss of chromosome 8p as a common event in
urothelial carcinomas [31-33]. Our most promising candidate gene identified in aCGH at 8p22, MTUS1, is known to
be downregulated in other cancer entities, such as pancreatic, ovarian, colon, breast and prostate cancer
Rogler et al. BMC Cancer 2014, 14:214
/>
Page 10 of 14
A
B
100µm
pT2, hg
200x
C
100µm
pTx, hg
200x
D
50µm
PUC
400x
50µm
micropapillary UC
400x
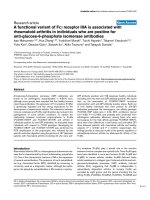
Figure 7 Immunohistochemical expression of MTUS1 in advanced bladder tumours. Representative examples of immunohistochemical
stainings in advanced bladder tumours. 7A shows positive, 7B negative staining in common urothelial carcinoma. In 7C positive nuclear staining in
plasmocytoid carcinoma of the bladder is shown. In all micropapillary urothelial carcinomas positive cytoplasmatic staining could be observed (7D).
A
*p=0.029
B
*p=0.027
IRS 1-12 (n=112)
IRS 1-12 (n=112)
IRS 0 (n=86)
IRS 0 (n=86)
C
p=0.102
D
p=0.066
IRS 1-12 (n=97)
IRS 1-12 (n=97)
IRS 0 (n=76)
IRS 0 (n=76)
Figure 8 Survival curve analysis in the advanced tumour cohort. 8A and B show Kaplan-Meier curves for overall (8A) and disease specific (8B)
survival. Patients with positive MTUS1 expression in the tumour (green) have better overall- and disease specific survival, than tumours with MTUS1 expression
loss (red). Multivariate Cox-regression analysis (stepwise backward exclusion) for overall (8C) and disease-specific survival (8D) confirmed Kaplan-Meier findings.
Rogler et al. BMC Cancer 2014, 14:214
/>
Page 11 of 14
Table 3 Summary of ATIP isoforms and their associated transcripts and proteins (Uniprot, Q9ULD2)
MTUS1-Isoforms
Protein-variant
mRNA
Protein
Molecular weight
1
ATIP3a
6435 bp
1270 aa
141 kDa
2
ATIP3b
6273 bp
1216 aa
136 kDa
3
ATIP1
3819 bp
436 aa
51 kDa
4
?
3160 bp
342 aa
38 kDa
5
ATIP2
2787 bp
770 aa
84 kDa
6
ATIP4
4022 bp
517 aa
59 kDa
7
?
2667 bp
415 aa
48 kDa
Abbreviations: ATIP Angiotensin II AT2 receptor-interacting protein, bp base pairs, aa amino acids, kDa kilo Dalton.
[19,26-29]. To clarify its role in bladder cancer, we further analysed MTUS1 in cell culture and immunohistochemical experiments.
MTUS1 (mitochondrial or microtubulus-associated
tumour suppressor 1) is located at chromosome 8p21.3-22
(17.501.304-17.658.426, NCBI Genbank ID 57509) and
spans 157 kbp (including UTRs) and 110 kbp (coding region, UCSC Genome browser, uc003wxv.3) including 17
exons. Use of alternative exons leads to transcription of 30
different mRNAs and Uniprot describes seven functional
MTUS1 protein isoforms which are summarized in Table 3.
The gene products are designated as ATIPs (angiotensin II
AT2 receptor-interacting proteins) or as ATBPs (AT2-receptor binding-protein) and the name is derived from their
function as interaction-partners of AT2-receptors of the
renin-angiotensin-aldosterone system. Here ATIP mediates
AT2-receptor activation and inhibition of AT1 receptor activity. As antagonist of the AT1 receptor, the AT2 receptor,
enhanced through binding of ATIP, induces antiproliferative and anti-apoptotic effects [34]. All ATIPs share
one large C-terminal coiled-coil domain, which enables
homo- and hetero-dimerization as well as their interaction
with the AT2 receptor. The ATIP-proteins interact with the
C-terminus of the receptor and further support its capability to inhibit ERK2-activity of the classical MAP-kinasesignalling pathway as well as inhibition of growth factorinduced autophosphorylation of receptor tyrosine kinases
[35]. Additionally, it could be demonstrated that ATIP3 is
located at the centrosome of the cell and plays an important role in microtubulus-dynamics and mitosis. Overexpression of ATIP3 led to extension of metaphase through
modulation of the spindle-checkpoint signalling pathway
and is considered as one potential therapeutic effector in
metastatic breast cancer [36]. This biological function of
MTUS1/ATIP might be also one explanation for the decreased viability in RT112 bladder cancer cells after overexpression of MTUS1. The distinct but not significant
reduction of wound-healing behavior might be a consequence of reduced viability.
MTUS1 was first described as a tumour suppressor gene
in a study from Seibold et al. [26] where its function was
investigated in pancreatic carcinoma cell lines as well as in
several normal tissues. It could be shown that MTUS1 was
expressed in all investigated normal tissues, such as heart
muscle, brain or kidney.
MTUS1 isoforms can be classified into five groups of
ATIPs: ATIP1 (436aa, 51 kDa), ATIP2 (770aa, 84 kDa),
ATIP3a and b (1270aa, 141 kDa and 1216aa, 136 kDa)
and ATIP4 (517aa, 59 kDa). Those transcripts show an
unequal distribution in human tissue. ATIP3a and b seem
to be the most common variants and they can be found in
almost all human tissues. ATIP3 is also designated as canonical MTUS1 protein variant and is the predominant
form reported to be expressed in the bladder [37]. Therefore, ATIP3 was used for overexpression in RT112. ATIP1
and 4 are the predominant forms in the brain. About the
distribution of ATIP2 in human tissue not much information is available to date [37]. According to our western
blot results it seems likely that, depending on the cell line,
the ATIP variants 3 (~140 kDa) and 4 (~59 kDa) are
expressed in bladder cancer cell lines in different concentrations. ATIP1 (49 kDa), however, seems not to be
expressed in bladder cancer cell lines at all. The western
blot also shows one distinct band at ~80 kDa. According
to Uniprot the MTUS1 isoform ATIP2 has a molecular
weight of approximately 80 kDa. However the antibody
contains no epitope for this isoform: the origin of the
80 kDa band still remains unclear. In future experiments
it would be important to distinguish the expression levels
of each ATIP protein separately, e.g. by usage of ATIP
isoform-specific antibodies.
In immunohistochemical analysis we found that MTUS1
expression was lost in 50.6% of all papillary and in 45.8%
of all advanced bladder tumours. This loss might be the
result of chromosomal deletions at 8p22, as shown in
aCGH. Also epigenetic changes, like binding of microRNAs or promoter hypermethylation might inhibit gene
transcription and thus protein expression. In papillary
bladder cancers, survival was not influenced, however a
direct correlation with stage, grade, Ki67 and CK20 expression was found. This indicates that papillary tumours
with retained MTUS1 expression have higher malignant
potential than MTUS1-deficient tumours and that MTUS1
should be considered more as an oncogene rather than a
Rogler et al. BMC Cancer 2014, 14:214
/>
tumour suppressor gene. However, MTUS1 expression did
not influence survival and thus does not seem to be important for prognosis or disease progression in the papillary pathway of bladder cancer development. Our findings
regarding papillary tumours make it very likely that
MTUS1 does not act as a classical tumour suppressor and
make a role as new potential progression marker in papillary bladder cancer very unlikely.
Although we could find complete loss of MTUS1 protein expression in almost 50% of the cases in both bladder
tumour cohorts, survival was only influenced in the advanced bladder cancer group. Here expression loss was associated with worse OS and DSS, indicating that MTUS1
acts as a classical tumour suppressor gene and that it
might be a new target gene at chromosome 8p as well as
an independent prognostic factor in advanced bladder
cancer. These data argue that MTUS1 loss could be important in the development of non-papillary bladder cancer from CIS, which should be investigated in further
experiments. It might also be likely that MTUS1 acts as a
chemotherapy-response-predictor, as all investigated patients underwent chemotherapy. Additionally, MTUS1 appears to play a major role in two variants of rare advanced
and very aggressive bladder tumours. In plasmocytoid
urothelial carcinomas MTUS1 was either found in the nucleus or no expression was detected. In micropapillary tumours only positive MTUS1 expression was found, which,
in this entity, cannot be responsible for decreased malignancy, as this variant is one of the most aggressive tumour
types found in the bladder. It would be interesting to clarify the biological function of MTUS1 especially in PUCs
and in micropapillary carcinomas, particularly in regard to
the occurrence of mutations. One study identified five
major nucleotide substitutions in ATIP3 exons in hepatocellular carcinoma [38]. For bladder cancer, however, no
mutation analysis data for MTUS1 is available yet.
In addition to our findings, one recently released study
found a correlation of reduced MTUS1 mRNA expression
with poor prognosis in bladder cancer patients [30]. The
patient cohort, however, was more heterogeneous than
ours and comprised all kinds of transitional cell carcinomas of the bladder, ranging from pTa to pT4 and including also CIS. This study revealed equally, that MTUS1 is
an independent prognostic factor for DSS in bladder
cancer.
Conclusions
In summary, MTUS1/ATIP was identified as a tumor suppressor gene in cultured bladder cancer cells and in patients with advanced bladder cancers. Although MTUS1/
ATIP loss was detected in approximately 50% of all investigated bladder cancers, there was only a significant association with worse OS and DSS in advanced bladder
carcinomas, but not in papillary bladder carcinomas. This
Page 12 of 14
might be due to two different molecular pathways that
lead to the development of either frequently recurring
papillary or highly malignant solid bladder cancers. In
future experiments we want to determine the expression level of potential MTUS1-binding microRNAs and
analyse promoter methylation and mutation status of
MTUS1 in bladder tumour specimen. We further want
to reveal the reason for the frequent loss of MTUS1/
ATIP in bladder cancer and the differences between
papillary, micropapillary and other advanced bladder
cancers.
Abbreviations
ATIP: Angiotensin II AT2 receptor interacting protein; MTUS1: Microtubulusassociated tumour suppressor 1; OS: Overall survival; DSS: Disease specific
survival; aCGH: Array comparative genomic hybridisation; aa: Amino acid(s);
bp: Basepair(s); Da: Dalton; μ: Micro; n: Nano; s: Second(s); min: Minute(s);
h: Hour(s); °C: Degree(s) celsius.
Competing interests
The author’s declare that they have no conflict of interest.
Authors’ contributions
AR coordinated development of papillary bladder tumour tissue micro array,
performed DNA- and RNA-isolation, cell culture experiments, qRT-PCR,
statistical analysis, data interpretation and aCGH data analysis and
participated in immunohistochemical staining, study conception and
drafted the manuscript. SH performed immunohistochemical staining and
analysis and participated in cell culture experiments, qRT-PCR, statistical
analysis, data interpretation and aCGH data analysis. JG participated in
histological evaluation of papillary bladder tumours. AE carried out
aCGH analysis within the IZKF core unit Z3 Affymetrix-Chip-Analysen. SW
participated in survival curve generation and analysis and provided LNCaP
positiv control cell line and critically revised the manuscript. HT participated in
Kaplan-Meier and statistical analysis and critically revised the manuscript. PG
participated in study design, helped to acquire patient data. BW participated in
study design, helped to acquire patient data. MS was the principle investigator
of the AUO trial and provided paraffine blocks for the advanced bladder cancers
(advanced TMA cohort). JL was conducting patient data requisition of the AUO
trial (advanced TMA cohort). SP helped to acquire patient data for the papillary
TMA cohort. AH helped to draft the manuscript, participated in study design and
histological evaluation and supervised the study. RS conceived of, coordinated
and supervised the study, participated in TMA development and helped to draft
the manuscript. All authors read and approved the final manuscript.
Acknowledgements
This study was supported by a grant of the Interdisziplinäres Zentrum für
Klinische Forschung of the University Hospital Erlangen to PJG, BW, AH and
RS and by a grant to AR of the Bavarian Equal Opportunities Sponsorship –
Förderung von Frauen in Forschung und Lehre (FFL) – Promoting Equal
Opportunities for Women in Research and Teaching.
We are grateful to Verena Popp, Yvonne Sauermann, Birgit Meyer, Rudolf
Jung and Petra Rothe for their excellent technical assistance. Further the
authors thank Stefan Schick from the Tumor Zentrum Erlangen for his help
with patient follow-up data.
Author details
1
Institute of Pathology, University Hospital Erlangen, Krankenhausstr. 8-10,
91054 Erlangen, Germany. 2Institute of Human Genetics, Friedrich-Alexander
Universität Erlangen-Nürnberg, Schwabachanlage 10, 91054 Erlangen,
Germany. 3Department of Urology, University Hospital Erlangen,
Krankenhausstr. 12, 91054 Erlangen, Germany. 4Clinic for Urology and
Children’s Urology, University Hospital Saarland, Kirrberger Strasse, 66421
Homburg/Saar, Germany. 5Urology Practice Prüner Gang, Prüner Gang 15,
24105 Kiel, Germany. 6Tumour Zentrum, Friedrich-Alexander Universität
Erlangen-Nürnberg, Carl-Thiersch-Str. 7, 91052 Erlangen, Germany.
Rogler et al. BMC Cancer 2014, 14:214
/>
Page 13 of 14
Received: 9 October 2013 Accepted: 12 March 2014
Published: 20 March 2014
18.
References
1. Reinert T, Modin C, Castano FM, Lamy P, Wojdacz TK, Hansen LL, Wiuf C,
Borre M, Dyrskjot L, Orntoft TF: Comprehensive genome methylation
analysis in bladder cancer: identification and validation of novel
methylated genes and application of these as urinary tumor markers.
Clin Cancer Res 2011, 17:5582–5592.
2. Fristrup N, Ulhoi BP, Birkenkamp-Demtroder K, Mansilla F, Sanchez-Carbayo M,
Segersten U, Malmstrom PU, Hartmann A, Palou J, Alvarez-Mugica M, Zieger K,
Borre M, Ornthoft TF, Dyrskjot L: Cathepsin E, maspin, Plk1, and survivin are
promising prognostic protein markers for progression in non-muscle
invasive bladder cancer. Am J Pathol 2012, 180:1824–1834.
3. Park SJ, Lee TJ, Chang IH: Role of the mTOR pathway in the progression
and recurrence of bladder cancer: an immunohistochemical tissue
microarray study. Korean J Urol 2011, 52:466–473.
4. Munksgaard PP, Mansilla F, Brems Eskildsen AS, Fristrup N, Birkenkamp-Demtroder K,
Ulhoi BP, Borre M, Agerbaek M, Hermann GG, Orntoft TF, Dyrskjot L: Low
ANXA10 expression is associated with disease aggressiveness in bladder
cancer. Br J Cancer 2011, 105:1379–1387.
5. Gui Y, Guo G, Huang Y, Hu X, Tang A, Gao S, Wu R, Chen C, Li X, Zhou L, He
M, Li Z, Sun X, Jia W, Chen J, Yang S, Zhou F, Zhao X, Wan S, Ye R, Liang C,
Liu Z, Huang P, Liu C, Jiang H, Wang Y, Zheng H, Sun L, Liu X, Jiang Z, et al:
Frequent mutations of chromatin remodeling genes in transitional cell
carcinoma of the bladder. Nat Genet 2011, 43:875–878.
6. Wolff EM, Liang G, Jones PA: Mechanisms of disease: genetic and
epigenetic alterations that drive bladder cancer. Nat Clin Pract Urol 2005,
2:502–510.
7. Williams SV, Platt FM, Hurst CD, Aveyard JS, Taylor CF, Pole JC, Garcia MJ,
Knowles MA: High-resolution analysis of genomic alteration on
chromosome arm 8p in urothelial carcinoma. Genes Chromosomes Cancer
2010, 49:642–659.
8. Stoehr R, Wissmann C, Suzuki H, Knuechel R, Krieg RC, Klopocki E, Dahl E,
Wild P, Blaszyk H, Sauter G, Simon R, Schmitt R, Zaak D, Hofstaedter F,
Rosenthal A, Baylin SB, Pilarsky C, Hartmann A: Deletions of chromosome
8p and loss of sFRP1 expression are progression markers of papillary
bladder cancer. Lab Invest 2004, 84:465–478.
9. Lehmann J, Retz M, Wiemers C, Beck J, Thuroff J, Weining C, Albers P, Frohneberg
D, Becker T, Funke PJ, Walz P, Langbein S, Reiher F, Schiller M, Miller K, Roth S,
Kälble T, Sternberg D, Wellek S, Stöckle M: Adjuvant cisplatin plus methotrexate
versus methotrexate, vinblastine, epirubicin, and cisplatin in locally advanced
bladder cancer: results of a randomized, multicenter, phase III trial (AUO-AB
05/95). J Clin Oncol 2005, 23:4963–4974.
10. Hatina J, Huckenbeck W, Rieder H, Seifert HH, Schulz WA: Bladder
carcinoma cell lines as models of the pathobiology of bladder cancer.
Review of the literature and establishment of a new progression series.
Urologe A 2008, 47:724–734.
11. Masters JR, Hepburn PJ, Walker L, Highman WJ, Trejdosiewicz LK, Povey S,
Parkar M, Hill BT, Riddle PR, Franks LM: Tissue culture model of transitional
cell carcinoma: characterization of twenty-two human urothelial cell
lines. Cancer Res 1986, 46:3630–3636.
12. Rieger KM, Little AF, Swart JM, Kastrinakis WV, Fitzgerald JM, Hess DT,
Libertino JA, Summerhayes IC: Human bladder carcinoma cell lines as
indicators of oncogenic change relevant to urothelial neoplastic
progression. Br J Cancer 1995, 72:683–690.
13. Tzeng CC, Liu HS, Li C, Jin YT, Chen RM, Yang WH, Lin JS: Characterization
of two urothelium cancer cell lines derived from a blackfoot disease
endemic area in Taiwan. Anticancer Res 1996, 16:1797–1804.
14. Rossi MR, Masters JR, Park S, Todd JH, Garrett SH, Sens MA, Somji S,
Nath J, Sens DA: The immortalized UROtsa cell line as a potential cell culture
model of human urothelium. Environ Health Perspect 2001, 109:801–808.
15. Riesenberg R, Fuchs C, Kriegmair M: Photodynamic effects of 5aminolevulinic acid-induced porphyrin on human bladder carcinoma
cells in vitro. Eur J Cancer 1996, 32A:328–334.
16. Ottesen SS, Ahrenkiel V, Kieler J: Recombinant human interferon gamma
exerts an anti-proliferative effect and modulates the expression of
human leukocyte antigens A, B, C and DR in human urothelial cell lines.
Cancer Immunol Immunother 1990, 31:93–98.
17. Pape GR, Troye M, Perlmann P: Heterogeneity and mechanism of action
of human natural killer lymphocytes: differential distribution of receptors
19.
20.
21.
22.
23.
24.
25.
26.
27.
28.
29.
30.
31.
32.
33.
34.
35.
36.
for Helix pomatia haemagglutinin (HP receptors). Scand J Immunol 1979,
10:109–118.
Larsen JK, Christensen IJ, Kieler J: Cell cycle perturbation by sodium
butyrate in tumorigenic and non-tumorigenic human urothelial cell lines
assessed by flow cytometric bromodeoxyuridine/DNA analysis. Cell Prolif
1995, 28:359–371.
Louis SN, Chow L, Rezmann L, Krezel MA, Catt KJ, Tikellis C, Frauman AG,
Louis WJ: Expression and function of ATIP/MTUS1 in human prostate
cancer cell lines. Prostate 2010, 70:1563–1574.
Schmittgen TD, Livak KJ: Analyzing real-time PCR data by the comparative
C(T) method. Nat Protoc 2008, 3:1101–1108.
Koufou S, Lunz JC, Borchardt A, Keck B, Kneitz B, Gaisa NT, Hafner C, Giedl C,
Rau TT, Rogler A, Wieland WF, Hartmann A, Stoehr R: Mutational activation
of FGFR3 is not involved in the development of prostate cancer.
Pathobiology 2010, 77:249–252.
Van Oers JM, Lurkin I, Van Exsel AJ, Nijsen Y, Van Rhijn BW, van der Aa MN,
Zwarthoff EC: A simple and fast method for the simultaneous detection
of nine fibroblast growth factor receptor 3 mutations in bladder cancer
and voided urine. Clin Cancer Res 2005, 11:7743–7748.
Hafner C, Van Oers JM, Vogt T, Landthaler M, Stoehr R, Blaszyk H,
Hofstaedter F, Zwarthoff EC, Hartmann A: Mosaicism of activating FGFR3
mutations in human skin causes epidermal nevi. J Clin Invest 2006,
116:2201–2207.
Bubendorf L, Nocito A, Moch H, Sauter G: Tissue microarray (TMA)
technology: miniaturized pathology archives for high-throughput in situ
studies. J Pathol 2001, 195:72–79.
Klopocki E, Kristiansen G, Wild PJ, Klaman I, Castanos-Velez E, Singer G, Stohr
R, Simon R, Sauter G, Leibiger H, Essers L, Weber B, Hermann K, Rosenthal A,
Hartmann A, Dahl E: Loss of SFRP1 is associated with breast cancer
progression and poor prognosis in early stage tumors. Int J Oncol 2004,
25:641–649.
Seibold S, Rudroff C, Weber M, Galle J, Wanner C, Marx M: Identification of
a new tumor suppressor gene located at chromosome 8p21.3-22. FASEB
J 2003, 17:1180–1182.
Pils D, Horak P, Gleiss A, Sax C, Fabjani G, Moebus VJ, Zielinski C, Reinthaller A,
Zeillinger R, Krainer M: Five genes from chromosomal band 8p22 are
significantly down-regulated in ovarian carcinoma: N33 and EFA6R have a potential impact on overall survival. Cancer 2005, 104:2417–2429.
Zuern C, Heimrich J, Kaufmann R, Richter KK, Settmacher U, Wanner C, Galle
J, Seibold S: Down-regulation of MTUS1 in human colon tumors.
Oncol Rep 2010, 23:183–189.
Rodrigues-Ferreira S, Di Tommaso A, Dimitrov A, Cazaubon S, Gruel N,
Colasson H, Nicolas A, Chaverot N, Molinie V, Reyal F, Sigal-Zafrani B,
Terris B, Delattre O, Radnanyi F, Perez F, Vincent-Salomon A, Nahmias C:
8p22 MTUS1 gene product ATIP3 is a novel anti-mitotic protein
underexpressed in invasive breast carcinoma of poor prognosis. PLoS
One 2009, 4:e7239.
Xiao J, Chen JX, Zhu YP, Zhou LY, Shu QA, Chen LW: Reduced expression
of MTUS1 mRNA is correlated with poor prognosis in bladder cancer.
Oncol Lett 2012, 4:113–118.
Knowles MA, Shaw ME, Proctor AJ: Deletion mapping of chromosome 8 in
cancers of the urinary bladder using restriction fragment length
polymorphisms and microsatellite polymorphisms. Oncogene 1993,
8:1357–1364.
Takle LA, Knowles MA: Deletion mapping implicates two tumor
suppressor genes on chromosome 8p in the development of bladder
cancer. Oncogene 1996, 12:1083–1087.
Choi C, Kim MH, Juhng SW, Oh BR: Loss of heterozygosity at chromosome
segments 8p22 and 8p11.2-21.1 in transitional-cell carcinoma of the
urinary bladder. Int J Cancer 2000, 86:501–505.
Rodrigues-Ferreira S, Nahmias C: An ATIPical family of angiotensin II AT2
receptor-interacting proteins. Trends Endocrinol Metab 2010, 21:684–690.
Nouet S, Amzallag N, Li JM, Louis S, Seitz I, Cui TX, Alleaume AM, Di Benedetto M,
Boden C, Masson M, Strosberg AD, Horiuchi M, Couraud PO, Nahmias C: Transinactivation of receptor tyrosine kinases by novel angiotensin II AT2 receptorinteracting protein, ATIP. J Biol Chem 2004, 279:28989–28997.
Molina A, Velot L, Ghouinem L, Abdelkarim M, Bouchet BP, Luissint AC, Bouhlel I,
Morel M, Sapharikas E, Di Tommaso A, Honore S, Braquer D,
Gruel N, Vincent-Salomon A, Delattre O, Sigal-Zafrani B, Andre F, Terris B,
Akhmanova A, Di Benedetto M, Nahmias C, Rodriques-Ferreira S: ATIP3, a novel
prognostic marker of breast cancer patient survival, limits cancer cell
Rogler et al. BMC Cancer 2014, 14:214
/>
Page 14 of 14
migration and slows metastatic progression by regulating microtubule dynamics. Cancer Res 2013, 73:2905–2915.
37. Di Benedetto M, Bieche I, Deshayes F, Vacher S, Nouet S, Collura V, Seitz I,
Louis S, Pineau P, Amsellem-Ouazana D, Couraud PO, Strosberg AD,
Stoppa-Lyonnet D, Lidereau R, Nahmias C: Structural organization and
expression of human MTUS1, a candidate 8p22 tumor suppressor gene
encoding a family of angiotensin II AT2 receptor-interacting proteins,
ATIP. Gene 2006, 380:127–136.
38. Di Benedetto M, Pineau P, Nouet S, Berhouet S, Seitz I, Louis S, Dejean A,
Couraud PO, Strosberg AD, Stoppa-Lyonnet D, Nahmias C: Mutation analysis of
the 8p22 candidate tumor suppressor gene ATIP/MTUS1 in hepatocellular
carcinoma. Mol Cell Endocrinol 2006, 252:207–215.
doi:10.1186/1471-2407-14-214
Cite this article as: Rogler et al.: Loss of MTUS1/ATIP expression is
associated with adverse outcome in advanced bladder carcinomas: data
from a retrospective study. BMC Cancer 2014 14:214.
Submit your next manuscript to BioMed Central
and take full advantage of:
• Convenient online submission
• Thorough peer review
• No space constraints or color figure charges
• Immediate publication on acceptance
• Inclusion in PubMed, CAS, Scopus and Google Scholar
• Research which is freely available for redistribution
Submit your manuscript at
www.biomedcentral.com/submit