Ultrasonic spectrum analysis for in vivo characterization of tumor microstructural changes in the evaluation of tumor response to chemotherapy using diagnostic ultrasound
Bạn đang xem bản rút gọn của tài liệu. Xem và tải ngay bản đầy đủ của tài liệu tại đây (1.38 MB, 9 trang )
Lin et al. BMC Cancer 2013, 13:302
/>
RESEARCH ARTICLE
Open Access
Ultrasonic spectrum analysis for in vivo
characterization of tumor microstructural changes
in the evaluation of tumor response to
chemotherapy using diagnostic ultrasound
Chun-yi Lin2†, Long-hui Cao3†, Jian-wei Wang1, Wei Zheng1, Yao Chen1, Zi-zhen Feng4, An-hua Li1
and Jian-hua Zhou1*
Abstract
Background: There is a strong need for early assessment of tumor response to chemotherapy in order to avoid the
adverse effects of unnecessary chemotherapy and to allow early transition to second-line therapy. The purpose of
this study was to determine the feasibility of ultrasonic spectral analysis for the in vivo characterization of changes
in tumor microstructure in the evaluation of tumor response to chemotherapy using diagnostic ultrasound.
Methods: Experiments were approved by the regional animal care committee. Twenty-four MCF-7 breast cancer
bearing nude mice were treated with adriamycin or sterile saline administered by intraperitoneal injection.
Ultrasonic radio-frequency (RF) data was collected using a clinically available ultrasound scanner (6-MHz linear
transducer). Linear regression parameters (spectral slope and midband-fit) regarding the calibrated power spectra
from the RF signals were tested to monitor tumor response to treatment. The section equivalent to the ultrasound
imaging plane was stained with hematoxylin and eosin to allow for assessment of the density of tumor cell nuclei.
Results: Treatment with adriamycin significantly reduced tumor growth in comparison with the control group
(p = 0.003). Significant changes were observed in the ultrasonic parameters of the treated relative to the untreated
tumors (p < 0.05). The spectral slope increased by 48.5%, from −10.66 ± 2.96 to −5.49 ± 2.69; the midband-fit
increased by 12.8%, from −57.10 ± 7.68 to −49.81 ± 5.40. Treated tumors were associated with a significant decrease
in the density of tumor cell nuclei as compared with control tumors (p < 0.001).
Conclusions: Ultrasonic spectral analysis can detect changes in tumor microstructure after chemotherapy, and this
will be helpful in the early evaluation tumor response to chemotherapy.
Keywords: Adriamycin, Chemotherapy, Cancer, Ultrasonic spectrum analysis, Microstructure
Background
Tumor malignancy is one of the principal diseases that
adversely affect human health and quality of life. More
than half of all patients diagnosed with a malignant
tumor will receive chemotherapy. At the present time,
chemotherapy is still one of the most important cancer
treatment methods. Early evaluation of tumor response
* Correspondence:
†
Equal contributors
1
Department of Ultrasound, State Key Laboratory of Oncology in South
China, Sun Yat-Sen University Cancer Center, Guangzhou 510060, P.R. China
Full list of author information is available at the end of the article
to chemotherapy in patients with cancer may help to
avoid unnecessary treatment and enable the use of alternative therapies. Currently in clinical oncology and experimental therapeutics, assessment of tumor treatment
response to chemotherapy relies on evaluating changes
in tumor growth rate or volume weeks to months after
the conclusion of a therapeutic protocol. These changes
typically occur weeks to months late in the course of
therapy. Functional techniques such as positronemission tomography (PET), dynamic contrast-enhanced
magnetic resonance imaging (MRI) and dynamic
contrast-enhanced computed tomography (CT) have
© 2013 Lin et al.; licensee BioMed Central Ltd. This is an Open Access article distributed under the terms of the Creative
Commons Attribution License ( which permits unrestricted use, distribution, and
reproduction in any medium, provided the original work is properly cited.
Lin et al. BMC Cancer 2013, 13:302
/>
been investigated regarding the early assessment of
tumor response to chemotherapy; this involves depiction
of reductions in the metabolic activity or the perfusion
of the tumor, and some of the results have been promising [1-3]. However, the use of such imaging modalities
to monitor tumor responses to chemotherapy can be
limited either by their cost or exposure of the patient to
radiation.
The aim of cancer therapy is to kill tumors by inducing cell death that can be used as an indicator of tumor
response to therapy [4]. Increased tumor cell death early
during the course of treatment, in preclinical and clinical
studies, has been shown to be a good prognostic indicator of outcome [5,6]. Currently, standard methods for
detecting cell death are invasive and require tissue biopsy for histologic analysis. Diffusion-weighted MRI has
been used clinically to measure the increase in the apparent diffusion coefficient of water, which is thought to
be increased in responding tumors owing to a decrease
in cell density [7,8]. However, assessment of tumor response to chemotherapy requires repeated examinations
and the cost of MRI limits its clinical use.
Ultrasound is an attractive modality for the assessment
of tumor response to therapy because of the ease with
which it can be repeated without exposing the patient or
animal to any risk of radiation. Ultrasound imaging systems are also relatively inexpensive and mobile, a particular benefit for animal studies. Ultrasonic spectrum
analysis is used to extract information regarding tissue
structures that is not conveyed in conventional B-mode
imaging. Spectrum analysis of frequency-dependent
backscattered radiofrequency (RF) data has been used to
characterize tissue microstructures in the diagnosis of
prostate cancer, ocular tumors, and cardiac abnormalities [9-11] and to differentiate benign lymph nodes from
malignant lymph nodes [12]. It has been shown theoretically that the spectral parameters are related to tissue
microstructural properties (e.g., effective acoustic scatterer size and concentration) [13]. Ultrasonic spectral
analysis with a high frequency transducer has been used
to detect microstructural changes induced by radiotherapy, photodynamic therapy and chemotherapy in tumor
xenografts [14-17]. Recently, Sadeghi-Naini and colleagues used ultrasonic spectral analysis with a Sonix RP
system at an approximate center frequency of 7 MHz to
examine response to neoadjuvant chemotherapeutic in
breast cancer patients and the preliminary results were
promising [18]. However, this study was limited by the
small number of cases (n = 10) and no confirmation of
the changes in spectral parameters was obtained from
evaluation of the corresponding tissue microstructures.
The purpose of the present study was to determine the
feasibility of ultrasonic spectral analysis for the in vivo
characterization of tumor microstructural changes in the
Page 2 of 9
evaluation of tumor response to chemotherapy using
diagnostic ultrasound.
Methods
Animal model
This study was approved by the Committee on the
Ethics of Animal Experiments of the Sun Yat-Sen
University under the guidelines of the National Institutes
of Health for the care of laboratory animals. Human
breast cancer cell line MCF-7 was obtained from State
Key Laboratory of Oncology in Southern China. MCF-7
cells were grown in DMEN culture medium (Hyclone
Co., UT, USA) supplemented with 10% fetal bovine serum
(Gibco, Grand Island, NY, USA), penicillin (50 U/ml), and
streptomycin (50 μg/ml) at 37°C in a humidified 5% CO2
atmosphere. For inoculation, approximately 4 × 10⁸ MCF7 cells suspended in phosphate-buffered saline were
injected subcutaneously into the right axillary fossa of 24
5- to 6-week old BALB/c nude female mice.
Twenty-four nude mice were randomly divided into
two groups. Twelve of the nude mice were treated with
adriamycin (Shenzhen Main Luck Pharmaceuticals Inc.,
Guangdong, China) diluted in sterile saline and administered once daily by intraperitoneal injection (4 mg/kg).
Drug administration began at day 10 post tumor cell implantation when tumors had reached a size of 5 mm.
The remaining twelve nude mice in the control group
were given the vehicle control medium (sterile saline)
according the timing and dosing schedule used for the
treated group.
Ultrasound data acquisition
Ultrasound imaging was performed at day 18 (i.e. 7 days
after initiation of therapy). For the ultrasound imaging
studies, each mouse was anesthetized by intraperitoneal
injection of pentobarbital sodium at a dose of 75 mg/kg
(Sigma, St. Louis, MO, USA). Centrifuged gel was used
to minimize bubble formation in the gel and a stand-off
gel pad was placed on the skin for scanning. A commercially available clinical ultrasound scanner, Sonix
TOUCH (Ultrasonix Medical Corporation, Richmond,
Canada) with a 6-MHz linear transducer was used to
simultaneously collect B-mode images and RF data
from the treated and control tumors. For data acquisition, the ultrasound transducer was positioned such
that the focal zone was at the same depth in each imaged specimen to control for any potential attenuation.
All RF data were sampled with 16 bit resolution at a
frequency of 35 MHz. All images and radiofrequency
data were digitally recorded. All ultrasound examinations were performed by one radiologist, who was
blinded to the treatment status. The greatest longitudinal, transverse and anteroposterior dimensions of tumors were measured in fundamental grayscale imaging
Lin et al. BMC Cancer 2013, 13:302
/>
using calipers. Tumor volume was calculated using the
formula for a prolate ellipsoid: volume = π/6 × length ×
width × depth. The largest cross-section plane of the
tumor was imaged with the transducer held manually
in this position throughout the examination. To evaluate the echogenicity changes in the tumor after chemotherapy, Adobe Photoshop 6.0 (Adobe Systems, San
Jose, CA, USA) was used to measure the gray scale intensity of the ultrasound images.
Ultrasonic spectral analysis
The ultrasound RF data from was imported into
MATLAB-based (v. 2009a: MathWorks, Natick, MA,
USA) software developed in our lab for ultrasound spectral analysis. For the tumor, rectangular regions of interest (ROI) were centered approximately at the focal
depth of the transducer. Three representative ROIs were
selected for each tumor sample and averaged for the
final analysis. RF data from each line segment were
multiplied by a Hamming weighting function to suppress spectral lobes and the Fourier transform was
computed.
The power spectrum was obtained by averaging the results from the independent scan lines. This power
spectrum was divided by the power spectrum of the
echo from a calibration target. A quartz flat was used as
the calibration target and the perpendicular reflection
off the quartz flat located at the focal point of the transducer was used to derive the power spectrum. Linear regression analysis was applied to the calibrated spectral
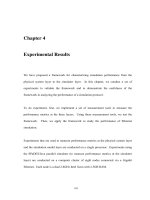
amplitude to provide a best-fit line (Figure 1) [19]. To
assess the role of ultrasonic spectrum analysis in monitoring tumor response to chemotherapy, two spectral
parameters from the regression analysis were computed:
the spectral slope (SS) and the midband fit (MBF). The
SS is the slope of the linear regression of the calibrated
spectrogram and the MBF is the value of the regression
fit at the center frequency over which the spectrum was
measured. The spectral parameters can potentially be
mathematically related to the physical characteristics of
Page 3 of 9
ultrasound scatterers, such as the size and concentration
of the ultrasound scatterers [20]. Further details on the
theoretical and signal analysis considerations and the relationship between spectral parameters and tissue microstructure can be found elsewhere [19,21].
Histopathologic examination
At the end of the experiment, mice were sacrificed using
the standard method. Tumors were removed and fixed
in 10% buffered formalin before paraffin processing. The
tumor specimens were sectioned (5 μm) at the largest
cross sections corresponding to the ultrasound imaging
planes. Sections were stained with hemotoxylin and
eosin (H&E) and assessed microscopically for changes in
cell morphology.
Regions with the highest density of tumor cell nuclei
were located by scanning the tissue sections under a 40x
power microscope. After identification of the regions of
highest density, ten different fields were randomly
chosen within these regions at 400x power. The 400x
histology images were then analyzed to measure the
density of tumor cell nuclei by counting the number of
nuclei in each image using Image Pro Plus software
(Image Pro Plus 6.0, Media Cybernetics, Silver Spring,
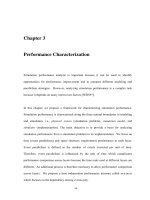
MD, USA) (Figure 2). The H&E stained image segmentation was based on the following Hue-Saturation-Intensity
(HSI) parameters: Hue (0–255), Saturation (0–255) and
Intensity (0–120). The segmented areas in the images
were filtered to count blue nuclei. This filtering used
thresholds as follows: area (minimum = 50 pixels) and box
x/y (minimum = 0.5; maximum =2). The “split objects”
function was used to separate cells touching each other.
The average count of ten 400x images was used for the
statistical analysis.
Statistical analysis
All statistical analyses were performed using SPSS version
16.0 (SPSS, Inc, Chicago, IL, USA). The KolmogorovSmirnov test was applied for evaluation of normal distribution and the Levene test for evaluation of homogeneity
Figure 1 Ultrasound image and power spectrum. (A) Ultrasound image of the MCF7 tumor with the ROI located in the subcutaneous tumor
tissue and (B) the corresponding calibrated power spectrum (blue curve) with linear regression (red line).
Lin et al. BMC Cancer 2013, 13:302
/>
Page 4 of 9
Figure 2 Histologic section and binary image. (A) A hemotoxylin and eosin (H&E) stained image of the MCF-7 tumor and (B) the
corresponding binary image indicating the presence of nuclei were identified using Image Pro Plus. The red square showed the area threshold
used for counting the nuclei.
of variance. Student’s t-test was used to determine the significant differences in measurement data between the
treated and control tumors. A leave-one-out crossvalidation method was used to test the ability of slope and
midband-fit to distinguish treated tumors from control tumors. A p value of 0.05 or less was considered as being
statistically significant.
Results
Effect of adriamycin on tumor growth
After treatment for 7 days, the mean tumor volumes of
the treated and control tumors were 0.08 ± 0.03 cm3 and
0.17 ± 0.08 cm3, respectively. Treatment with adriamycin
(4 mg/kg once daily) significantly reduced tumor growth
in comparison to the control group (p =0.003).
Changes in ultrasonic spectral parameters
After treatment for 7 days, the mean gray scale intensity of
the control and the treated tumors in conventional B-mode
ultrasound images was 15.40 ± 3.86 units and 19.00 ± 1.25
units, respectively. Treatment with adriamycin (4 mg/kg
once daily) significantly increased the gray scale intensity of
the conventional B-mode ultrasound images as compared
with control tumors (p = 0.009). Spectrum analysis of
frequency-dependent backscattered radiofrequency data
showed the difference in spectral parameters between the
treated and control tumors. The mean spectral slope of the
control and treated tumors was −10.66 ± 2.96 dB/MHz
and −5.49 ± 2.69 dB/MHz, respectively. Seven days
treatment with adriamycin (4 mg/kg once daily) significantly increased spectral slope (by 48.5%) in comparison to
the control group (p < 0.001). The mean MBF of the
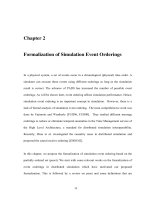
Figure 3 Representative ultrasound images and corresponding ultrasound spectral parameters. Ultrasound images for (A) a control tumor
and (B) a treated tumor, and the corresponding ultrasound spectral parameter (C) characterization of tumor responses to chemotherapy. The
ultrasound images showed a noticeably brighter grayscale intensity in treated tumors (B) relative to control tumors (A). (C) Ultrasonic spectral
analysis indicated a separation of the regression line between the control and the treated tumors.
Lin et al. BMC Cancer 2013, 13:302
/>
control and treated tumors was −57.10 ± 7.68 and −49.81 ±
5.40 dB, respectively. MBF was significantly increased (by
12.8%) after 7 days when the treatment tumor group was
compared with the control group (p = 0.013) (Figure 3). In
distinguishing between treated and control tumors using
“leave-one-out” cross-validation, the correctly classified
rate of slope and MBF was 87.5%, and the sensitivity and
specificity were 83.3% and 91.7%, respectively.
Histological changes
The most prominent histological changes after chemotherapy in the treated tumors were related to the density
of tumor cell nuclei, nuclear size and the extent of cytoplasmic and nuclear vacuolation of the tumor cells. The
number of tumor cell nuclei evaluated in histological
slice from treated tumors was 78.51 ± 13.11 counts per
high-power field (HPF) and in control tumors was
334.50 ± 44.57 counts per HPF. Treatment with adriamycin
(4 mg/kg once daily) significantly reduced the density
of tumor cell nuclei in comparison to the control group
(p < 0.001). H&E staining revealed other microstructural change in treated tumors, involving nuclear structure manipulation (condensation and fragmentation)
(Figures 4 and 5).
Page 5 of 9
Correlation between ultrasonic spectral parameters and
histological results
The density of cell nuclei density was found to be negatively correlated with spectral slope (r = −0.670, p < 0.001)
and MBF (r = −0.450, p = 0.027).
Discussion
Reduction in tumor size is a late sign of effective chemotherapy, early response to chemotherapy is difficult to
assess using conventional radiographic modalities [22].
Currently many cancer treatment regimens require several courses of chemotherapy before it can be determined whether or not the treatment has been effective.
The availability of non-invasive methods for predicting
and/or detecting therapeutic response to chemotherapy
at an early stage of treatment would facilitate the rational design and individualization of therapy protocols
for cancer patients and allow early transition to secondline therapy. The present study was undertaken to assess
the usefulness of ultrasonic spectral analysis in the
evaluation of conventional chemotherapy in a murine
breast cancer model using tumor volume and the density of tumor cell nuclei as gold standards. This study has
shown for the first time, using a clinically available 6
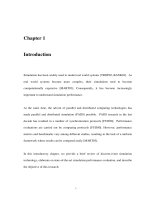
Figure 4 Histopathologic analysis of tumor cell nuclei density. (A) The graph displays the mean density of tumor cell nuclei in the control
and treated tumors (* = p < .001). (B) and (C) Representative photomicrographs of hemotoxylin and eosin stained sections of the control (B) and
treated (C) tumors. Staining revealed microstructural changes in the tumor treated with adriamycin, including a decreased density of cell nuclei,
and cytoplasmic and nuclear vacuolation, and clumping of nuclear chromatin (original magnification, ×400).
Lin et al. BMC Cancer 2013, 13:302
/>
Page 6 of 9
Figure 5 Scatter plots of changes in spectral parameters. (A) Spectral slope, (B) midband-fit versus cell nuclei density and (C) spectral slope
versus midband-fit.
MHz ultrasound transducer, that chemotherapy effects
can be characterized by means of ultrasonic spectral
analysis in preclinical mouse cancer models. The
changes in spectral parameters were interpreted as occurring as a direct consequence of cell death and
changes in the density of cell nuclei after chemotherapy.
This method was able to detect changes in the solid
tumor microstructure after chemotherapy and, consequently has the potential to detect tumors that are responsive to treatment earlier than using conventional
methods.
In the current study, histologic analysis revealed that
the most prominent microstructural changes after
chemotherapy were related to the density of cell nuclei,
cytoplasmic and nuclear vacuolation and clumping of
nuclear chromatin as indicated by the H&E staining;
these changes are frequently seen in breast cancer following neoadjuvant chemotherapy [23,24]. Our histologic observations suggested that the main changes in
the ultrasonic spectral parameters after chemotherapy
were related to microstructural changes regarding both
the density of cell nuclei and cytomorphologic changes.
It has long been suggested that ultrasound backscatter
variables may relate to the physical properties of tissues
[20]. Ultrasonic spectral analysis techniques have been
used by many investigators to add information regarding
tissue microstructure to images generated by conventional
ultrasound [25]. The spectral slope is an indicator of effective scatterer shape and size and an increase in spectral
slope corresponds to a decrease in effective scatterer size
[26]. The observed changes in the spectral slope after
chemotherapy could be suggestive of structural changes in
the tumor cells after treatment, namely cell shrinkage, nuclear condensation and fragmentation. The MBF is another measure of ultrasound backscatter and depends on
multiple factors, including scatterer shape, size, concentration, and the acoustic impedance change between the
acoustic scatterer and the surrounding medium [26]. Increase in MBF was seen in treated tumors after chemotherapy relative to control tumors. The mechanism
behind this increase was broadly linked to changes in cell
and nuclear morphology observed histologically after cell
death. The strength of ultrasound backscatter depends
both on scatterer size and differences in the mechanical
properties of the scatterer, the surroundings (compressibility and density) and the scatterer number density (e.g.,
how many scatterers there are per unit volume) [15]. The
changes in cell and nuclear sizes during the sequence of
cell death resulted in an increase in the variance of cell
sizes; a previous study by Vlad et al. [27] demonstrated
that an increase in cellular size variance contributes to the
increase in ultrasound backscatter during cell death. The
decrease in the density of tumor cell nuclei and extensive
changes in cytoplasmic and nuclear vacuolation of the
Lin et al. BMC Cancer 2013, 13:302
/>
tumor cells might result in changes in acoustic impedance,
contributing to the increase in MBF.
Ultrasonic parameters, including spectral slope and
MBF, have previously been used to characterize diseased
tissue or tissue and cell samples exposed to different
therapeutic agents [14-17,27,28]. Kolios and colleagues
used ultrasonic spectral analysis to measure changes in
the spectral slope and MBF in vitro for cell samples exposed to chemotherapeutic drugs [29]. Significant increases in spectral slope and MBF in treated cells were
observed after exposure to chemotherapy that were in
close agreement with theoretical predictions. However,
more complex histological changes were observed in
in vivo in mouse breast cancer models after chemotherapy than in vitro in cell samples exposed to chemotherapeutic drugs. In our study, other than cell shrinkage and
nuclear condensation and fragmentation, the most prominent microstructural changes observed after chemotherapy were related to the decrease in the density of tumor
cell nuclei, and cytoplasmic and nuclear vacuolation as revealed using H&E staining. Moreover, high-frequency
ultrasound has been used in previous studies to detect
apoptosis in vivo in cell samples and animal systems exposed to different anticancer therapies [14-17,29]. A penetration depth of 2–5 cm at frequencies of 10–30 MHz
limits the applicability of this technique to superficial
regions. The present study confirmed that ultrasonic
spectral analysis using a lower frequency of 6 MHz
could be used to monitor changes in tumor microstructure in a mouse breast cancer tumor model after
chemotherapy. Sadeghi-Naini and colleagues used
ultrasonic spectral analysis with a Sonix RP system at
an approximate center frequency of 7 MHz to examine
neoadjuvant chemotherapeutic response in breast cancer patients, and their preliminary results were promising [18]. Lower frequency ultrasound penetrates much
deeper, and previous studies have confirmed that the
backscattered data from low frequency ultrasound
could be potentially subjected to the same analysis to
provide information regarding structural changes in the
tissue at the cellular level [30-33].
Increased tumor cell death occurring early during the
course of treatment, in both preclinical and clinical studies, has been shown to be a good prognostic indicator of
outcome [5,6]. As a result of tumor cell death, the density of tumor cell nuclei will decrease significantly after
chemotherapy [23,24,34]; this has become a marker for
the detection of early indications of tumor response to
chemotherapy [4]. Noninvasive diffusion-weighted MRI is
a well studied imaging technique for quantifying the increase in the apparent diffusion coefficient of water caused
by a decrease in tumor cell density within 2–4 days, prior
to visible changes in tumor morphology or size in patients
with breast [35], brain [36], and ovarian [8] cancers that
Page 7 of 9
responded to treatment. However, the cost of diffusionweighted MRI limits its extensive use in monitoring tumor
response to cancer therapies. In contrast, in the measurement of changes in water diffusion caused by cell death,
ultrasonic spectral analysis provides a simple imaging approach that can directly characterize tumor microstructural changes (decreased density of tumor cell nuclei)
after chemotherapy.
A potential limitation of our technique was that there
were potential variations in matching the ultrasound
image planes with the histological slices, due to differences in slice thickness between the ultrasound scanner
and histological sections. In order to make ultrasound
data correspond more closely to histologic measurement, the largest cross-section planes were used in both
techniques. Another limitation was that there was no
compensation for attenuation in our study, However, because of the fact that the tumors were close to the skin
surface, and the center of the ROI was located at approximately 0.2 cm below the skin surface, attenuation
compensation will not likely lead to significant changes
in the results for a 6 MHz transducer. Moreover, the
limiting scatterer size for a 6-MHz linear transducer will
be about 85 μm (13), which is much larger than the nuclear diameter (about 15 μm); consequently, it was difficult to identify the histological texture of the scatterer
for the 6-MHz transducer, and therefore to specify the
histological changes that caused the changes in the spectral parameters.
Conclusions
In conclusion, this study indicated that ultrasonic spectral analysis provided a simple way to characterize tumor
microstructural changes after chemotherapy using a
clinically available 6 MHz ultrasound transducer. A significant increase in spectral slope and MBF were
detected using this noninvasive imaging technique after
chemotherapy. This would allow tumor imaging before
and at multiple times during treatment without the need
for injecting specialized contrast agents as is required
using other techniques (e.g. PET, dynamic contrastenhanced CT and dynamic contrast-enhanced MRI). This
noninvasive technique shows considerable potential in the
early assessment of tumor response to chemotherapy.
Competing interests
The authors declare that there is no conflict of interest that could influence
the impartiality of the research reported.
Authors’ contributions
JHZ conceived the study; CYL, JWW, LHC, WZ, YC, AHL and JHZ performed
the experiments, CYL, JWW, LHC and JHZ contributed to data analysis; LHC
and JHZ wrote the paper. All authors read and approved the final
manuscript.
Lin et al. BMC Cancer 2013, 13:302
/>
Acknowledgments
This work was supported by National Natural Science Foundation of China
(No. 81271578), the Fundamental Research Funds for the Central Universities
(No. 09ykpy56), Scientific Research Foundation for the Returned Overseas
Chinese Scholars, State Education Ministry and Funds for Pearl River Science
& Technology Star of Guangzhou City.
Author details
1
Department of Ultrasound, State Key Laboratory of Oncology in South
China, Sun Yat-Sen University Cancer Center, Guangzhou 510060, P.R. China.
2
School of Electronic and Information Engineering, South China University of
Technology, Guangzhou 510640, P.R. China. 3Department of Anesthesiology,
State Key Laboratory of Oncology in South China, Sun Yat-Sen University
Cancer Center, Guangzhou 510060, P.R. China. 4Department of Radiation
Oncology, State Key Laboratory of Oncology in South China, Sun Yat-Sen
University Cancer Center, Guangzhou 510060, P.R. China.
Received: 6 November 2012 Accepted: 14 June 2013
Published: 21 June 2013
References
1. Groheux D, Giacchetti S, Espié M, Rubello D, Moretti JL, Hindié E: Early
monitoring of response to neoadjuvant chemotherapy in breast cancer
with 18F-FDG PET/CT: defining a clinical aim. Eur J Nucl Med Mol Imaging
2011, 38:419–425.
2. Ah-See ML, Makris A, Taylor NJ, Harrison M, Richman PI, Burcombe RJ,
Stirling JJ, D'Arcy JA, Collins DJ, Pittam MR, Ravichandran D, Padhani AR:
Early changes in functional dynamic magnetic resonance imaging
predict for pathologic response to neoadjuvant chemotherapy in
primary breast cancer. Clin Cancer Res 2008, 14:6580–6589.
3. Bellomi M, Petralia G, Sonzogni A, Zampino MG, Rocca A: CT perfusion for
the monitoring of neoadjuvant chemotherapy and radiation therapy in
rectal carcinoma: initial experience. Radiology 2007, 244:486–493.
4. Brindle K: New approaches for imaging tumour responses to treatment.
Nat Rev Cancer 2008, 8:94–107.
5. Ellis PA, Smith IE, McCarthy K, Detre S, Salter J, Dowsett M: Preoperative
chemotherapy induces apoptosis in early breast cancer. Lancet 1997,
349:849.
6. Chang J, Ormerod M, Powles TJ, Allred DC, Ashley SE, Dowsett M:
Apoptosis and proliferation as predictors of chemotherapy response in
patients with breast carcinoma. Cancer 2000, 9:2145–2152.
7. Hamstra DA, Galbán CJ, Meyer CR, Johnson TD, Sundgren PC, Tsien C,
Lawrence TS, Junck L, Ross DJ, Rehemtulla A, Ross BD, Chenevert TL:
Functional diffusion map as an early imaging biomarker for high-grade
glioma: correlation with conventional radiologic response and overall
survival. J Clin Oncol 2008, 26:3387–3394.
8. Kyriazi S, Collins DJ, Messiou C, Pennert K, Davidson RL, Giles SL, Kaye SB,
Desouza NM: Metastatic ovarian and primary peritoneal cancer: assessing
chemotherapy response with diffusion-weighted MR imaging–value of
histogram analysis of apparent diffusion coefficients. Radiology 2011,
261:182–192.
9. Liu T, Mansukhani MM, Benson MC, Ennis R, Yoshida E, Schiff PB, Zhang P,
Zhou J, Kutcher GJ: A feasibility study of novel ultrasonic tissue
characterization for prostate-cancer diagnosis: 2D spectrum analysis of
in vivo data with histology as gold standard. Med Phys 2009,
36:3504–3511.
10. Liu T, Lizzi FL, Silverman RH, Kutcher GJ: Ultrasonic tissue characterization
using 2-D spectrum analysis and its application in ocular tumor
diagnosis. Med Phys 2004, 31:1032–1039.
11. Yang M, Krueger TM, Miller JG, Holland MR: Characterization of anisotropic
myocardial backscatter using spectral slope, intercept and midband fit
parameters. Ultrason Imaging 2007, 29:122–134.
12. Kumon RE, Pollack MJ, Faulx AL, Olowe K, Farooq FT, Chen VK, Zhou Y,
Wong RC, Isenberg GA, Sivak MV, Chak A, Deng CX: In vivo
characterization of pancreatic and lymph node tissue by using EUS
spectrum analysis: a validation study. Gastrointest Endosc 2010, 71:53–63.
13. Lizzi FL: Ultrasonic scatterer-property images of the eye and prostate.
Proc 1997 IEEE Ultrasonics Symp 1997:1109–1116.
14. Vlad RM, Brand S, Giles A, Kolios MC, Czarnota GJ: Quantitative ultrasound
characterization of responses to radiotherapy in cancer mouse models.
Clin Cancer Res 2009, 15:2067–2075.
Page 8 of 9
15. Banihashemi B, Vlad R, Debeljevic B, Giles A, Kolios MC, Czarnota GJ:
Ultrasound imaging of apoptosis in tumor response: novel preclinical
monitoring of photodynamic therapy effects. Cancer Res 2008,
68:8590–8596.
16. Lee J, Karshafian R, Papanicolau N, Giles A, Kolios MC, Czarnota GJ:
Quantitative ultrasound for the monitoring of novel microbubble
and ultrasound radiosensitization. Ultrasound Med Bio. 2012,
38:1212–1221.
17. Hwang JY, Park J, Kang BJ, Lubow DJ, Chu D, Farkas DL, Shung KK,
Medina-Kauwe LK: Multimodality imaging in vivo for preclinical
assessment of tumor-targeted doxorubicin nanoparticles. PLoS One
2012, 7:e34463.
18. Sadeghi-Naini A, Falou O, Czarnota GJ: Quantitative ultrasound spectral
parametric maps: Early surrogates of cancer treatment response. In Prof.
34th Annual Intl. Conf. Proc. IEEE Eng Med Biol Soc. ; 2012:2672–2675.
19. Lizzi FL, Greenebaum M, Feleppa EJ, Elbaum M, Coleman DJ: Theoretical
framework for spectrum analysis in ultrasonic tissue characterization.
J Acoust Soc Am 1983, 73:1366–1373.
20. Lizzi FL, Astor M, Feleppa EJ, Shao M, Kalisz A: Statistical framework for
ultrasonic spectral parameter imaging. Ultrasound Med Biol 1997,
23:1371–1382.
21. Lizzi FL, Astor M, Liu T, Deng C, Coleman DJ, Silverman RH: Ultrasonic
spectrum analysis for tissue assays and therapy evaluation. Int J Imaging
Syst Technol 1997, 8:3–10.
22. Hlatky L, Hahnfeldt P, Folkman J: Clinical application of antiangiogenic
therapy: microvessel density, what it does and doesn’t tell us. J Natl
Cancer Inst 2002, 94:883–893.
23. Rajan R, Esteva FJ, Symmans WF: Pathologic changes in breast cancer
following neoadjuvant chemotherapy: implications for the assessment of
response. Clin Breast Cancer 2004, 5:235–238.
24. Rajan R, Poniecka A, Smith TL, Yang Y, Frye D, Pusztai L, Fiterman DJ,
Gal-Gombos E, Whitman G, Rouzier R, Green M, Kuerer H, Buzdar AU,
Hortobagyi GN, Symmans WF: Change in tumor cellularity of
breast carcinoma after neoadjuvant chemotherapy as a variable
in the pathologic assessment of response. Cancer 2004,
100:1365–1373.
25. Czarnota GJ, Kolios MC, Hunt JW, Sherar MD: Ultrasound imaging of
apoptosis. DNA-damage effects visualized. Methods Mol Biol 2002,
203:257–277.
26. Lizzi FL, King DL, Rorke MC, Hui J, Ostromogilsky M, Yaremko MM, Feleppa EJ,
Wai P: Comparison of theoretical scattering results and ultrasonic data from
clinical liver examinations. Ultrasound Med Biol 1988, 14:377–385.
27. Vlad RM, Saha RK, Alajez NM, Ranieri S, Czarnota GJ, Kolios MC: An
increase in cellular size variance contributes to the increase in
ultrasound backscatter during cell death. Ultrasound Med Biol 2010,
36:1546–1558.
28. Taggart LR, Baddour RE, Giles A, Czarnota GJ, Kolios MC: Ultrasonic
characterization of whole cells and isolated nuclei. Ultrasound Med Biol
2007, 33:389–401.
29. Kolios MC, Czarnota GJ, Lee M, Hunt JW, Sherar MD: Ultrasonic spectral
parameter characterization of apoptosis. Ultrasound Med Biol 2002,
28:589–597.
30. Oelze ML, Zachary JF, O'Brien WD Jr: Parametric imaging of rat mammary
tumors in vivo for the purposes of tissue characterization. J Ultrasound
Med 2002, 21:1201–1210.
31. Czarnota GJ, Papanicolau N, Lee J, Karshafian R, Giles A, Kolios MC: Novel
low-frequency ultrasound detection of apoptosis in vitro and in vivo
[abstract]. Ultrason Imaging 2008, 29:237–238.
32. Zhou J, Zhang P, Osterman KS, Woodhouse SA, Schiff PB, Yoshida EJ, Lu ZF,
Pile-Spellman ER, Kutcher GJ, Liu T: Implementation and validation of an
ultrasonic tissue characterization technique for quantitative assessment
of normal-tissue toxicity in radiation therapy. Med Phys 2009,
36:1643–1650.
33. Papanicolau N, Karshafian R, Sadeghian A, Kolios M, Czarnota G:
Conventional frequency evaluation of tumor cell death in response to
treatment in vivo (abstract). J Acoust Soc Am 2010, 128:2365.
34. Symmans WF, Peintinger F, Hatzis C, Rajan R, Kuerer H, Valero V, Assad L,
Poniecka A, Hennessy B, Green M, Buzdar AU, Singletary SE, Hortobagyi GN,
Pusztai L: Measurement of residual breast cancer burden to predict
survival after neoadjuvant chemotherapy. J Clin Oncol 2007,
25:4414–4422.
Lin et al. BMC Cancer 2013, 13:302
/>
Page 9 of 9
35. Park SH, Moon WK, Cho N, Song IC, Chang JM, Park IA, Han W, Noh DY:
Diffusion-weighted MR imaging: pretreatment prediction of response to
neoadjuvant chemotherapy in patients with breast cancer. Radiology
2010, 257:56–63.
36. Chenevert TL, Stegman LD, Taylor JM, Robertson PL, Greenberg HS,
Rehemtulla A, Ross BD: Diffusion magnetic resonance imaging: an early
surrogate marker of therapeutic efficacy in brain tumors. J Natl Cancer
Inst 2000, 92:2029–2036.
doi:10.1186/1471-2407-13-302
Cite this article as: Lin et al.: Ultrasonic spectrum analysis for in vivo
characterization of tumor microstructural changes in the evaluation of
tumor response to chemotherapy using diagnostic ultrasound. BMC
Cancer 2013 13:302.
Submit your next manuscript to BioMed Central
and take full advantage of:
• Convenient online submission
• Thorough peer review
• No space constraints or color figure charges
• Immediate publication on acceptance
• Inclusion in PubMed, CAS, Scopus and Google Scholar
• Research which is freely available for redistribution
Submit your manuscript at
www.biomedcentral.com/submit