The impact of KRAS mutations on VEGF-A production and tumour vascular network
Bạn đang xem bản rút gọn của tài liệu. Xem và tải ngay bản đầy đủ của tài liệu tại đây (2.32 MB, 11 trang )
Figueras et al. BMC Cancer 2013, 13:125
/>
RESEARCH ARTICLE
Open Access
The impact of KRAS mutations on VEGF-A
production and tumour vascular network
Agnès Figueras1†, Maria Antonia Arbos2†, Maria Teresa Quiles2, Francesc Viñals1,3, Josep Ramón Germà4
and Gabriel Capellà1*
Abstract
Background: The malignant potential of tumour cells may be influenced by the molecular nature of KRAS
mutations being codon 13 mutations less aggressive than codon 12 ones. Their metabolic profile is also different,
with an increased anaerobic glycolytic metabolism in cells harbouring codon 12 KRAS mutations compared with
cells containing codon 13 mutations. We hypothesized that this distinct metabolic behaviour could be associated
with different HIF-1α expression and a distinct angiogenic profile.
Methods: Codon13 KRAS mutation (ASP13) or codon12 KRAS mutation (CYS12) NIH3T3 transfectants were analyzed
in vitro and in vivo. Expression of HIF-1α, and VEGF-A was studied at RNA and protein levels. Regulation of VEGF-A
promoter activity was assessed by means of luciferase assays using different plasmid constructs. Vascular network was
assessed in tumors growing after subcutaneous inoculation. Non parametric statistics were used for analysis of results.
Results: Our results show that in normoxic conditions ASP13 transfectants exhibited less
HIF-1α protein levels and activity than CYS12. In contrast, codon 13 transfectants exhibited higher VEGF-A mRNA and
protein levels and enhanced VEGF-A promoter activity. These differences were due to a differential activation of Sp1/
AP2 transcription elements of the VEGF-A promoter associated with increased ERKs signalling in ASP13 transfectants.
Subcutaneous CYS12 tumours expressed less VEGF-A and showed a higher microvessel density (MVD) than ASP13
tumours. In contrast, prominent vessels were only observed in the latter.
Conclusion: Subtle changes in the molecular nature of KRAS oncogene activating mutations occurring in tumour cells
have a major impact on the vascular strategy devised providing with new insights on the role of KRAS mutations on
angiogenesis.
Keywords: KRAS mutations, HIF-1α, Vascular endothelial growth factor A, VEGF-A promoter, Tumour angiogenesis
Background
Ras proteins have been the subject of intense research as
signalling molecules in normal and neoplastic cells [1].
Yet, a complete understanding of their exact mode of action is still to come. Among the three RAS genes (H-RAS,
KRAS and N-RAS) KRAS is the most commonly activated
in human tumours. Several lines of evidence suggest that
not only the presence or absence of a KRAS mutation but
its molecular nature influences tumour cell behaviour
[2,3]. A reduced transforming capacity of codon 13 mutation as compared with codon 12 is observed in vitro and
* Correspondence:
†
Equal contributors
1
Translational Research Laboratory, Institut Català d’Oncologia-IDIBELL, Gran
Via 199-203, 08908 L’Hospitalet del Llobregat, Barcelona, Spain
Full list of author information is available at the end of the article
in vivo, with short latency times to tumour-appearance for
codon 12 KRAS overexpressing cells [4-6]. Moreover, our
previous results indicate that distinct mutations associate
with specific metabolic phenotypes, an increased anaerobic
glycolytic metabolism in cells containing codon 12 KRAS
compared with cells containing codon 13 mutations.
Switching to a glycolytic metabolism is a rapid adaptation
to hypoxia that can be related to HIF1α expression [7].
Perpetual blood vessel formation and remodelling (angiogenesis) is a hallmark of cancer and a prerequisite for
three-dimensional tumour growth, invasion, and metastasis
[8]. Hypoxia, by inducing HIF-1α, promotes the expression
of VEGF-A, the main pro-angiogenic hypoxia-induced gene
[9]. However, oncogenes are also per se potent inductors
of angiogenesis [10]. Ras proteins are a paradigm for
© 2013 Figueras et al.; licensee BioMed Central Ltd. This is an Open Access article distributed under the terms of the Creative
Commons Attribution License ( which permits unrestricted use, distribution, and
reproduction in any medium, provided the original work is properly cited.
Figueras et al. BMC Cancer 2013, 13:125
/>
oncogene-dependent induction of tumour angiogenesis due
to their involvement in the regulation of key pro and anti
angiogenic factors [11-14]. However, its cross-talk with
hypoxia-dependent signals is not so clear.
To gain further insight into the metabolic potential
and distinct aggressiveness of different activating KRAS
mutations, we examined the expression levels of HIF-1α
and VEGF-A in stable mutated 12 and 13 NIH3T3
transfectants. Our results in vivo and in vitro indicate
that the distinct KRAS mutations generated different
normoxic HIF-1α responses. Moreover, different VEGFA expression patterns were observed that are independent of the HIF-1α status but dependent upon ERKs
stimulation. These alterations associated with distinct
tumoral angiogenic profiles.
Page 2 of 11
[16]. Tumours were surgically removed and analysed when
they reached a diameter of ~ 1 cm.
Protein expression analysis
Western blotting
NIH3T3 cells were produced as previously described
[4,15], with plasmid DNA containing a KRAS minigene
with a G:C A:T mutation (CYS12) at the first position of
codon 12 (pMLK12), a G:C A:T mutation (ASP13) at the
second position of codon 13 (pMLK13), and a control
plasmid containing the expression vector alone (pMLneo).
pMLK12, pMLK13, and pMLKwt plasmids were a gift of
Dr. Manuel Perucho of the Burnham Institute at La Jolla,
CA. Levels of expression of the KRAS protein in the selected clones used were similar [15].
Cells and tissue samples were lysed with RIPA buffer (1%
SDS 10%, 1% NP40, 0.5% de Sodium deoxycholate) plus
protease inhibitors. Forty μg of each protein sample were
subjected to 10% SDS/PAGE under reducing conditions,
and transferred to polyvinylidene fluoride membranes
(PVDF-Bio-Rad, Hercules, CA). Membranes were blocked
in TBST buffer (0.9% NaCl, 0.02 M Tris (pH 7.5), 0.05%
Tween 20; 5% skimmed milk; 1 h, RT), and probed with
primary antibodies: anti-pan-Ras (Oncogene Research
Products San Diego CA mouse monoclonal clone RAS10
cat: OP40), anti-HIF-1α (a generous gift from Dr. Edurne
Berra, CICBiogune, Bilbao, Spain), anti-GLUT-1 (Abcam,
Cambridge, UK, ref. Ab652), anti-VEGF-A (Neomarkers,
CA, Ref. MS-35), anti-Sp1 (Santa Cruz, CA, ref. SC-59),
anti-p-ERKs (Sigma-Aldrich Inc. Monoclonal Anti-Map
Kinase activated clone MAPK-YT), anti-p-Akt (Cell
Signaling Rabbit Phospho-Akt (Ser473) antibody #9271)
and anti-Tubulin (Sigma-Aldrich Inc). Detection was
performed using peroxidase-conjugated secondary antibodies. The resulting complexes were visualized by enhanced chemiluminiscence autoradiography (Amersham
Life Science,Chicago,Il). Autoradiographs were quantified
by scanning densitometry Quantity One Quantitation
Software™ (Bio-Rad, Hercules, CA).
Cell culture
Enzyme linked immunosorbent assay/ELISA
Clones were cultured in DMEM supplemented with 20%
Fetal Calf Serum and 500 μg/ml of neomycin G418. Mutations were verified by direct sequencing prior to the
initiation of every experiment.
Expression levels of culture medium cells and tissue associated VEGF were also examined by enzyme linked immunosorbent assay (ELISA: Quantikine immunoassay kits; R&D
Systems) according to the manufacturer’s instructions.
Inhibitors incubation
Vegf Immunohistochemistry
Transfected cells cultured 12 hours in FCS deprivation
were incubated 15 minutes with the corresponding kinase
inhibitor maintaining FCS deprivation. PI3K inhibitor
LY294002 (15 μM), p44/42 ERKs inhibitors PD98859
(0.06 mM) or U0126 (20 μM) were obtain by Calbiochem,
Ca. Afterwards, next fifteen minutes cells were in contact
with FBS and without inhibitors. At the end of incubations, transfected cells were removed from the dishes and
we obtained proteins or mRNA as convinced.
It was performed on paraffin-embedded tissues with VEGF
(C-1) mouse monoclonal antibody (Santa Cruz Biotechnology Cat#sc-7269). We used anti-mouse DakoCytomation
EnVision System HRP to visualize the reaction.
Methods
Transfectants procedures
Generation of transfectants
Tumour model
Athymic male nu/nu Swiss mice (Charles River Laboratory,
Sta Perpetua, Spain) were injected subcutaneously (s.c.)
as previously described [4], according to the protocols approved by the Institutional Animal Care and Use Committee. Tumours were measured periodically with a calliper,
and the volume was calculated as length × width2 × 1/2
RNA expression
Total RNA extraction and RT-PCR
Trizol Reagent (Life Technologies Gibco) according to
manufacturer’s instructions was used to total mRNA extraction. One μg of RNA was reverse-transcribed into
cDNA using pdN6 primers using High Capacity Reverse
Transcriptase (Applied Biosystems, Foster city CA). Subsequent Real-Time PCR reaction for Vegf-A mRNA levels
was performed in duplo in the LightCyclerW System
SYBGreen480 (Roche) using primers: Rev: CAC
CTTCATGGGACTTCTGCT; Fwd: GCACTGGACC
CTGGCTTTA. Angpt2 mRNA levels were assessed in
Figueras et al. BMC Cancer 2013, 13:125
/>
duplo using inventoried TAQMAN gene expression
assays Mm00545822 (Applied Biosystem, Foster city
CA). Every gene expression quantification was corrected
using three housekeeping genes: mitochondrial ribosomal protein L19 Mn00452754; Hypoxanthine guanine
phosphoribonyl transferase 1 Mn01545399 and Peptidylpropyl isomerase A Mn02342430. Threshold cycle
data were analyzed using the following formula: ratio =
((Etarget)ΔCP target (control–sample)) [17].
Actinomycin D assay
Cellular clones were cultured in 12 well plates and
incubated 15, 30 and 180 minutes with Actinomycin D
(5 μg/ml) just before RNA total extraction was performed
using Trizol Reagent (Life Technologies Gibco) and following manufacturer’s protocol.
VEGF promoter plasmid transfections and luciferase
determination
NIH3T3 stable KRAS clones were transfected with three
different Vegf promoter constructions and a plasmid
containing multiple HRE inserts that were a kind gift of Dr.
Pages and Dra Berra [18-21]. Construct 1 contained the
complete Vegf Promoter, construct 2 lacked AP2 and Sp1
response elements and construct 3 lacked HRE elements.
Lipofectamine 2000 was used as the transfection agent
according to manufacturer’s instructions. (Invitrogen Life
Technologies S.A.). At 48 h post transfection, luciferase
expression was determined using the Dual Luciferase
Reporter System (Promega), and the relative luciferase
value was determined after normalizing to the β-Gal control. Results are expressed as mean of three independent
experiments.
Determination of DNA synthesis in HUVEC
HUVE cells (obtained from Advancell company) were
deprived of growth factors for 24 h in 199 medium
containing 0.1% Fetal Calf Serum. Cells were then stimulated 48 h with conditioned growth media from the different NIH3T3 clones, containing 0.25 μCi/ml (6-3H)
thymidine (Amersham Pharmacia Biotech) (3 mM final
concentration). After 20 hours of incubation, the incorporated radioactivity was counted by liquid scintillation.
Results are expressed as a percentage of the (6-3H) thymidine incorporation in the presence of the medium of
control NIH3T3.
Ras activation assay
One mg of the protein lysate from ASP13 or CYS12
NIH3T3 cell clones was added to 30 μg of glutathione Stransferase (GST)- RBD fusion protein. RBD, encompassing
amino acids 51 to 131 of Raf-1 protein, is the minimal domain required for the binding of Ras-GTP. Presence of active Ras was detected by Western blotting with monoclonal
Page 3 of 11
anti-pan-Ras (Oncogene Research Products mouse monoclonal clone RAS10 cat: OP40). Autoradiography bands
were quantified by scanning densitometry using Quantity
One Quantitation Software™ (Bio-Rad Laboratories, S.A.,
Alcobendas, Madrid).
Assessment of vascular patterns
MicroVessel Density (MVD)
It was assessed using rat anti-PECAM (BD Pharmingene,
NJ USA 550274/MEC13.3) staining on cryopreserved sections. MVD was evaluated as mean of the number of vessels in 5 hot spot fields at 400X. Only endothelial PECAM
staining was considered [22].
Double immunofluorescence was used to evaluate
Desmin(+)/PECAM(+). Rat anti-mouse monoclonal PECAM (BD Pharmingene,NJ USA 550274/MEC13.3) and
rabbit anti-Desmin antibody (Lab Vision/NeoMarkers, CA,
USA; RB-9014) were simultaneously incubated overnight at
4°C. Secondary goat anti-rat Alexa 546 and anti-rabbit
Alexa 488 were incubated for 1 h. After washing, staining
was evaluated in five hot spot fields at 400X. LEICA software counted the areas with Desmin and PECAM overlapping staining and also measured major diameters of the
lumen of vessels. Correlation was performed with the presence of necrosis.
Immunohistochemistry
Rabbit anti α-Smooth muscle actin (Lab Vision/
NeoMarkers, CA, USA; RB-9010, ready to use) staining
was performed on paraffin-embedded tissue sections. Envision anti-rabbit (Dako Denmark A/S, Glostrup, DK) plus
diaminobenzidine were used to visualize the reaction.
Immunoreactivity was semiquantitatively evaluated by
comparing the level of expression between distinct groups.
Carbonic anhydrase IX (Ab15086,Abcam plc,. Cambridge,
UK) and GLUT-1 (Ab652; Abcam plc. Cambridge UK)
staining was also performed. Cytoplasmic positive cells
were expressed as a percentage of total cells counted. For
all antibodies, no staining was observed with negative control samples (absence of primary antibody, or incubation
with an irrelevant antibody or IgG).
Results
KRAS codon-specific mutations induce a distinct
HIF1-α and VEGF-A response
In normal cell culture conditions basal HIF-1α protein
levels were higher in CYS12 mutants compared with
ASP13 expressing cells or control NIH3T3 (Figure 1A).
As expected, these basal levels of HIF-1α in the different
clones analyzed increased when cells were subjected
to hypoxia (data not shown). In order to confirm that
HIF-1α protein was functional in our cells, we
transfected NIH3T3 and NIH3T3 KRAS mutants cells
(ASP13 or CYS12) with an extra DNA plasmid where
Figueras et al. BMC Cancer 2013, 13:125
/>
Page 4 of 11
luciferase expression was controlled by a hypoxic response element (HRE). As shown in Figure 1B, a clear
correlation between HIF-1α protein levels and luciferase
activity – reflecting the quantity of HIF-1α attached to
the HRE [21] – existed. These findings suggest that the
transcription factor was functional in normoxic cells and
presented a higher activity in CYS12 KRAS cells.
Next, we decided to evaluate the impact of this differential expression on two HIF-1α-dependent genes,
GLUT-1 the ubiquitous glucose transporter protein, and
VEGF-A [9]. As observed in Figure 1C, and as expected
from its more glycolytic phenotype, CYS12 mutant cells
presented higher total levels of GLUT-1 as well as an increase in the glycosylated forms [23], when compared
with ASP13 cells. Surprisingly, VEGF-A protein levels
were higher in ASP13 cells than in CYS12 (Figure 1C).
To confirm these differences, we analysed VEGF-A
mRNA levels in our cells. A 120% increase in mRNA levels
was observed in ASP13 cells compared with CYS12
transfectants (Figure 2A). Moreover, VEGF-A levels secreted in the cell culture medium were 11 times higher in
ASP13 cells compared with CYS12 (Figure 2B). Finally, this
VEGF-A was functional as addition of ASP13-transfectant
conditioned medium to HUVEC endothelial cells resulted
in higher thymidine incorporation (Figure 2C). These results suggest that KRAS ASP13 mutation activates a pathway that may overpass regulation of VEGF-A by HIF-1α.
Mechanisms underlying the differential VEGF-A over
expression in ASP13 cells
The increased amount of VEGF-A mRNA observed in
ASP13 transfectants was not associated with differences in
mRNA stability, measured when actinomycin D was
added to the medium (Figure 3A). In contrast, activity of a
construct containing the first 1176 bp of the VEGF-A promoter was 3 times higher in ASP13 cells compared to
CYS12 mutated clones (P < 0.02; Figure 3B Construct 1).
Together, these results indicated that differences between
cells were caused by different transcriptional activities of
the VEGF-A promoter.
Deletion of HRE within the VEGF-A promoter in all
clones did not affect its activity. (Figure 3B Construct 2 vs
Construct 1). These results further confirm the
HIF-1α independent regulation of VEGF-A expression. In
contrast, the selective deletion of SP1/AP2 response elements resulted in a significant decrease of VEGF promoter
activity in both transfectants that was only significant to
ASP 13 mutants (Figure 3B Construct 3 vs Construct 1).
AP2 and Sp1 are two transcription factors mainly controlled by Ras-Raf-ERKs pathway activation. [24]. In
order to measure the pathway activity, we first measured
Ras protein activity levels able to stimulate the ERK cascade. ASP13 clone showed an increased capacity to activate Raf (Figure 4A) that was associated with increased
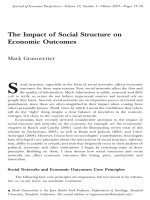
Figure 1 HIF-1α, GLUT-1 and VEGF-A in cultured KRAS ASP13
and CYS12 transfectants. A) HIF-1α protein expression was
measured by western blot in NIH3T3 control cells (0), three
independent clones KRAS CYS12 mutant (1, 2 and 3 show different
transfected clones) and two independent clones KRAS ASP13 mutant
(Clones 4 and 5). Tubulin was measured as a loading control.
B) Luciferase activity after transfection of HIF-1α-response element
promoter in NIH3T3, clone 3 KRAS CYS12 mutant and clone 4 KRAS
ASP13 mutant. Results are average ± SE of three independent
experiments. Activity in ASP13 mutants was significantly lower than in
CYS12 mutants (P < 0.05). C) Protein extracts were obtained from clone
4 KRAS ASP13 mutant and from clone 3 KRAS CYS12 mutant. GLUT-1,
VEGF-A and Tubulin (as a loading control) were immunodetected by
western blotting. A representative blot is shown. The electrophoretic
pattern of GLUT-1 depicts its glycosylation.
Figueras et al. BMC Cancer 2013, 13:125
/>
Page 5 of 11
pERK levels (Figure 4B), while no differences were observed on PI3K cascade measured by pAKT levels.
Accordingly, when ERKs activity was inhibited with
U0126 for 15 minutes, a decay in mRNA VEGF-A levels
was observed in ASP13 clone that was not evident in
CYS12 (Figure 4C). No differences in total Sp1 protein
levels were observed in mutants clones ASP13 or CYS12
(Figure 4D). In all, these results indicate that Ras-Raf
-ERK-AP2/Sp1 signalling cascade is responsible for
VEGF-A overexpression in ASP13 cells.
To study if these differences detected in vitro could
cause a difference in the angiogenic patterns and tumoral capacity we subcutaneously injected NIH3T3 control cells and transfected clones (ASP13 or CYS12) in
nude mice. In agreement with our previous observations
latency period of tumors arising from distinct ASP13
transfectants was longer than for CYS12 tumors (ASP13
32.2 ± 8.9 days vs CYS12 10.4 ± 2.4; p < 0.04) (Table 1).
HIF-1α activity and hypoxia was assessed though immunostaining of GLUT-1 and Carbonic Anhydrase IX. In
concordance with in vitro observations, GLUT-1 immunostaining was more intense in CYS12 tumors albeit the
percentage of positive cells did not among the two
transfectants (Figure 5A). Differences in the expression
of Carbonic Anhydrase IX were more intense, being the
percentage of positive cells 4 times higher in CYS12
tumors (Figure 5B and C).
We confirmed that mRNA VEGF-A levels were also
higher in ASP13 tumours compared with CYS12 (Figure
6A). The same trend was observed at the protein VEGF-A
level, as assessed by ELISA and immunostaining (Figure 6B
and C). In contrast, angiogenic factor Angiopoietin 2 levels
did not show differences between tumours (Figure 6A).
Tumor growth vascular patterns
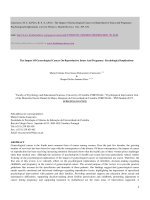
Figure 2 Expression and activity of VEGF-A in KRAS
transfectants. A) VEGF-A mRNA levels were measured by RT-PCR in
ASP13 or CYS12 cells. Data are expressed as average ± S.E. of 2-ΔCT
(ASP13: 0.468 ± 0.12; CYS12: 0.253 ± 0.08; P = 0.07) B) VEGF-A protein
levels were measured by ELISA in conditioned media from NIH3T3
control cells, ASP13 and CYS12 transfectants (NIH3T3: 51.8 ± 3.9 pg
VEGF-A165/ml medium; ASP13: 630.69 ± 12.1 pg VEGF-A165/ml
medium; CYS12: 119.14 ± 6.9 pg VEGF-A165/ml medium) ASP13 cell
increase five times VEGF-A 165 protein expression than CYS12.
(P < 0.05). C) Conditioned media obtained from NIH3T3 control cells,
ASP13 and CYS12 transfectants was added to HUVEC cells cultured and
thymidine incorporation measured. Results are average ± S.E. of 3
independent experiments. The conditioned media from ASP13
transfectants increased HUVEC proliferation.
The distinct VEGF-A production observed was associated with a specific vascular pattern. On the one hand,
vascular hotspots zones with distended vessels were
apparent in ASP13 tumours, with generation of
haemorragic and necrosis zones (Figure 7A). On the
other hand, microvessel density (MVD) was higher in
CYS12 (Figure 7B), being the diameter of vessels
higher in ASP13 tumours (Figure 7C). Finally, vessels
from ASP13 tumours were surrounded by mural cells
that stained positive for α-Smooth Muscle Actin and
Desmin proteins, while mural cells were scarce around
CYS12 tortuous vessels (Figure 7D and E). These different
vascular patterns do not associate with significant
differences in the degree of necrosis among the two
transfectants.
Discussion
In the context of KRAS-driven tumourigenesis, mutations
located at codon 12 and 13 display distinct malignant
Figueras et al. BMC Cancer 2013, 13:125
/>
Page 6 of 11
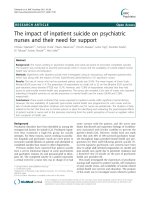
Figure 3 Functional analysis of VEGF-A PROMOTER. A) ASP13 or CYS12 cells were treated with actinomycin D. After the time indicated mRNA
was obtained and VEGF-A mRNA levels measured by RT-PCR. Results are the average of two independent experiments. No differences in VEGF-A
mRNA stability were observed in ASP13 or CYS12 cells. B) Luciferase activities after transfection of the complete VEGF-A promoter (Construct 1)
or two partial deletions (Construct 2 and 3). VEGF-A promoter activity was increased for all constructs in Asp13 when compared to CYS12
transfectants. Promoter activity was decreased after deletion of the AP2/Sp1 response elements in ASP13 cells (P < 0.011). Results are the average ± SE
of four independent experiments.
potential and differentially regulate apoptosis, cell cycle
[4,15], or metabolic profiles [25]. Here we show that minor
differences in the molecular nature of KRAS mutations
stimulate distinct intracellular signalling pathways in
normoxic conditions with different impact in basal levels
of HIF-1α VEGF-A production and generation of a distinct vascular network in tumours.
Upregulation of VEGF by the KRAS pathway has been
previously shown [26]. Here we show that cells expressing
ASP13 KRAS mutant present higher levels of VEGF-A,
the main pro-angiogenic gene induced by hypoxia, in the
absence of high HIF-1α levels [9]. In contrast, CYS12 mutants present a high glycolytic phenotype [25] through
HIF-1α-dependent induction of glycolytic enzymes including GLUT-1 glucose transporter supporting the role of
HIF-1α in switching to a glycolytic metabolism [7].
We have attempted to gain insight into the molecular
mechanisms underlying the differential VEGF-A overexpression, apparently independent of HIF-1α in ASP13
clones, Our data support a direct transcriptional effect of
ASP13 acting on VEGF-A promoter. This effect is mediated
by a distinct activation of Raf-ERKs pathway and AP2/Sp1
elements within the proximal VEGF-A promoter. Of note it
is independent of hypoxia-dependent elements and of PI3K
activity. Extracellular signals that induce VEGF-A through
this proximal region include, among others, growth factors
Figueras et al. BMC Cancer 2013, 13:125
/>
Page 7 of 11
Figure 4 Signalling pathway activation analysis. A) Quantification of active Ras present in ASP13 and CYS12 cells. ASP13 transfectants showed
more Ras activation (P = 0.026). B) Analysis of p-ERKs, p-Akt and Tubulin (as a loading control) from ASP13 and CYS12 cells treated or not with
U0126 (specific inhibitor of MEK and in consequence of p-ERK) and LY294002 (specific inhibitor of PI3K and in consequence of p-Akt) is depicted.
p-ERKs levels were higher in ASP13 transfectants than CYS12, while no differences were observed in p-Akt levels. Representative western blots are
shown. C) mRNA VEGF-A levels as 2-ΔCT; ASP13 Control 0.40 ± 0.07; +LY294002 0.49 ± 0.1, +U0126 0.12 ± 0.04; CYS12 Control 0.08 ± 0.009,
+LY294002 0.05 ±0.02, +U0126 0.046 ± 0.02. Treatment with U0126 MEK inhibitor but not with PI3K inhibitor LY294002 resulted in a reduction of
mRNA VEGF-A levels in ASP13 transfectants (P = 0.031). D) Sp1 transcription factor levels were not different in ASP13 and CYS12 cells. Levels of
Sp1 and Tubulin (as a loading control) were assayed in extracts from NIH3T3 cells (N), different ASP 13 clones (4, 5, 6 and 7) and different CYS 12
clones (1, 2 and 3).
such as EGF, insulin and PDGF in fibroblasts [18], prostaglandin E2 in human muscle cells [27], M-CSF in monocytes [28] and lysophosphatidic acid (LPA) in ovarian
cancer cells [29]. All of them affect promoter activity
through modulation of at least Sp1 transcriptional activity.
Noteworthy, Sp1 is also regulated by different signalling
pathways including ERKs, PKA and PI3K-Akt [18,30]. We
have not detected changes in total Sp1 protein levels between ASP13 and CYS12 mutants, but other mechanisms
with impact in the activity of this transcription factor could
be implicated, such as acetylation, sumoylation, glycosylation or phosphorylation [24].
In our xenograft model, ASP13 xenografts consistently
develop angiogenic sprouts of large diameter, invested by
mural cells. These structures seem to be sufficient to
support the increased utilization of the oxidative pentose
phosphate pathway observed in the more benign ASP13 tumours [25]. While development of these complex vascular
structures may account for the initial delay observed in
tumour growth, we speculate that they are able to support
the very rapid growth occurring later [4]. Nonetheless, the
presence of significant tumour necrosis and less Carbonic
anhydrase IX to hypoxic adaptation, observed in established
ASP13 tumours may depict the relative insufficiency of this
vascular tree [8]. In contrast, histological analysis reveals
that the more aggressive CYS12 tumours educe a dense
endothelial-lined microvascular network that allows an
early, steady and sustained tumour growth. This vascular
strategy appears to be effective for these tumour cells that
are more resistant to hypoxia, do not proliferate fast [31]
Table 1 Differences in latency period in vivo between ASP13 and CYS12 transfectants
ASP13
Days ± SD
Mean ± SD
CYS12
Clone 4 (n = 10)
Clone 6 (n = 10)
Clone 2 (n = 10)
Clone 5 (n = 10)
Clone 4.3 (n = 10)
Clone 4.6 (n = 10)
30,1 ± 6,5
24,5 ± 6,1
42 ± 0
9,7 ± 7,9
8.4 ± 0.9
13,2 ± 1,7
32.2 ± 8.9
10.4 ± 2.4
P < 0.04
Figueras et al. BMC Cancer 2013, 13:125
/>
Page 8 of 11
Figure 5 GLUT-1 and Carbonic anhydrase IX immunostaining in
KRAS ASP13 and CYS12 tumours. A) The percentage of GLUT-1
positive cells did not differ in CYS12 and ASP13. Intensity was higher
in CYS12 tumors. B) The percentage of Carbonic anhydrase IX
positive cells and the intensity of the immunostaining is higher in
CYS12 tumors. C) Table depicts the percentage of Carbonic
anhydrase positive cells. ASP13: 11.67 ± 3.07% vs CYS12:
48.57 ± 7.9%; P < 0.002).
and have relatively low energetic requirements associated
with an increased anaerobic glycolysis.
The vascular pattern observed in ASP13 xenografts is
in line with previous observations linking high VEGF-A
levels with an increased diameter of newly forming vessels [32,33]. The prominent stimulation of DNA synthesis in primary HUVECs by whole ASP13 conditioned
medium, and in a less conspicuous manner by CYS12
supernatants, propose significant paracrine effects of
tumour cell-derived VEGF-A in neovascularization [34].
Also, ASP13 tumours vessels are covered with α-Sma
(+)/Desmin(+) cells [35] further highlighting the contribution of VEGF-A to vessel maturation and tumour growth.
The retarded growth of ASP13 tumours harbouring elevated VEGF-A levels is consistent with reports challenging
Figure 6 VEGF-A expresion in KRAS ASP13 and CYS12 tumours.
A) VEGF-A mRNA and Angiopoietin-2 levels detected by real time
PCR in tumour tissue. VEGF-A was overexpressed in ASP13 tumours
when compared with CYS12 (ASP13: 0.9 ± 0.2 2-ΔCT vs CYS12: 0.4 ±
0.1 2-ΔCT; P = 0.04) while mRNA Angiopoietin-2 levels were not
different. B) VEGF-A protein levels measured by ELISA were shown
as pg of VEGF per mg of tumour lysate. VEGF-A were higher in
ASP13 tumours (ASP13: 5.5 ± 0.98 μg VEGF-A/mg tumour lysate vs
CYS12: 2.5 ± 0.6 μg VEGF-A/mg tumour lysate; P = 0.02). C) Illustrative
VEGF-A immunostaining is shown for each mutant.
Figueras et al. BMC Cancer 2013, 13:125
/>
Page 9 of 11
Figure 7 Vessel number in ASP13 and CYS12 subcutaneous tumours. A) PECAM immunohistochemistry (up) and PECAM immunofluorescence
(bottom) staining of subcutaneous tumours are shown as a representative example of each tumour mutation group. (ASP13 on the left and CYS12 on
the right). B) Microvessel density (MVD) was represented as number of vessels structures PECAM+/microfield at 400X. (CYS12 40.8 ± 8 vs ASP13 23.7 ± 6
number of PECAM (+) vessels; P = 0.002). C) Mean of vessel diameter is shown in each bar. (ASP13: 96,4 ±12,9 μm vs CYS12: 19.3 ± 2.8 μm; P < 0.0001).
D) Representative staining of ASP13 (left) and CYS12 (right) tumour tissues are shown. Up: αSMA of paraffin tumour tissue. Bottom: PECAM/Desmin
staining on cryopreserved tumour tissue. Positive mural cells were more evident in ASP13 tumours. E) PECAM/Desmin ratio analysed by LEICA software
was represented. Ratio was higher in ASP13 tumours (P < 0.0001).
the concept that VEGF is just a positive angiogenic regulator. While angiopoietin2 levels did not show differences
between transfectants, we cannot exclude a role of other
angiogenic factors in differences observed between ASP13
and CYS12 tumoral vessels [36].
The impact of the genetic background of tumour cells on
the angiogenic phenotype is relevant since they may have
consequences regarding efficacy of specific antiangiogenic
strategies. An evolving tumour with an ever-changing genetic background likely educes a dynamic vascular strategy
that may escape to specific antiangiogenic treatment such
as those targeting VEGFRs or its ligand [37]. This is of importance now that more antiangiogenic drugs are being introduced to the clinical setting and there is a need for
biomarkers that help in the selection of patients to be
treated. KRAS mutations are used as negative predictors of
antiEGFR therapies in colorectal cancer [38]. The role of
KRAS mutation as a predictive marker of bevacizumabbased treatment has been also explored. Indeed, better response rates to bevacizumab can be observed in KRAS wt
colorectal tumors when compared to KRAS mutant [39].
Of note, some authors have explored a potential differential
behaviour of codon 13 mutant tumors with no conclusive
results [40]. It will of interest to explore in the adequate
clinical setting whether our experimental observations correlate with clinical outcome in other tumor types such as
colorectal cancer.
Conclusions
Mutations in the KRAS gene are among of the most
prevalent in human tumours and they are known to have
pleiotropic effects on tumour biology. The less aggressive
ASP13 mutation, through Raf-Ras-ERKs activation of the
VEGF-A promoter, creates a prominent VEGF-A-associated vascular network in the absence of high HIF-1α
levels. This vascularisation is less effective than the dense
microvascular network observed in CYS12 tumours. In
our model system, we have shown that the molecular nature of KRAS mutations clearly influences the vascular
strategy devised by the tumour cell. These observations
provide us with a deeper insight of the complex role of
major angiogenic regulators such as VEGF on tumour vasculature development and their relationship with oncogene activation.
Competing interest
None of the authors have any financial or non-financial competing interests
in relation to this paper.
Figueras et al. BMC Cancer 2013, 13:125
/>
Authors’ contributions
AF: study concept and design; acquisition of data; analysis and interpretation
of data; drafting of the manuscript; critical revision of the manuscript. MAA:
study concept and design; acquisition of data; analysis and interpretation of
data; drafting of the manuscript; critical revision of the manuscript; MTQ:
acquisition of data; analysis and interpretation of data; critical revision of the
manuscript; FV: study concept and design; acquisition, analysis and
interpretation of data; drafting of the manuscript; critical revision of the
manuscript; obtained funding; study supervision; JRG: material support;
obtained funding; critical revision of the manuscript; GC: study concept and
design; analysis and interpretation of data; drafting of the manuscript; critical
revision of the manuscript; obtained funding; study supervision. All authors
read and approved the final manuscript.
Acknowledgements
This study was supported by grants from SAF 2009–07319, SAF2012-3363, FIS
01/1264 to Gabriel Capellà, FIS 03/0290 to Maria Antonia Arbós and from the
Ministerio de Ciencia y Tecnología (SAF2010-20859), the Spanish Ministry of
Health (RTICC RD2006-0092) and Generalitat de Catalunya (2009SGR283) to
Francesc Viñals. The research team belongs to the Network of Cooperative
Research on Cancer RD06/0020/0150 RD12/0036/0031 funded by the
Instituto Carlos III, Ministerio de Sanidad y Consumo of Spain, F05-01 from
the Fundació Gastroenterologia Dr. Francisco Vilardell, and Acción Transversal
contra el Cáncer and Fundación Científica de la AECC.
Role of the funding source
Funding sponsors had no involvement in any scientific area to this work.
Author details
1
Translational Research Laboratory, Institut Català d’Oncologia-IDIBELL, Gran
Via 199-203, 08908 L’Hospitalet del Llobregat, Barcelona, Spain. 2Institut de
Recerca Vall d’Hebron, Hospital Universitari Vall d’Hebron, Passeig de la Vall
d’Hebron 119-129, 08035, Barcelona, Spain. 3Unitat de Bioquímica i Biologia
Molecular; Departament de Ciències Fisiològiques II, Universitat de
Barcelona-IDIBELL, Feixa Llarga s/n, 08908 L’Hospitalet del Llobregat,
Barcelona, Spain. 4Department of Medical Oncology, Institut Català
d’Oncologia, Gran Via 199-203, 08908 L’Hospitalet del Llobregat, Barcelona,
Spain.
Received: 18 October 2012 Accepted: 8 March 2013
Published: 18 March 2013
References
1. Malumbres M, Carnero A: Cell cycle deregulation: a common motif in
cancer. Prog Cell Cycle Res 2003, 5:5–18.
2. Finkelstein SD, et al: Determination of tumor aggressiveness in colorectal
cancer by K-ras-2 analysis. Arch Surg 1993, 128:526–531. discussion 531–2.
3. Finkelstein SD, et al: Genotypic classification of colorectal
adenocarcinoma. Biologic behavior correlates with K-ras-2 mutation
type. Cancer 1993, 71:3827–3838.
4. Guerrero S, et al: Codon 12 and codon 13 mutations at the K-ras gene
induce different soft tissue sarcoma types in nude mice. FASEB J 2002,
16:1642–1644.
5. Fasano O, et al: Analysis of the transforming potential of the human H-ras
gene by random mutagenesis. Proc Natl Acad Sci USA 1984, 81:4008–4012.
6. Sloan SR, Newcomb EW, Pellicer A: Neutron radiation can activate K-ras
via a point mutation in codon 146 and induces a different spectrum of
ras mutations than does gamma radiation. Mol Cell Biol 1990, 10:405–408.
7. Zhou W: Hif1alpha induced switch from bivalent to exclusively glycolitic
metabolism during ESC-to-EpiSC/hESC transition. EMBO 2012, 31:13.
8. Hanahan D, Folkman J: Patterns and emerging mechanisms of the
angiogenic switch during tumorigenesis. Cell 1996, 86:353–364.
9. Carmeliet P: Molecular mechanisms and clinical applications of
angiogenesis. Nature 2011, 473.
10. Rak J, Klement G: Impact of oncogenes and tumor suppressor genes on
deregulation of hemostasis and angiogenesis in cancer. Cancer Metastasis
Rev 2000, 19:93–96.
11. Kalas W, Klement P, Rak J: Downregulation of the angiogenesis inhibitor
thrombospondin 1 in fibroblasts exposed to platelets and their related
phospholipids. Biochem Biophys Res Commun 2005, 334(2):549–554.
Page 10 of 11
12. Kranenburg O, Gebbink MF, Voest EE: Stimulation of angiogenesis by Ras
proteins. Biochim Biophys Acta 2004, 1654:23–37.
13. Larcher F, et al: Modulation of the angiogenesis response through Ha-ras
control, placenta growth factor, and angiopoietin expression in mouse
skin carcinogenesis. Mol Carcinog 2003, 37(2):83–90.
14. Audero E, et al: Adaptor ShcA protein binds tyrosine kinase Tie2 receptor
and regulates migration and sprouting but not survival of endothelial
cells. J Biol Chem 2004, 279:13224–13233.
15. Guerrero S, et al: K-ras codon 12 mutation induces higher level of
resistance to apoptosis and predisposition to anchorage-independent
growth than codon 13 mutation or proto-oncogene overexpression.
Cancer Res 2000, 60:6750–6756.
16. Jensen MM, et al: Tumor volume in subcutaneous mouse xenografts
measured by microCT is more accurate and reproducible than
determined by 18 F-FDG-microPET or external caliper. BMC Med Imaging
2008, 8:16.
17. Pfaffl MW: A new mathematical model for relative quantification in realtime RT-PCR. Nucleic Acids Res 2001, 29(9):e45.
18. Pages G, Pouyssegur J: Transcriptional regulation of the Vascular
Endothelial Growth Factor gene-a concert of activating factors.
Cardiovasc Res 2005, 65:564–573.
19. Grosfeld A, et al: Hypoxia-inducible factor 1 transactivates the human
leptin gene promoter. J Biol Chem 2002, 277(45):42953–42957.
20. McKenzie FR, Pouyssegur J: cAMP-mediated growth inhibition in
fibroblasts is not mediated via mitogen-activated protein (MAP) kinase
(ERK) inhibition. cAMP-dependent protein kinase induces a temporal
shift in growth factor-stimulated MAP kinases. J Biol Chem 1996,
271(23):13476–13483.
21. Berra E, et al: HIF prolyl-hydroxylase 2 is the key oxygen sensor setting
low steady-state levels of HIF-1alpha in normoxia. EMBO J 2003,
22(16):4082–4090.
22. Weidner N, et al: Tumor angiogenesis and metastasis–correlation in
invasive breast carcinoma. N Engl J Med 1991, 324(1):1–8.
23. Li J, et al: Down-regulation of N-acetylglucosaminyltransferase-V induces
ER stress by changing glycosylation and function of GLUT1. Arch Biochem
Biophys 2007, 463(1):102–109.
24. Tan NY, Khachigian LM: Sp1 phosphorylation and its regulation of gene
transcription. Mol Cell Biol 2009, 29(10):2483–2488.
25. Vizan P, et al: K-ras codon-specific mutations produce distinctive
metabolic phenotypes in human fibroblasts. Cancer Res 2005,
65:5512–5515.
26. Zhang X, Gaspard JP, Chung DC: Regulation of vascular endothelial
growth factor by the Wnt and K-ras pathways in colonic neoplasia.
Cancer Res 2001, 61(16):6050–6054.
27. Bradbury D, et al: Vascular endothelial growth factor induction by
prostaglandin E2 in human airway smooth muscle cells is mediated by E
prostanoid EP2/EP4 receptors and SP-1 transcription factor binding sites.
J Biol Chem 2005, 280(34):29993–30000.
28. Curry JM, et al: M-CSF signals through the MAPK/ERK pathway via Sp1 to
induce VEGF production and induces angiogenesis in vivo. PLoS One
2008, 3(10):e3405.
29. Song Y, et al: Sp-1 and c-Myc mediate lysophosphatidic acid-induced
expression of vascular endothelial growth factor in ovarian cancer cells
via a hypoxia-inducible factor-1-independent mechanism. Clin Cancer Res
2009, 15(2):492–501.
30. Pore N, et al: Sp1 is involved in Akt-mediated induction of VEGF
expression through an HIF-1-independent mechanism. Mol Biol Cell 2004,
15(11):4841–4853.
31. Hatzaki A, et al: A modified mutagenic PCR-RFLP method for K-ras codon
12 and 13 mutations detection in NSCLC patients. Mol Cell Probes 2001,
15(5):243–247.
32. Nakatsu MN, et al: VEGF(121) and VEGF(165) regulate blood vessel
diameter through vascular endothelial growth factor receptor 2 in an
in vitro angiogenesis model. Lab Invest 2003, 83:1873–1885.
33. Carmeliet P, Jain RK: Angiogenesis in cancer and other diseases.
Nature 2000, 407:249–257.
34. Grunstein J, et al: Tumor-derived expression of vascular endothelial
growth factor is a critical factor in tumor expansion and vascular
function. Cancer Res 1999, 59:1592–1598.
35. Benjamin LE, Hemo I, Keshet E: A plasticity window for blood vessel
remodelling is defined by pericyte coverage of the preformed
Figueras et al. BMC Cancer 2013, 13:125
/>
36.
37.
38.
39.
40.
Page 11 of 11
endothelial network and is regulated by PDGF-B and VEGF.
Development 1998, 125:1591–1598.
Greenberg JI, et al: A role for VEGF as a negative regulator of pericyte
function and vessel maturation. Nature 2008, 456(7223):809–813.
Paez-Ribes M, et al: Antiangiogenic therapy elicits malignant progression
of tumors to increased local invasion and distant metastasis. Cancer Cell
2009, 15(3):220–231.
De Roock W, et al: Effects of KRAS, BRAF, NRAS, and PIK3CA mutations on
the efficacy of cetuximab plus chemotherapy in chemotherapyrefractory metastatic colorectal cancer: a retrospective consortium
analysis. Lancet Oncol 2010, 11(8):753–762.
Diaz-Rubio E, et al: Role of Kras status in patients with metastatic
colorectal cancer receiving first-line chemotherapy plus bevacizumab: a
TTD group cooperative study. PLoS One 2012, 7(10):e47345.
Modest DP, et al: Cetuximab-based or bevacizumab-based first-line
treatment in patients with KRAS p.G13D-mutated metastatic colorectal
cancer: a pooled analysis. Anticancer Drugs 2012, 23(6):666–673.
doi:10.1186/1471-2407-13-125
Cite this article as: Figueras et al.: The impact of KRAS mutations on
VEGF-A production and tumour vascular network. BMC Cancer 2013
13:125.
Submit your next manuscript to BioMed Central
and take full advantage of:
• Convenient online submission
• Thorough peer review
• No space constraints or color figure charges
• Immediate publication on acceptance
• Inclusion in PubMed, CAS, Scopus and Google Scholar
• Research which is freely available for redistribution
Submit your manuscript at
www.biomedcentral.com/submit