Spatial morphological and molecular differences within solid tumors may contribute to the failure of vascular disruptive agent treatments
Bạn đang xem bản rút gọn của tài liệu. Xem và tải ngay bản đầy đủ của tài liệu tại đây (4.6 MB, 13 trang )
Nguyen et al. BMC Cancer 2012, 12:522
/>
RESEARCH ARTICLE
Open Access
Spatial morphological and molecular differences
within solid tumors may contribute to the failure
of vascular disruptive agent treatments
Linh Nguyen†, Theodora Fifis*†, Caterina Malcontenti-Wilson, Lie Sam Chan, Patricia Luiza Nunes Costa,
Mehrdad Nikfarjam, Vijayaragavan Muralidharan and Christopher Christophi
Abstract
Background: Treatment of solid tumors with vascular disrupting agent OXi4503 results in over 90% tumor
destruction. However, a thin rim of viable cells persists in the tumor periphery following treatment, contributing to
subsequent recurrence. This study investigates inherent differences in the microenvironment of the tumor
periphery that contribute to treatment resistance.
Methods: Using a murine colorectal liver metastases model, spatial morphological and molecular differences within
the periphery and the center of the tumor that may account for differences in resistance to OXi4503 treatment
were investigated. H&E staining and immunostaining were used to examine vessel maturity and stability, hypoxia
and HIF1α levels, accumulation of immune cells, expression of proangiogenic factors/receptors (VEGF, TGF-β, b-FGF,
and AT1R) and expression of EMT markers (ZEB1, vimentin, E-cadherin and β-catenin) in the periphery and center of
established tumors. The effects of OXi4503 on tumor vessels and cell kinetics were also investigated.
Results: Significant differences were found between tumor periphery and central regions, including association of
the periphery with mature vessels, higher accumulation of immune cells, increased growth factor expression,
minimal levels of hypoxia and increased evidence of EMT. OXi4503 treatment resulted in collapse of vessels in the
tumor center; however vasculature in the periphery remained patent. Similarly, tumor apoptosis and proliferation
were differentially modulated between centre and periphery after treatment.
Conclusions: The molecular and morphological differences between tumor periphery and center may account for
the observed differential resistance to OXi4503 treatment and could provide targets for drug development to
totally eliminate metastases.
Keywords: Vascular disruptive agent, OXi4503, Tumor periphery, Hypoxia, Growth factor, Infiltrating cells, EMT
Background
Solid tumors require a well established vasculature to
grow. As the tumor grows its vasculature undergoes constant remodeling [1] which makes the tumor microvasculature unstable. This characteristic makes the tumor
microvasculature more sensitive to destabilizing drugs
compared to normal host microvasculature. Exploiting
these differences to target established tumor microvasculature is a novel concept resulting in the development of
* Correspondence:
†
Equal contributors
Department of Surgery, University of Melbourne, Austin Health, Heidelberg,
Victoria 3084, Australia
vascular disruptive agents (VDAs) [2]. Treatment with
VDAs is characterized by rapid and extensive destruction
of tumor limited only by the persistence of a viable rim of
tumor in the periphery which subsequently leads to recurrence [3]. The Combretastatins are a family of tubulin
binding vascular disrupting agents that specifically target
the vascular network within a solid tumor. Despite extensive tumor destruction, complete tumor eradication is not
achieved [4]. OXi4503, a derivative of Combretastatin
CA4P, is a second generation VDA that is more potent
than CA4P, killing more than 90% of tumor [5]. It has
been shown to be effective in a wide variety of tumor
models and is currently undergoing clinical trials
© 2012 Nguyen et al.; licensee BioMed Central Ltd. This is an Open Access article distributed under the terms of the Creative
Commons Attribution License ( which permits unrestricted use, distribution, and
reproduction in any medium, provided the original work is properly cited.
Nguyen et al. BMC Cancer 2012, 12:522
/>
(ClinicalTrials.gov Identifier: NCT01085656). Despite its
enhanced potency, treatment with OXi4503 also leaves
the characteristic rim of viable tumor cells albeit smaller
in size than that seen in tumors treated with CA4P [6,7].
As tumor cells survive only in the periphery, we
hypothesize that there are intrinsic differences between
the periphery and the bulk of the tumor that confer resistance to treatment. A number of studies reported
increased expression of growth factors in the periphery
[8,9]. In a previous study [10] we have shown that
macrophages and T-cells infiltrate the tumor and preferentially accumulate in the periphery. Other studies indicate that tumor associated immune cells secrete
cytokines and growth factors that promote tumor
growth [11-14].
The present study examines inherent differences between the periphery and the bulk of the tumor in a murine
model of colorectal liver metastases including vessel
morphology, immune cell infiltration, expression of proangiogenic factors and markers of Epithelial to Mesenchymal Transition (EMT). Morphological and molecular
changes occurring in the tumor vasculature and in tumor
cell kinetics following administration of OXi4503 are also
investigated.
Page 2 of 13
represented in more than one section. Random sections
are selected to represent the entire liver and used for paraffin embedding and analysis. Each section could contain
from one to several individual tumors (Additional file 1:
Figure S1). Metastases seeded in close proximity often coalesce into a continuous tumor.
Treatment protocol
Treatment was administered sixteen days after induction
of liver metastases when tumors are well established.
OXi4503, kindly donated by OXiGENE (OXiGENEW
Inc. South San Francisco, CA), was freshly prepared by
dissolving in 0.9% sterile saline (NaCl) and protected
from light. A single maximum tolerated dose of
OXi4503, determined previously to be 100 mg/kg [16],
was administered via intraperitoneal injection. Control
groups were administered an equivalent volume of sterile saline. Tissues were collected at one hour, twenty
four hours and five days following OXi4503 treatment.
Definition of tumor periphery
Tumor periphery in our studies consisted of the area covering the tumor-host interface and extending one hundred
microns towards the tumor center. All the remaining
tumor area was considered part of the tumor center.
Methods
Animals
Vascular morphology
Six to eight week old male CBA mice (Laboratory Animal
services, University of Adelaide, South Australia) were
used in all experiments. Mice were maintained in standard
cages with access to irradiated food and water ad libitum,
and exposed to a twelve hour light/dark cycle. All procedures were implemented in accordance with the guidelines of the Austin Health Animal Ethics Committee.
Vessel morphology was examined microscopically in
stained tumor sections. Immature vessels and/or vessels
undergoing angiogenesis were detected by CD34 staining
[17]. All CD34 positive vessels/mm2 in each tumor section were counted. Vessel stability and maturity were
also assessed by pericyte coverage and angiopoetin 1
(Ang1) association [18]. The presence of pericytes was
visualised by αSMA immunostaining and enumerated by
counting of αSMA positive tumor vessels in serial sections stained for αSMA or CD34. Only vessels that
stained for both markers were included in the enumeration. Ang1 association was determined by double
immunostaining for Ang1 and CD34.
Experimental model of colorectal cancer liver metastases
(CRCLM)
The primary cancer cell line MoCR was derived from a
dimethyl hydrazine (DMH)-induced primary colon carcinoma in the CBA mouse and maintained in vivo by
serial passage in the flanks of CBA mice [15]. For passage and experimentation, subcutaneous tumors were
teased, passed through a filter, treated with EDTA and
washed in PBS to make a single cell suspension. Liver
metastases were induced by intrasplenic injection of
5x10⁴ tumor cells prior to splenectomy as reported previously [15]. In this model, liver metastases are fully
established by 21 days following tumor induction. The
tumor morphology and growth patterns in this model
have been described previously [6,15,16]. Metastases of
varying sizes are found throughout the liver. The metastasis pattern is very similar and reproducible within a
group of mice. The whole liver is sliced in sections of 2
mm thickness. Cross-sections of the larger tumors are
Detection of tumor hypoxia
Pimonidazole was used as a marker of tumor hypoxia.
Pimonidazole hydrochloride was dissolved into 0.9%
NaCl and administered intravenously to tumor-bearing
mice in doses of 30 mg/kg. The livers were removed one
hour after pimonidazole administration and fixed in 10%
formalin in 0.1M phosphate buffer, pH 7.2. Hypoxic
tumor regions were detected immunohistochemically as
reported previously [19].
Assessment of epithelial to mesenchymal transition (EMT)
The main indicators of EMT are down regulation of the
cell junction protein E-cadherin, nuclear accumulation
Nguyen et al. BMC Cancer 2012, 12:522
/>
of β-catenin another junctional protein, up regulation of
the mesenchymal marker vimentin and up regulation of
transcription inhibitors of epithelial proteins such as
ZEB1 [20,21]. The spatial expression of these markers
was assessed for evidence of EMT.
Histological assessment
Hematoxylin and eosin (H & E) stained sections were
examined histologically and digital images captured using
a Nikon CoolscopeW (Nikon Corporation, Chiyokd-ku,
Tokyo, Japan). A minimum of 50 tumors were assessed
per treatment group.
Immunohistochemistry
Spatial differences in untreated tumors and changes due
to OXi4503 treatment were detected using histological
and immunohistochemical techniques.
Antibodies used for infiltrating immune cells; Rabbit
polyclonal antibodies to human CD3 (A0452, DAKO),
Rat anti-mouse monoclonal antibodies to FOXP3 (145773-80, e-bioscience), and F4/80 a kind gift from Professor Mauro Sandrin Dept. of Surgery, University of
Melbourne. Antibodies used for growth factor detection;
Rabbit polyclonal antibodies to mouse AT1R (sc-1173),
TGF-β (sc7892), b-FGF (Lot no: 24030710) obtained
from Santa Cruz, VEGF (PC315, CalBiochem) and
HIF1α (AB 3883, Chemicon). Antibodies used for vessel
detection; Rat anti-mouse monoclonal antibodies to
CD34 (MCA18256, Serotec), rabbit polyclonal antibodies
to mouse CD31 (ab 28364, Abcam), αSMA (CME 305
AB, Biocare) and Angiopoetin1 (ab 8451–200, Abcam).
Antibodies used for EMT detection; Rabbit polyclonal
antibodies to mouse E-cadherin (sc-7870), Vimentin (sc5568), ZEB1 (sc-25388) and rat anti-mouse monoclonal
antibodies to β-catenin (sc-7199) all obtained from Santa
Cruz. Cell proliferation was detected with rabbit monoclonal antibodies to Ki67 (rm-9106-s1 thermo scientific)
and cell apoptosis with rabbit polyclonal antibodies to
Active Caspase-3 (AF835, R&D systems). Additional file
2: Table S1 presents a list of antibody concentrations
and assay conditions used.
Formalin fixed paraffin tissue sections (4 μm) were
used with an indirect peroxidase labeling technique (Envision Plus, DAKO, Australia). Following deparaffinization and rehydration, endogenous peroxidase activity
was blocked with 3% H2O2 and non-specific binding
inhibited with 10% normal goat serum (01–6201 Zymed
Laboratories, USA) after which epitope retrieval was
conducted (Additional file 2: Table S1). Sections were
incubated with primary antibodies overnight at 4°C.
Negative controls were incubated with the respective
non immune antibody isotypes or non-immunized rabbit
IgG (Santa Cruz, sc-2027) at the same concentration as
the primary antibody. Sections treated with the rat
Page 3 of 13
antibodies were subsequently treated with a rabbit antirat IgG linker antibody before treatment with a polymer
based detection kit containing goat anti-rabbit immunoglobulins (IgG) linked to horseradish peroxidase (HRP)
(Envision Plus, Dako, Australia). Each incubation step
was followed by two five minute washes with PBS +
0.05% Tween 20. Positive staining was visualized using
diaminobenzidine (DAB) as a substrate. For double
immunostaining Vulcan fast red (Applied Medical
FR805H) was used to stain CD34. Slides were counterstained with Mayer’s haematoxylin.
A minimum of five mice were used per group and between 75 and 120 tumors were assessed for each timepoint/treatment group. Images of stained tumors were
captured using a digital light microscope (Nikon CoolscopeW, Nikon Corporation, Japan) at between 10x and
400x magnification. The images of tumor fields were
captured to be representative of the entire tumor, using
a raster pattern which allowed for fields captured to be
random and not overlap. Between 10 and 30 fields per
tumor (periphery and center) were assessed. The images
were analyzed using Image-Pro plus (Version 5, Media
Cybernetics, Perth Australia). The number of CD34 positively stained vessels per tumor area (mm2) to were
counted provide a microvascular density index. Ki67, active
caspase3, CD3, FOXP3 and F4/80 were assessed as the
number of CD34 positive cells per area of tumor (20x magnification). Positively stained cells per image were marked
and quantification was performed using Image-Pro plus
(Version 5, Media Cybernetics, Perth Australia). Differences in hypoxia and the antigens (AT1R, VEGF, b-FGF,
TGF-β, HIF1α, E-cadherin, Vimentin, β-catenin and ZEB1)
were assessed by microscopic observation and representative images are presented.
Quantification of AT1R, VEGF and TGF-β was performed using a semi-quantitative analysis. Areas of interest were identified using a light microscope (Olympus
BH2, Japan) at a magnification of 125x. The entire margin
of tumor host interface and tumor center were examined.
Scoring criteria was used to estimate the amount and intensity of staining seen in each sample. The grading system used was: as: 0: no staining 1: faint staining; 2: small
amount or weak staining; 3: moderate staining; 4: abundant or strong staining; 5: Abundant or very strong staining. Means for each group were determined using the
individual average scores from each animal in the group.
For all counting and scoring researchers were blinded in
regard to the experimental group.
Statistical analysis
Quantified data is represented as the mean ± standard
error of the mean. Statistical analysis was conducted using
SPSS (Statistical Package for the Social Sciences,TM version 10, Chicago, Illinois, USA) with normality testing and
Nguyen et al. BMC Cancer 2012, 12:522
/>
use of both parametric and non parametric analytical tests
as appropriate. All statistical tests were two-sided and a P
value of 0.05 or less was considered statistically significant.
Results
Spatial differences in tumor vessel density and vessel
morphology
CD34 and CD31 are two endothelial cell markers often
used in determining tumor vascular density. While these
two markers roughly stain the same number of tumor vessels (Additional file 3: Figure S2) neither marker stains all
the tumor vessels. In our experience CD34 normally stains
tumor vessels and host vessels undergoing neovascularisation as seen in liver regeneration (unpublished result) but
stains mature vessels only minimally. CD31 shows more
Page 4 of 13
cross-reactivity and also stains liver sinusoids (Additional
file 3: Figure S2), therefore in this study we used CD34.
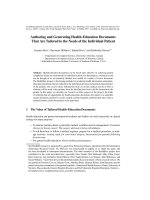
Staining and quantification of CD34 positive staining vessels (Figure 1A and B) demonstrate significantly stronger
staining (Figure 1A inset 1 arrows) and greater density in
the central regions of tumor (Figure 1B, P<0.001). Vessels
in the periphery either did not stain or only partially
stained with CD34 (Figure 1A inset 2 arrows). Interestingly CD34 negative or faintly stained host vessels at the
tumor-host interface were seen to be co-opted by tumor
cells (Figure 1A inset 3 arrows). Maturity of tumor vessels
was assessed by αSMA staining of pericytes associated
with the vessels. In addition to pericytes αSMA also stains
myofibroblasts and in this model there is significant accumulation of myofibroblasts within the tumor stroma, especially in the periphery (Additional file 4: Figure S3). To
determine pericyte coverage we used serial sections
stained for CD34 /αSMA and only vessels that stained for
both markers regardless of the strength of CD34 staining
were included in the enumeration. Tumor periphery
showed at least 2.5 times greater pericyte coverage than
vessels in the center of the tumor, indicating that the
vasculature is more stable and mature in the periphery
(Additional file 4: Figure S3 and Figure 1C, P<0.001). Due
to the large number of αSMA staining myofibroblasts the
difference in vessel pericyte coverage is only an estimate
and may be underestimated since not all vessels in the
periphery stain for CD34. Angiopoetin 1 another vessel
stability marker was also preferentially associated with vessels in the tumor periphery (Additional file 4: Figure S3)
further supporting our finding that the periphery of
tumors is associated with relatively mature stable vessels.
Spatial differences in the accumulation of immune cells
Figure 1 Differences in blood vessel morphology between tumor
periphery and center. A: Formalin fixed liver sections with CRC liver
metastases were stained with antibodies to CD34 (staining of
endothelial cells on immature vessels). Scale bar=200μm. Inset 1
depicts tumor vessels (arrows) in the tumor center staining strongly for
the CD34 endothelial marker. Inset 2 depicts tumor vessels (arrows) in
the tumor periphery staining weakly for the CD34. Inset 3 depicts host
vessels (arrows) being co-opted by the tumor displaying weak or no
CD34 staining. B: Quantification of CD34 positive vessels in tumor
center and tumor periphery expressed as CD34 positive vessels /mm2.
Black bars = tumor periphery, Grey bars = tumor center. Significantly
more CD34 positive vessels are seen in the tumor center (*P<0.001).
Quantification of αSMA pericyte association with tumor vessels
revealed a significantly greater number in the tumor periphery
compared to the tumor center (* P<0.0001, Black bars = tumor
periphery, Grey bars = tumor center. Data is expressed as mean value±
SEM, with n≥5 for each group. Data was not normally distributed and
non-parametric analysis was performed and statistical significance
determined using Kruskal Wallis and Mann-Whitney U test.
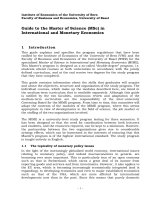
In a previous study we reported the accumulation of immune cells within the tumor [10]. In the present study
we demonstrate that accumulation of CD3 T cells, regulatory T cells and macrophages is significantly higher in
the periphery than in central regions of the tumor
(Figure 2A and 2B, P values 0.0001, 0.0001 and 0.027 respectively). Of particular interest was that regulatory T
cells represent a significant fraction (32.4% in the periphery and 49.5% in the center) of the T cell population
indicating an immunosuppressive function.
The periphery of the tumor is normoxic relative to the
center
Hypoxia in tumors has been implicated in the development of resistance to therapy. In this study the distribution of hypoxic regions within the tumor were variable
and occurred throughout the center. Importantly, tumor
cells in the periphery were minimally hypoxic. Very few
cells in the periphery were stained with pimonidazole
(Figure 3A first panel and inset 2) except when tumors
Nguyen et al. BMC Cancer 2012, 12:522
/>
Page 5 of 13
Figure 2 Preferential accumulation of immune cells in the tumor periphery. Formalin fixed liver sections with CRC liver metastases were
stained with anti-CD3, anti-FOXP3 and F4/80 monoclonal antibodies to detect the presence of T cells, regulatory T cells and macrophages
respectively. Low magnification scale bar=250μm, high magnification scale bar=50μm. Quantification of each cell type revealed significant
differences between the tumor center and the periphery. Data is expressed as mean value of positive cells/ mm2±SEM with n≥5 for each group.
(*P=0.0001 for T cells and regulatory T cells and #P=0.021 for macrophages).
were growing on the liver surface. Peripheral tumor
regions that did not lay adjacent to liver parenchyma or
host vessels displayed hypoxia, as seen in Figure 3A (first
panel and inset 1). More centrally located tumor cells,
particularly those not in close proximity to major vessels, displayed high levels of hypoxia (Figure 3A). These
results support our observations that the periphery of
the tumor is supplied with mature and stable vessels.
HIF1α expression was variable as seen with hypoxia and
displayed a similar distribution pattern, indicating that it
is stabilized by hypoxia, however expression is also seen
in the periphery albeit at lower levels (Figure 3B).
The tumor periphery is associated with upregulated
growth factor expression
Hypoxia and HIF1α are known to stimulate upregulation of pro-angiogenic growth factors [22]. Expression of VEGF and the pro-angiogenic receptor AT1R are
markedly up-regulated in the periphery (Figure 3C and
Figure 3D). However, the distribution of VEGF and
AT1R were found to closely mirror the distribution of
infiltrating T cells and macrophages (Figure 2A) rather
than the distribution of hypoxia and HIF1α (Figure 3A
and Figure 3B). This suggests that these factors may be
mainly expressed by or under the influence of the infiltrating immune cells. Similarly b-FGF and TGF-β are
preferentially expressed in the periphery. Additionally
these two factors are also strongly expressed within the
liver parenchyma immediately adjacent to the tumor
host interface (Figure 3E and Figure 3F).
The tumor periphery is associated with increased
mesenchymal marker expression
The bulk of the tumor cells in CRCLM were found to be
strongly positive for E-cadherin and displayed the characteristic cobblestone junctional complex staining (Figure 4A).
However, in the periphery a few tumor cells did not express
E-cadherin and appeared detached from the main tumor
(Figure 4A; inset arrows indicate E-cadherin negative tumor
cells). Immunostaining showed that most tumor cells
displayed a β-catenin staining pattern similar to that of Ecadherin (Figure 4B) being present mainly in the cell junctions. In the periphery however the occasional tumor cell
was positive for nuclear β-catenin (Figure 4B; inset arrows
point at β-catenin nuclear localization).
Tumors in this study also showed very faint cytoplasmic
vimentin staining in the bulk of the tumor. Vimentin
staining was slightly more intense in the periphery where
the occasional tumor cell also displayed nuclear staining
(Figure 4C and inset, arrows indicate nuclear vimentin).
The majority of tumor cells in our CRCLM tumor
model did not express ZEB1. In contrast, strong ZEB1
Nguyen et al. BMC Cancer 2012, 12:522
/>
Page 6 of 13
Figure 3 Molecular and morphological differences between tumor periphery and center. Formalin fixed liver sections with CRC liver
metastases were stained for hypoxia by staining for pimonidazole using hypoxiprobe and growth factor/receptor expression HIF1a, VEGF, AT1R ,
b-FGF and TGF-β using the respective antibodies. (A) Low magnification scale bar=500μm, inset magnification scale bar=50μm, Tumors in the
periphery show less hypoxia (first row panel 1 and inset 2) unless the tumor periphery lies on the liver surface with no adjacent host tissue (inset
1). (B) HIF1a staining displaying higher staining towards the tumor center in areas associated with high hypoxia. (C) VEGF, (D) AT1R, (E) b-FGF and
(F) TGF-β, all are expressed at higher levels in the tumor periphery. (B-F magnification scale bar=200μm). (G) Quantification of AT1R, VEGF, TGF-β,
demonstrate significantly higher staining in the periphery (p<0. 0001, p<0. 001, and p<0.0001 respectively).
staining was seen to be associated with infiltrating stromal
cells that had a mainly fibroblast appearance and accumulated in the tumor-host interface and along major vessels
(Figure 4D). Some of the positive cells had a round appearance and from their observed location, they may be
mast cells. A few ZEB1 positive tumor cells were also
present mainly in the periphery but some also interspersed
throughout the tumor (Figure 4D arrows in inset pointing
at positive tumor cells). Taken together, these results indicate that a proportion of tumor cells in the periphery in
this tumor adopt mesenchymal morphology.
Treatment with Oxi4503 results in endothelial cell
apoptosis and rapid occlusion of tumor vessels
Having demonstrated several important molecular and
morphological differences between the periphery and
the rest of the tumor, the differential effect of a single
dose of OXi4503 on established CRLCM was then
investigated. We examined microvascular changes in the
tumor center and periphery at one hour, 24 hours and
five days following OXi4503 treatment. Untreated
tumors displayed open functional vessels (Figure 5 control). Within one hour of treatment tumor vessels
Nguyen et al. BMC Cancer 2012, 12:522
/>
Page 7 of 13
Figure 4 Tumor cells in the periphery express mesenchymal markers. Formalin fixed liver sections with CRC liver metastases were stained
with antibodies for EMT markers; E-cadherin (A), β-catenin (B), vimentin (C) and ZEB1 (D). Magnification scale bar=200μm. Arrows in A magnified
inset indicates detached tumor cells not expressing E-cadherin. Arrows in B magnified inset indicates tumor cells displaying nuclear localization of
β-catenin. Magnified inset in C indicates increased vimentin staining in the periphery. Magnified inset and arrows in D indicate tumor cells
displaying nuclear localization of ZEB1.
became congested (Figure 5 1hr OXi4503). The endothelial cells lining the vessels appeared rounded and
detached from the vessel wall (Figure 5, 1hr OXi4503
arrows indicate rounding endothelial cells). Using
double staining for active caspase-3 and CD34, we
found that endothelial cells not only changed shape but
also were apoptotic (Figure 5, 1hr OXi4503). At 24
hours, all the central tumor vessels had occluded and
the majority no longer stained with CD34 indicating
endothelial cell death (Figure 5, 24hrs OXi4503, center
and Additional file 5: Figure S4). However, a number of
patent vessels that did not stain or only partially stained
with CD34 were seen in the periphery (Figure 5, 24hrs
OXi4503, periphery and Additional file 5: Figure S4). By
day five, as seen in our previous studies [23] the tumor
had vigorously re-grown towards the necrotic center
and vessels had re-established with increased vessel
density compared with control tumors (Figure 5, 5days
OXi4503, center).
Quantification of vascular endothelial cell apoptosis by
active caspase-3 staining demonstrated that OXi4503
induced significantly more vascular endothelial cell apoptosis in the tumor center at one and 24 hours after treatment compared to the periphery (Figure 5B, P <0.001 for
both timepoints). This differential in apoptosis of vascular
endothelial cells resulted in a significant decrease in vascular density in the tumor center (P<0.0001), but no
significant change in the periphery (P=0.173) at 24 hours
after treatment (Figure 5C).
Tumor vessel density in the treated tumor five days
after treatment was found to be significantly higher
compared to the untreated control both in the bulk of
the tumor and in the periphery. Vascular density is 1.6
times higher in the periphery and 1.9 times higher in the
center of OXi4503 treated tumors compared to controls
(Figure 5C, P<0.001 for both). These results demonstrate
inherent differential resistance to OXi4503 in tumor vasculature between the periphery and the bulk of the
tumor. Furthermore after the initial vessel damage revascularization resumed at increased rates indicating that
treatment induced signals for angiogenesis.
Tumor cells in the periphery are resistant to apoptosis
after OXi4503 treatment
Following OXi4503 treatment (Figure 6A) a thin rim of
viable cells was seen in H&E stained tumor sections at
the tumor host interface at both one hour and 24 hour
timepoints. No appreciable change in the number of viable tumor cells could be seen between these two timepoints. In control tumors, apoptosis occurs within some
central regions but very seldom within the periphery
(Figure 6B control). Within one hour following treatment, significant apoptosis occurred in the tumor center
leading to large necrotic areas (Figure 6B, 1hr OXi4503).
Nguyen et al. BMC Cancer 2012, 12:522
/>
Page 8 of 13
Figure 5 Changes in endothelial cells and vessel morphology following OXi4503 treatment. Mice were treated with a single IP dose of
OXi4503 (100mg/kg) at 16 days after tumor induction. Tissues were collected at one hour, 24 hours and five days after treatment. Formalin fixed
liver sections were stained with anti-CD34 antibody to visualize tumor vessels. (A), Control tumor, arrow indicates a patent tumor vessel; 1hr
OXi4503, arrows indicate endothelial cells rounding up and detaching from the vessel basement membrane; 1hr OXi4503, EC apoptosis, the
section was doubly immunostained for CD34 and active caspase-3 (apoptosis marker), to visualise endothelial cells undergoing apoptosis (arrows);
24hrs OXi4503 center, arrow points at a totally occluded tumor vessel; 24hrs OXi4503 periphery, arrow indicates patent tumor vessel; 5 days
OXi4503 , center, demonstrating regenerating tumor vessels surrounded by proliferating tumor cells; Single staining magnification scale
bar=50μm, double staining magnification scale bar=25μm. (B), Enumeration of vascular endothelial cell apoptosis show significant differences
between the tumor center and periphery at one and 24 hours after treatment (*P <0.001); (C), Quantification of tumor vascular changes following
OXi4503 treatment. Vascular density decreased significantly in the tumor center (**P<0.0001), but not the periphery (P=0.173) at 24 hours after
treatment. Tumor revascularization at day five is significantly higher compared to the untreated control both at tumor center and the periphery
(*P=0.001). Results are mean values ± SEM, (n≥5). Black bars = tumor periphery, Grey bars = tumor center.
This pattern of injury continued at 24 hours (Figure 6B
24 hrs OXi4503). Although apoptosis in the periphery
was significantly increased at one and 24 hours after
OXi4503 compared to controls (Figure 6B graph,
P<0.0001 for both timepoints) there was significantly
lower apoptosis in the treated periphery compared to
center of the treated tumor (Figure 6B graph, P<0.0001
for both timepoints). Furthermore, significantly more
apoptotic cells are seen in the periphery at 24 hours
compared to one hour after treatment, suggesting that
inhibition of apoptotic pathways immediately following
treatment may be part of the resistance mechanism. By
five days after treatment apoptosis had virtually ceased
and new tumor growth is seen to extend towards the
center into previously apoptotic areas (Figure 6A and
Figure 6B, 5 days OXi4503).
both the center and the periphery (Figure 6C control).
Cell proliferation was drastically reduced both at the
center and the periphery at one and 24 hours after treatment (Figure 6C, 1 hr and 24 hrs, P<0.001 in all cases
compared to untreated control). Comparison of tumor
proliferation between periphery and center in treated
tumors showed that significantly higher cell proliferation
was seen in the periphery at both timepoints (Figure 6C,
1 hr and 24 hrs. P<0.0001 for both timepoints) These
results show that a significant proportion of tumor
cells in the periphery stop proliferating in response to
VDA treatment, reaching a minimum at 24 hours after
treatment. Reduction in proliferation was seen to be only
a transient response however, as by day 5 these cells
have recovered and resumed vigorous proliferation
(Figure 6A, 5days OXi4503 and 6C, 5days OXi4503).
Tumor cells in the periphery transiently reduce
proliferation after OXi4503 treatment
Discussion
Tumor microvasculature unlike that of the host is particularly sensitive to vascular disruptive agents such as
OXi4503 resulting in rapid vessel thrombosis and
Quantification of tumor cell proliferation showed that
control tumors exhibited high rates of proliferation in
Nguyen et al. BMC Cancer 2012, 12:522
/>
Page 9 of 13
Figure 6 Changes in tumor kinetics following OXi4503 treatment. Mice were treated with a single IP dose of OXi4503 (100mg/kg) at 16 days
after tumor induction. Tissues were collected at one hour, 24 hours and five days following OXi4503 treatment. (A). H&E stained sections at
indicated times after OXi4503 treatment. Magnification scale bar=200μm. Tumor cells at the live rim at one and 24hrs are seen in the enclosed
lined areas indicated by arrows. NA= necrotic/apoptotic area, T= tumor, L=liver. (B) Tumor cell apoptosis at indicated times after treatment
detected by active caspase-3 staining. Low magnification scale bar=250μm, inset magnification scale bar=50μm. Graph showing quantification of
apoptotic tumor cells. Results are mean values ± SEM, (n≥5). Black bars = tumor periphery, Grey bars = tumor center. Apoptosis in the treated
tumor periphery was significantly higher than in the periphery of control tumors at one and 24 hours (*P <0.001) but significantly lower than the
center of the treated tumors (#P<0.0001). (C) Proliferation changes in tumors at indicated times after treatment detected by Ki-67 staining. Low
magnification scale bar=250μm, inset magnification scale bar=50μm. Graph showing quantification of Ki-67 positive tumor cells. Results are mean
values ± SEM, (n≥5). Black bars = tumor periphery, Grey bars = tumor center. Proliferation in the periphery was significantly reduced at one and
24 hours (*P <0.001) following treatment compared to controls. Significantly higher number of cells proliferate in the periphery of treated tumors
compared to the center (#P<0.0001).
significant tumor cell death. A single dose of OXi4503 in
mice at the MTD produces more than 90% necrosis of the
total tumor mass. Characteristically complete tumor eradication is not achieved as a thin rim of viable tumor in the
periphery invariably gives rise to regrowth [6,7,16].
The first part of this study demonstrates several inherent differences between the tumor center and periphery
that may account for the differential resistance to VDA
treatments.
Significantly more tumor vessels stained positive for
CD34 in the center of the tumor compared to the periphery. Tumor vessels in the periphery display greater
pericyte coverage and angiopoetin 1 association than
vessels in the tumor center. In our experience CD34
Nguyen et al. BMC Cancer 2012, 12:522
/>
only stains tumor vessels and vessels undergoing
neoangiogenesis as seen in liver regeneration (unpublished data). Our results indicate an inverse relationship between CD34 and αSMA staining. The presence
of αSMA expressing myofibroblasts in our tumor
model may have resulted in an underestimation of the
difference in vessel maturity between tumor center and
periphery. The lower expression of CD34, greater presence of pericytes and angiopoietin 1 association in the
periphery suggests significantly greater maturation of
the microvasculature in that region [18]. These findings suggest vessels in the center of the tumor are
under constant remodeling while periphery is supplied
by more mature and stable vessels. Other differences
between the center and the periphery also include
lower levels of hypoxia in the periphery and significantly higher expression of proangiogenic factors
and receptors (VEGF, TGF-β, b-FGF and AT1R). The
relatively stable mature vessels in the periphery and
close proximity to normal host vessels are likely the
reason for minimal hypoxia However, in contrast to
current opinion increased proangiogenic factor expression, with the exception of HIF1α, does not overlap
with regions of increased hypoxia in our study [22].
Instead we observed a close overlap of increased
proangiogenic factor expression and infiltrating immune cells (macrophages and T-cells). Other studies
have also reported accumulation of infiltrating cells including macrophages and T-cells in the periphery of
tumors expressing growth factors and cytokines that
are proangiogenic and cytoprotective to tumor [11-14].
This phenomenon has been noted in both surgically
removed human tumors and in experimental tumor
models including CRC. Pro-angiogenic growth factors
such as VEGF in addition to their role in neovascular
formation are also directly cytoprotective to cells
expressing their receptors including endothelial and
tumor cells [24,25]. In addition to the growth factors
and cytokines we investigated in this study, there are
several other studies reporting additional pro-tumor
cytokines, enzymes and growth factors being up regulated in the periphery of the tumor [26-31]. The tumor
cells at the host interface are morphologically different
and are reported to have undergone EMT, perhaps as
a result of the higher growth factor influence, conferring on them characteristics such as increased invasive
ability and drug resistance [20,21,32-34]. In our study
mesenchymal markers ZEB1 and vimentin were preferentially expressed in the tumor periphery, while the
epithelial markers E-cadherin and β-catenin were
reduced from cell junctions of some cells in the periphery, suggesting that these cells have undergone
EMT. Our findings in the first part of this study therefore demonstrate that the tumor microenvironment in
Page 10 of 13
the periphery is significantly different to that of the
rest of the tumor and may account for the differential
response to OXi4503 treatment.
The second part of our study investigated the effect of
OXi4503 treatment on tumor microvasculature and
tumor cell kinetics. We demonstrated that vessels in the
periphery are resistant to OXi4503 as they remain patent
following treatment. This resistance correlates with the
increased vessel maturity and stability in the periphery
and spatially overlaps with the observed immune cell accumulation and increased growth factor expression seen
in control tumors. Initially it was assumed that tumor
cells in the periphery survive VDA treatment due to
their close proximity to host vessels [2,35] but recent
studies demonstrated retained perfusion within the viable rim and patent vessels in the periphery as also seen
in our study [3,7,36,37]. However, to our knowledge this
study is the first to demonstrate and correlate the maturity of the microvasculature in the periphery to its ability
to resist the effects of VDAs. A clinical study by Gaya
et al. [38] investigating the effect OXi4503 treatment on
a variety of different tumors reported significant increase
in vessel permeability correlated with high expression of
angiopoetin 2, a marker of vessel instability [18]. While
that work involved observations on whole tumor, the result supports our finding that vessel stability correlates
with VDA resistance. Different types of tumor differ in
the degree of vascularization, in their vessel morphology
and maturity. This variation likely influences the effectiveness of OXi4503 treatment. Wankhede et al. [37]
showed a mouse mammary carcinoma (4T1) and a
human renal cell carcinoma (Caki-1) xenograft were differentially resistant to OXi4503 treatment when grown
in mouse dorsal window chambers. They speculated differences in microenvironment may account for the observation. While the tumor periphery does not fully
succumb to the effects of VDA treatments, our study
and others have demonstrated that some vessels in the
periphery are affected [36,37]. Other studies also
reported some decrease in perfusion within the viable
rim and indications of increased hypoxia [7,36,37]. Hypoxia is known to inhibit proliferation and indeed our
results show significantly reduced proliferation in the
periphery after treatment. Reduced proliferation was also
reported following VDA treatments even when apoptosis
was not seen [36,37]. We demonstrated that both apoptosis and proliferation of tumor cells are differentially
modulated in the periphery following OXi4503 treatment. Evasion of apoptosis and temporary inhibition in
proliferation are mechanisms adopted in drug resistance
[39]. Cells with mesenchymal characteristics have migratory properties and do not proliferate. It is possible that
the tumor cells within the periphery are protected by
their specific microenvironment, but the stress of the
Nguyen et al. BMC Cancer 2012, 12:522
/>
treatment and the ensuing hypoxia may transiently push
them further in the direction of mesenchymal morphology so they temporarily cease proliferation.
Metastasis is responsible for over 90% of cancer deaths
and in colorectal cancer it accounts for more than 70% of
mortality [40]. The majority of systemic therapies for cancer
including chemotherapy and biologically targeted therapies
appear to achieve partial tumor response with varying
amounts of residual tumor cells surviving treatment. Even
if initial tumor regression is achieved, the surviving tumors
have been shown to develop resistance to chemotherapy
and behave with increased invasiveness. One explanation
for this resistance is the accumulation of mutations in the
constantly proliferating tumor cells enabling the selection
of aggressive resistant clones [41]. While this may be partly
responsible for tumor recurrence, the role of the tumor
microenvironment and the host stromal cells in drug resistance has been overlooked until recently. Resistance has also
been attributed to vascular inefficiency resulting in failure
to deliver adequate drug concentration into the center of
the tumor leading to incomplete destruction [42]. In other
published studies using VDAs including our own work, this
has not been a problem since all surviving tumor is associated with the periphery [3,6,43]. Recently it has been
noted that tumors are heterogeneous and not all cells are
equally capable of giving rise to metastasis [44]. Cytotoxic
drugs kill cells that readily divide and are usually differentiated. A proportion of tumor cells are slow dividing, have a
less differentiated morphology and are capable of giving rise
to metastasis more efficiently. These cells have been termed
cancer stem cells (CSC) and have been shown to express
some progenitor stem cell characteristics and are resistant
to drugs [45]. CSCs are reported to reside in perivascular
niches [46] and most commonly at the tumor host interface
[47,48]. In more recent studies it has been demonstrated
that tumor cells in culture acquire cancer stem cell characteristics when treated with agents that promote EMT [49].
Other studies have shown that in vivo drug treatment of
tumors leads to increased frequency of mesenchymal and
stem cell phenotypes in the recurrent tumor [34,50]. Our
results complement the recent literature by showing cell
survival in the periphery coinciding with the suggested
niche of stem cells. It is not entirely clear if the cells in the
periphery survive because they are stem cells or because
they have a better vascular support and a milieu of protective cytokines. It is possibly due to a combination of these
factors. Future studies on molecular changes on the surviving cells after treatment, in terms of stem cell marker expression and EMT state will shed more light on the
mechanisms that protect these cells from apoptosis.
Conclusion
In summary this study has identified a number of morphological and molecular differences between the bulk
Page 11 of 13
of the tumor and the periphery that may account for the
resistance to VDAs that is specifically associated with
the periphery. A better characterization of the tumor
cells in the periphery before and after treatment could
lead to rational drug combination therapies for total
tumor eradication.
Additional files
Additional file 1: Figure S1. MoCR Liver metastases. Metastases are
induced by intrasplenic injection of 5x 10⁴ tumor cells. (A) Liver with
metastases at 18 days post tumor induction. (B) Liver slices with
metastases at 21 days post tumor induction, as used to calculate tumor
load. (C) H&E stained liver section containing metastases of varying sizes.
Additional file 2: Table S1. List of antibodies and conditions used.
Additional file 3: Figure S2. Tumor vascular staining with CD31 and
CD34 endothelial cell markers. Sections of the same MoCR tumor were
stained. Low magnification scale bar=250 μm, high magnification scale
bar=50μm. A and C: CD31 staining detected with DAB (brown), B and D:
CD34 staining detected with Vulcan fast red. Both markers stain
approximately equal number of tumor vessels, in addition CD31 stains
liver vessels and sinusoids.
Additional file 4: Figure S3. Spatial differences in tumor vessel maturity
in solid tumors. (A), Formalin fixed liver sections with CRC liver
metastases. Low magnification scale bar=500 μm, high magnification
scale bar=25 μm. (1-4), stained with antibodies to αSMA (staining of
pericytes on mature vessels) detected with DAB (brown). (5-6), stained
with antibodies to CD34 endothelial cell marker detected with Vulcan
fast red. Image1, depicts a low magnification of a whole tumor section.
Images 2 and 3 depict host vessels and tumor vessels respectively in the
periphery staining positive for pericytes. Image 4 depicts a central tumor
vessel staining negative for pericytes. Images 5 and 6 are sections from
the same tumor showing strong CD34 staining of the central vessel
while the peripheral vessels show only weak and partial staining. Tumor
fibroblasts and some tumor cells are also positive for αSMA. Pericytes are
mostly flat cells lining the vessels (arrows). (B) Double staining for
Angiopoetin 1(vessel maturity marker) detected with DAB (brown), and
CD34 endothelial cell marker detected with Vulcan fast red. Scale
bar=250 μm. Angiopoetin1 is preferentially associated with the periphery
as shown in inset 1and inset 2 (a peripheral vessel between two adjacent
tumors and a central vessel respectively).
Additional file 5: Figure S4.Endothelial cell and tumor cell apoptosis
following OXi4503 treatment. Low magnification scale bar=250 μm, high
magnification scale bar=50 μm. Formalin fixed liver sections with CRC
liver metastases (A) control and (B) 24 hours following OXi4503
treatment. Inset 1 shows tumor periphery and inset 2 shows tumor
center. Sections were doubly immunostained for CD34 and active
caspase-3 (apoptosis marker) and detected with Vulcan fast red and DAB
(brown) respectively. Control tumor shows some areas of tumor cell
apoptosis but no double staining is apparent. In contrast treated tumors
show extensive double staining indicating vascular endothelial cell
apoptosis as indicated with black arrows. Red arrows in inset B1 indicate
patent vessels in the tumor periphery.
Competing interests
The authors declare that they have no competing interests.
Authors’ contributions
LN carried out the majority of the experiments collected data, contributed to
data analysis and to manuscript draft. TF contributed in the experimental
design, assisted in experimental work and data analysis and wrote the
manuscript. MC-W assisted in experimental work, data analysis and statistics
and edited the manuscript. LC performed some of the animal experiments
and the immunostaining for hypoxia, b-FGF and TGF-β. PLC assisted with
data analysis and statistics. MN, VM and CC contributed to study design and
Nguyen et al. BMC Cancer 2012, 12:522
/>
edited the manuscript. CC is the head of the department. All authors have
read and approved the final manuscript.
Acknowledgements
This work was supported by funds obtained from the National Health and
Medical Research Council (NHMRC) of Australia, project grant number
400190 And the Austin Hospital Medical Research Fund (AHMRF). LN and LC
were supported by postgraduate research scholarships from Australian
Rotary Health Research Foundation.
Received: 16 December 2011 Accepted: 7 November 2012
Published: 15 November 2012
References
1. Folkman J: Anti-angiogenesis: new concept for therapy of solid tumors.
Ann Surg 1972, 175:409–416.
2. Chaplin DJ, Hill SA: The development of combretastatin A4 phosphate as a
vascular targeting agent. Int J Radiat Oncol Biol Phys 2002, 54(5):1491–1496.
3. Tozer GM, Kanthou C, Baguley BC: Disrupting tumour blood vessels. Nat
Rev Cancer 2005, 5:423–435.
4. Siemann DW, Horsman MR: Vascular targeted therapies in oncology. Cell
Tissue Res 2009, 335:241–248.
5. Rice L, Pampo C, Lepler S, Rojiani AM, Siemann DW: Support of a free
radical mechanism for enhanced antitumor efficacy of the microtubule
disruptor OXi4503. Microvasc Res 2011, 81:44–51.
6. Malcontenti-Wilson C, Chan L, Nikfarjam M, Muralidharan V, Christophi C:
Vascular targeting agent Oxi4503 inhibits tumor growth in a colorectal
liver metastases model. J Gastroenterol Hepatol 2008, 23:e96–e104.
7. Dalal S, Burchill SA: Preclinical evaluation of vascular-disrupting agents in
Ewing’s sarcoma family of tumours. Eur J Cancer 2009, 45:713–722.
8. Ljuslinder I, Melin B, Henriksson ML, Oberg A, Palmqvist R: Increased
epidermal growth factor receptor expression at the invasive margin is a
negative prognostic factor in colorectal cancer. Int J Cancer 2011,
128:2031–2037.
9. Matsuda Y, Ishiwata T, Yamahatsu K, Kawahara K, Hagio M, Peng WX,
Yamamoto T, Nakazawa N, Seya T, Ohaki Y, Naito Z: Overexpressed
fibroblast growth factor receptor 2 in the invasive front of colorectal
cancer: a potential therapeutic target in colorectal cancer. Cancer Lett
2011, 309:209–219.
10. Lin WX, Fifis T, Malcontenti-Wilson C, Nikfarjam M, Muralidharan V, Nguyen
L, Christophi C: Induction of Th1Immune responses following laser
ablation in a murine model of colorectal liver metastases. J Transl Med
2011, 9:83.
11. Allavena P, Sica A, Garlanda C, Mantovani A: The Yin-Yang of tumorassociated macrophages in neoplastic progression and immune
surveillance. Immunol Rev 2008, 222:155–161.
12. DeNardo DG, Barreto JB, Andreu P, Vasquez L, Tawfik D, Kolhatkar N,
Coussens LM: CD4(+) T cells regulate pulmonary metastasis of mammary
carcinomas by enhancing protumor properties of macrophages. Cancer
Cell 2009, 16:91–102.
13. Hagemann T, Robinson SC, Schulz M, Trumper L, Balkwill FR, Binder C:
Enhanced invasiveness of breast cancer cell lines upon co-cultivation
with macrophages is due to TNF-alpha dependent up-regulation of
matrix metalloproteases. Carcinogenesis 2004, 25:1543–1549.
14. Jarnicki AG, Lysaght J, Todryk S, Mills KH: Suppression of antitumor
immunity by IL-10 and TGF-beta-producing T cells infiltrating the
growing tumor: influence of tumor environment on the induction of
CD4+ and CD8+ regulatory T cells. J Immunol 2006, 177:896–904.
15. Kuruppu D, Christophi C, Bertram JF, O’Brien PE: Characterization of an
animal model of hepatic metastasis. J Gastroenterol Hepatol 1996, 11:26–32.
16. Chan LS, Malcontenti-Wilson C, Muralidharan V, Christophi C: Effect of
vascular targeting agent Oxi4503 on tumor cell kinetics in a mouse
model of colorectal liver metastasis. Anticancer Res 2007, 27:2317–2323.
17. Lee TH, Bolontrade MF, Worth LL, Guan H, Ellis LM, Kleinerman ES:
Production of VEGF165 by Ewing’s sarcoma cells induces vasculogenesis
and the incorporation of CD34+ stem cells into the expanding tumor
vasculature. Int J Cancer 2006, 119:839–846.
18. Hall AP: Review of the pericyte during angiogenesis and its role in
cancer and diabetic retinopathy. Toxicol Pathol 2006, 34:763–775.
Page 12 of 13
19. Rofstad EK, Maseide K: Radiobiological and immunohistochemical
assessment of hypoxia in human melanoma xenografts: acute and chronic
hypoxia in individual tumours. Int J Radiat Biol 1999, 75:1377–1393.
20. Brabletz T, Hlubek F, Spaderna S, Schmalhofer O, Hiendlmeyer E, Jung A,
Kirchner T: Invasion and metastasis in colorectal cancer: epithelialmesenchymal transition, mesenchymal-epithelial transition, stem cells
and beta-catenin. Cells Tissues Organs 2005, 179:56–65.
21. Spaderna S, Schmalhofer O, Hlubek F, Berx G, Eger A, Merkel S, Jung A,
Kirchner T, Brabletz T: A transient, EMT-linked loss of basement
membranes indicates metastasis and poor survival in colorectal cancer.
Gastroenterology 2006, 131:830–840.
22. Kaelin WG Jr: The von Hippel-Lindau protein, HIF hydroxylation, and
oxygen sensing. Biochem Biophys Res Commun 2005, 338:627–638.
23. Chan LS, Malcontenti-Wilson C, Muralidharan V, Christophi C: Alterations in
vascular architecture and permeability following OXi4503 treatment.
Anticancer Drugs 2008, 19:17–22.
24. Brieger J, Schroeder P, Gosepath J, Mann WJ: VEGF-subtype specific
protection of SCC and HUVECs from radiation induced cell death. Int J
Mol Med 2005, 15:145–151.
25. Varey AH, Rennel ES, Qiu Y, Bevan HS, Perrin RM, Raffy S, Dixon AR,
Paraskeva C, Zaccheo O, Hassan AB, Harper SJ, Bates DO: VEGF 165 b, an
antiangiogenic VEGF-A isoform, binds and inhibits bevacizumab
treatment in experimental colorectal carcinoma: balance of pro- and
antiangiogenic VEGF-A isoforms has implications for therapy. Br J Cancer
2008, 98:1366–1379.
26. Cianchi F, Cuzzocrea S, Vinci MC, Messerini L, Comin CE, Navarra G, Perigli G,
Centorrino T, Marzocco S, Lenzi E, Battisti N, Trallori G, Masini E:
Heterogeneous expression of cyclooxygenase-2 and inducible nitric
oxide synthase within colorectal tumors: correlation with tumor
angiogenesis. Dig Liver Dis 2010, 42:20–27.
27. Koshikawa N, Mizushima H, Minegishi T, Eguchi F, Yotsumoto F, Nabeshima K,
Miyamoto S, Mekada E, Seiki M: Proteolytic activation of heparin-binding
EGF-like growth factor by membrane-type matrix metalloproteinase-1 in
ovarian carcinoma cells. Cancer Sci 2011, 102:111–116.
28. Akishima-Fukasawa Y, Ishikawa Y, Akasaka Y, Uzuki M, Inomata N, Yokoo T,
Ishii R, Shimokawa R, Mukai K, Kiguchi H, et al: Histopathological predictors
of regional lymph node metastasis at the invasive front in early
colorectal cancer. Histopathology 2011, 59(3):470–481.
29. Scarpino S, Duranti E, Stoppacciaro A, Pilozzi E, Natoli G, Sciacchitano S,
Luciani E, Ruco L: COX-2 is induced by HGF stimulation in Met-positive
thyroid papillary carcinoma cells and is involved in tumour invasiveness.
J Pathol 2009, 218:487–494.
30. Tan X, Egami H, Ishikawa S, Sugita H, Kamohara H, Nakagawa M, Nozawa F,
Abe M, Ogawa M: Involvement of matrix metalloproteinase-7 in invasionmetastasis through induction of cell dissociation in pancreatic cancer. Int
J Oncol 2005, 26:1283–1289.
31. Wente MN, Mayer C, Gaida MM, Michalski CW, Giese T, Bergmann F, Giese
NA, Buchler MW, Friess H: CXCL14 expression and potential function in
pancreatic cancer. Cancer Lett 2008, 259:209–217.
32. Schmalhofer O, Brabletz S, Brabletz T: E-cadherin, beta-catenin, and ZEB1 in
malignant progression of cancer. Cancer Metastasis Rev 2009, 28:151–166.
33. Janda E, Lehmann K, Killisch I, Jechlinger M, Herzig M, Downward J, Beug H,
Grunert S: Ras and TGF[beta] cooperatively regulate epithelial cell
plasticity and metastasis: dissection of Ras signaling pathways. J Cell Biol
2002, 156:299–313.
34. Yang AD, Camp ER, Fan F, Shen L, Gray MJ, Liu W, Somcio R, Bauer TW, Wu
Y, Hicklin DJ, Ellis LM: Vascular endothelial growth factor receptor-1
activation mediates epithelial to mesenchymal transition in human
pancreatic carcinoma cells. Cancer Res 2006, 66:46–51.
35. Tozer GM, Prise VE, Wilson J, Locke RJ, Vojnovic B, Michael RL, Stratford MRL
Dennis MF, Chaplin DJ: Combretastatin A-4 Phosphate as a Tumor
Vascular-Targeting Agent: Early Effects in Tumors and Normal Tissues.
Cancer Res 1999, 59:1626–1634.
36. Salmon BA, Siemann DW: Characterizing the tumor response to
treatment with combretastatin A4 phosphate. Int J Radiat Oncol Biol Phys
2007, 68:211–217.
37. Wankhede M, Dedeugd C, Siemann DW, Sorg BS: In vivo functional
differences in microvascular response of 4T1 and Caki-1 tumors after
treatment with OXi4503. Oncol Rep 2010, 23:685–692.
38. Gaya A, Daley F, Taylor NJ, Tozer G, Qureshi U, Padhani A, Pedley RB, Begent
R, Wellsted D, Stirling JJ, Rustin G: Relationship between human tumour
Nguyen et al. BMC Cancer 2012, 12:522
/>
39.
40.
41.
42.
43.
44.
45.
46.
47.
48.
49.
50.
Page 13 of 13
angiogenic profile and combretastatin-induced vascular shutdown: an
exploratory study. Br J Cancer 2008, 99:321–326.
Maddika S, Ande SR, Panigrahi S, Paranjothy T, Weglarczyk K, Zuse A,
Eshraghi M, Manda KD, Wiechec E, Los M: Cell survival, cell death and cell
cycle pathways are interconnected: implications for cancer therapy. Drug
Resist Updat 2007, 10:13–29.
Nguyen DX, Massague J: Genetic determinants of cancer metastasis. Nat
Rev Genet 2007, 8:341–352.
Gottesman MM, Fojo T, Bates SE: Multidrug resistance in cancer: role of
ATP-dependent transporters. Nat Rev Cancer 2002, 2:48–58.
Jain RK: Normalization of tumor vasculature: an emerging concept in
antiangiogenic therapy. Science 2005, 307:58–62.
Siemann DW, Chaplin DJ, Horsman MR: Vascular-targeting therapies for
treatment of malignant disease. Cancer 2004, 100:2491–2499.
Jordan CT, Guzman ML, Noble M: Cancer stem cells. N Engl J Med 2006,
355:1253–1261.
Todaro M, Alea MP, Di Stefano AB, Cammareri P, Vermeulen L, Iovino F,
Tripodo C, Russo A, Gulotta G, Medema JP, Stassi G: Colon cancer stem
cells dictate tumor growth and resist cell death by production of
interleukin-4. Cell Stem Cell 2007, 1:389–402.
Calabrese C, Poppleton H, Kocak M, Hogg TL, Fuller C, Hamner B, Oh EY,
Gaber MW, Finklestein D, Allen M, Frank A, Bayazitov IT, Zakharenko SS,
Gajjar A, Davidoff A, Gilbertson RJ: A perivascular niche for brain tumor
stem cells. Cancer Cell 2007, 11:69–82.
Fodde R, Brabletz T: Wnt/beta-catenin signaling in cancer stemness and
malignant behavior. Curr Opin Cell Biol 2007, 19:150–158.
Hermann PC, Huber SL, Herrler T, Aicher A, Ellwart JW, Guba M, Bruns CJ,
Heeschen C: Distinct populations of cancer stem cells determine tumor
growth and metastatic activity in human pancreatic cancer. Cell Stem Cell
2007, 1:313–323.
Mani SA, Guo W, Liao MJ, Eaton EN, Ayyanan A, Zhou AY, Brooks M,
Reinhard F, Zhang CC, Shipitsin M, Campbell LL, Polyak K, Brisken C, Yang J,
Weinberg RA: The epithelial-mesenchymal transition generates cells with
properties of stem cells. Cell 2008, 133:704–715.
Moody SE, Perez D, Pan TC, Sarkisian CJ, Portocarrero CP, Sterner CJ,
Notorfrancesco KL, Cardiff RD, Chodosh LA: The transcriptional repressor
Snail promotes mammary tumor recurrence. Cancer Cell 2005, 8:197–209.
doi:10.1186/1471-2407-12-522
Cite this article as: Nguyen et al.: Spatial morphological and molecular
differences within solid tumors may contribute to the failure of vascular
disruptive agent treatments. BMC Cancer 2012 12:522.
Submit your next manuscript to BioMed Central
and take full advantage of:
• Convenient online submission
• Thorough peer review
• No space constraints or color figure charges
• Immediate publication on acceptance
• Inclusion in PubMed, CAS, Scopus and Google Scholar
• Research which is freely available for redistribution
Submit your manuscript at
www.biomedcentral.com/submit