Potential use of satellite observations to detect suspended sediment in delta region: A case study of the Red river delta, Vietnam
Bạn đang xem bản rút gọn của tài liệu. Xem và tải ngay bản đầy đủ của tài liệu tại đây (1023.28 KB, 7 trang )
Doi: 10.31276/VJSTE.62(3).03-9
Physical Sciences | Physics, Environmental Sciences | Ecology
Potential use of satellite observations
to detect suspended sediment in delta region:
a case study of the Red river delta, Vietnam
Hue Thi Dao1*, Tung Duc Vu2
1
Thuyloi University
Vietnam Disaster Management Authority, Ministry of Agriculture and Rural Development, Vietnam
2
Received 4 December 2019; accepted 2 April 2020
Abstract:
Introduction
Building an integrated river delta basin and coastal
management plan in the context of climate change
requires suspended sediments data, which plays
an important role and is the key component for
understanding the hydrology regime in the delta
region. Sediments are responsible for carrying a
considerable amount of nutrients and contaminants.
Most sediment discharge data is acquired by surveys/
data collection activities or by mathematical modelling.
However, these methods are costly, time-consuming,
and complex. Therefore, in this study, the authors
investigate the potential use of satellite observations
(MODIS reflectance) to detect suspended sediment
flux in the Red river delta (RRD) of Vietnam. The
relationships between discharge (Q), suspended
sediment concentration (SSC), and total load (L)
collected from the three in-situ stations Son Tay station
(ST), Thuong Cat station (TC), and Hanoi station (HN)
in the RRD are determined by regression analyses
of reflectance data (R) obtained from MODIS bands
1-2 (250-m resolution). The results present a close
connection between the monthly average of SSC and R
and a good statistical relationship between the monthly
average of Q and R in HN. At TC and ST, a lower
correlation was found compared to HN because of the
cloud cover and the position where data was collection
in the river. The coefficient of determination ranged
from 0.11 to 0.40 for the R-SSC and R-Q relationships.
A method of estimating SSC and L at a single point
along the river using data from Q and R was proposed
based on the relationship correlation results.
Suspended sediment, which includes organic and
inorganic materials within the water flow, is a natural part of
a river system. The primary sources of suspended sediment
come from the erosion of soil, mass movements such as
landslides, and riverbank erosion or human interventions on
the landscape [1-3]. High amounts of suspended sediment
in water can reduce the transmission of light, which not
only affects the phytoplankton species in short term but
also the entire ecosystem in the long term. Suspended
sediment plays an important role in shaping the landscape,
transporting nutrients to various species, and creating
ecological habitats [4, 5]. Similarly, pollutants can adhere to
suspended sediment while in transport and thus suspended
sediment can influence pollutant movement. Suspended
sediment is also an indicator of issues occurring in the
river delta and coastal areas, which include water quality,
ecological degradation, and soil and/or riverbank erosion.
To develop a suitable river basin management strategy,
frequent monitoring of suspended sediment is critical.
Keywords: delta region, discharge, MODIS, regression
analysis, suspended sediment.
Classification numbers: 2.1, 5.1
*
Despite the importance of suspended sediment, it is
poorly gauged due to the lack of in-situ networks in many
areas and especially in developing countries. We choose
the RRD for this research because this region has several
meteorological stations. However, they have not been
operated for some time due to lack of budget and thus this
region is considered to be ungauged basin. Moreover, the
RRD is one of two largest and most important deltas in
Vietnam; however, it has not received as much attention as
the Mekong river delta. Thus, research in this area is central
to the critical understanding of this important region.
Data quality is also a concern since monitoring suspended
sediment depends on the number of stations, their locations,
and the frequency of measurements [6]. There are some
Corresponding author: Email:
September 2020 • Volume 62 Number 3
Vietnam Journal of Science,
Technology and Engineering
3
Physical Sciences | Physics, Environmental Sciences | Ecology
methods to obtain suspended sediment information such
as using empirical models, physically-based mathematical
models, and field sampling. Recently, the use of satellite
images to detect suspended sediment has captured the
attention of researchers [7-9]. There are studies that use
Moderate Resolution Imaging Spectroradiometer (MODIS)
images or Landsat Thematic Mapper (TM) and Enhanced
Thematic Mapper Plus (ETM+) imagery to characterize
the spatial and temporal pattern of surface sediments [1013] based on the very close relationship between R and
suspended sediment concentration. Recent results show that
satellite remote sensing technology is applicable and useful
to obtain not only suspended sediment information but also
other hydrological parameters of these ungauged areas [14].
This study aims to investigate the potential use of
satellite observations (MODIS reflectance) to detect the
seasonal change of suspended sediment flux in the RRD
region. We first extract the satellite reflectance value at the
location of the station and then apply simple regression
analysis to the reflectance, discharge, suspended sediment,
and total sediment load on the same day. The simple
regression analysis used in this paper refers to the use of
single variable (R) for one dependent variable (suspended
sediment or discharge). We choose the simple regression
analysis because of limitations in the available data and the
objective of our research. Regression analysis performance
is examined by the coefficient of determination. Only one
band of reflection data was used to access the relationship
with other hydrological factors. In future research, multiband reflection data will be used to provide better results by
using multi-regression analysis.
Study area
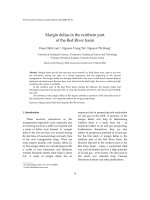
Fig. 1. Study area and location of the three stations.
Data
Station
The RRD is one of the largest deltas in Vietnam, the
fourth largest delta in Southeast Asia in terms of delta plain
size, and is also one of the chief deltas in Asia. The RRD
lies in the northern part of Vietnam with a total delta area
of 15000 km2. The delta includes two large river systems:
the Red river and Thai Binh river systems. The discharge
in Red river is 120 km3 of water annually and 130×106 ton/
year of mean annual suspended sediment load. During the
wet season from June to January, about 90% of the annual
sediment supply is transported from a large number of
distributaries. About 11.7% of the total amount of sediment
goes through the Van Uc and Thai Binh river mouths, 37.8%
passes through the Ba Lat mouth [15], 23.7% through the
Day river mouth, and the remaining amount of sediment
passes through the Tra Ly river mouth.
Vietnam Journal of Science,
Technology and Engineering
To explore the relationship between Q-SSC, R-Q,
R-SSC, and L-Q, three locations in this delta were taken into
account, namely, ST, TC, and HN. ST is located upstream of
the Red river and TC and HN are located at the Duong river
and Red river, respectively, as shown in Fig. 1.
Table 1. Location, date, and sources of data in 3 stations in RRD.
Materials and methods
4
The climate in RRD is sub-tropical and formed by a
summer monsoon from the South and a winter monsoon from
the North-East. The two wet seasons account for 85-95%
of the total rainfall per year [16]. The mean annual rainfall
was 1590 mm and mean annual potential evapotranspiration
ranged from 880 to 1150 mm per year [17].
ST
TC
HN
Longitude
21.15
21.06
21.01
September 2020 • Volume 62 Number 3
Latitude
105.50
105.86
105.85
Data product
Date
(month-day-year)
Source
Daily discharge
1/1/2012-12/31/2013
VAWR
Daily suspended
sediment
1/1/2012-12/31/2013
VAWR
Daily MODIS
band 1
1/1/2012-12/31/2013
(182 scenes)
LP
DAAC
Daily discharge
1/1/2012-12/31/2013
VAWR
Daily suspended
sediment
1/1/2012-12/31/2013
VAWR
Daily MODIS
band 1
1/1/2012-12/31/2013
(171 scenes)
LP
DAAC
Daily discharge
1/1/2012-12/31/2013
VAWR
Daily suspended
sediment
1/1/2012-12/31/2013
VAWR
Daily MODIS
band 1
1/1/2012-12/31/2013
(171 scenes)
LP
DAAC
Physical Sciences | Physics, Environmental Sciences | Ecology
Methods
L=Q*SSC
(1)
The performance of the regression model was checked
by the coefficient of determination.
Results and discussion
Time series analysis of Q, SSC, L and R
The temporal change in Q, SSC, and L are described in
Figs. 2, 3, and 4. In general, the trends of Q and SSC during
the time are similar to all stations, that is, increasing during
the first half of the year and decreasing during the remaining
time. From Fig. 2, because ST is positioned upstream, Q
in ST is equal to the sum of Q in TC and HN due to water
balance of the river system. In addition, Q at all 3 stations
had a similar pattern; increasing from the beginning of the
year and reaching a peak of about 9000 m3/s in September,
then a decrease to just over 1000 m3/s until the end of the
the
river system. in addition, Q at all 3 stations had a similar pattern;
year.
beginning
of the in
year
and reaching a peak of about 9000 m3/s in Septem
the river system.
3addition, Q at all 3 stations had a similar pattern; in
to just
over
m /sand
until
the
the of
year.
From
Fig.
3, year
each
station
hadend
a different
temporal
pattern
beginning
of 1000
the
reaching
aof
peak
about 9000
m3/s in Septembe
3
SSC
change.
The
SSC
in TC
was
highest
toofjust
over
1000
/s
until
the
end
of athe
year. compared
From
Fig. m
3,
each
station
had
different
temporal to
pattern of SSC
other
stations
although
it
is
located
in
the
distributary
and
TC was
highest
compared
to
other
stations
although
it
is
located
the ch
di
From Fig. 3, each station had a different temporal pattern
ofinSSC
ST
is
in
the
upstream
of
the
river
network
system.
in
the
upstream
of
the
river
network
system.
TC was highest compared to other stations although it is located in the dist
in the10000
upstream of the river network system.
Discharge, Q (m3/s) 3
Discharge, Q (m /s)
9000
10000
8000
9000
7000
8000
6000
7000
5000
6000
4000
5000
3000
4000
2000
3000
1000
2000
0
1000
Sep-11
0
Sep-11
TC
TCHN
ST
HN
ST
Apr-12
oct-12
May-13 Nov-13
Jun-14
Time
Apr-12
oct-12
May-13 Nov-13
Jun-14
Fig. 2.
change
in discharge,
Q, atQ,the
stations
Fig.
2. Temporal
Temporal
change
inTime
discharge,
at three
the three
stations
TC, HN
Fig. 2. Temporal
change in discharge, Q, at the three stations TC, HN,
300
TC, HN, and ST.
Suspended sediment, SSC
Suspended3 sediment, SSC
(g/m ) 3
(g/m )
Table 1 shows the location, date, and sources of all data
from the three stations used in this study. The daily discharge
and daily suspended sediment concentration data from the
three stations were obtained from the Vietnam Academy
for Water Resources (VAWR) over the course of two years:
2012 and 2013. Basically, they are measured in the middle
of the river at 0.5 m, 1 m, and 3 m from the water’s surface
then the average values are taken. Moreover, one specific
objective is to explore the relationship between R and other
hydrological factors that do not depend on time, thus the
period of 2012-2013 is suitable for this study. On the other
hand, the reflectance data was extracted from MODIS
Surface Reflectance (code: MOD09). In general, MOD09 is
a seven-band product computed from MODIS level 1B land
bands 1 (620-670 nm), 2 (841-876 nm), 3 (459-479 nm), 4
(545-565 nm), 5 (1230-1250 nm), 6 (1628-1652 nm), and
7 (2105-2155 nm). Most satellite data processing systems
recognise five distinct levels of processing. Level 0 data is
raw satellite feeds. Level 1 data has been radiometrically
calibrated but not otherwise altered. Level 2 data is level
1 data that has been atmospherically corrected to yield a
surface reflectance product. Level 3 data is level 2 data that
has been gridded into a map projection and usually has also
been temporally composited or averaged. Finally, level 4
data are products that have been put through additional
processing. Due to the available data and the objective of our
research, the images from MODIS Terra band 1 (620-670
nm, 250-m resolution and Surface Reflectance daily level
2 global (MOD09GQ)) is downloaded from USGS freely,
then this data was input and extracted by ArcGIS software
for retrieval of R from the pixel of the station’s location.
In this study, only the reflectance on a cloud-free day with
less than 0.2 cloud fraction are acquired at the observation
point of the gauged station and used for regression analysis.
In total, 167 Terra MODIS images were acquired over two
years for assessing the reflectance in TC and 171 images
and 182 images were downloaded to use for HN and ST,
respectively, from the beginning of 2012 to the end of 2013.
300
250
250
200
TC
200
150
TCHN
150
100
ST
HN
10050
ent load, L (g/s)
diment load, L (g/s)
ST
To estimate the possible relationship between Q-SSC,
50
0
R-SSC, R-Q, and L-Q, we apply the single regression
Sep-11
Apr-12
oct-12
May-13 Nov-13
Jun-14
0
analysis to the reflectance values, observed Q, and observed
Time
Sep-11
Apr-12
oct-12
May-13 Nov-13
Jun-14
SSC on the same day the MODIS images were taken. The Fig. 3. Temporal
change in suspended
sediment, SSC, at the three sta
Time
total sediment load is calculated by the multiplication of Q Fig.
ST.
changeininsuspended
suspendedsediment,
sediment,
SSC,
at the three stati
Fig. 3.
3. Temporal
Temporal change
SSC,
at the
three stations TC, HN, and ST.
and SSC as shown in Eq. (1):
ST.
1200000
1200000
1000000
1000000
800000 62 Number 3
September 2020 • Volume
800000
600000
600000
400000
Vietnam Journal of Science,
Technology and Engineering
5
TC
TCHN
each station for a total of 24 data points over 2 years for monthly regressio
through Fig. 8 show scatter plots of the relationships between L-Q, Q-SSC,
0
The
results of the relationship equations and performances of the regres
Sep-11 Apr-12 oct-12 May-13 Nov-13 Jun-14
represented
in Table 2. The best fit results for all the relationships in our
Time
power
function.
Fig.
3. Temporal
change| Physics,
in suspended
sediment, SSC,Sciences
at the three| Ecology
stations TC, HN, and
Physical
Sciences
Environmental
Su
50
Total sediment load, L (g/s)
ST.
1200000
1000000
800000
TC
600000
HN
400000
ST
200000
0
Sep-11
Apr-12
oct-12 May-13
Time
Nov-13
Jun-14
From Table 2, a significant overall relationship between total load, L,
was observed with a high value of R2 that was greater than 0.8 at all
The fit ofresults
alsofitshowed
a very
close
parameters
the three
equations,
in this
case,connection
were also similar. For ex
factor
andQ exponent
ranged
from
to had
1.26 and 1.49 to 1
between
and SSC atparameters
the TC station
while
HN0.23
and ST
Thus,
in
future
studies,
the
relationship
between
L
and
Q
can be defined by
a lower performance regression compared to TC. However,
for
the
three
stations.
the scaling factors found from the three relationship
The fitwere
results
showedfrom
a very
equations
veryalso
different
eachclose
otherconnection
with the between Q an
station
while
HN
and
ST
had
a
lower
performance
smallest value of 19.87 and largest value of 116.53 regression
due to a compared to
scaling
factors
found
from
the
three
relationship
equations
wide range of both q and SSC at each location (see Figs. 2 were very di
other
with
smallest
value
19.87
and largest
valueinofthe116.53 due to a w
and 3).
In the
contrast,
there
wasofonly
a slight
difference
q and SSC at each location (see Figs. 2 and 3). In contrast, there was only
value of the exponent in the relationship equation of Q-SSC.
in the value of the exponent in the relationship equation of Q-SSC.
Fig.
4. Temporal change in total load, L, at the three stations TC,1000
HN, and ST.
Fig. 4. Temporal change in total load, L, at the three stations
TC, HN, and ST.
Regression analysis
Due to the effects of clouds on the reflectance value, we
eliminated several points at each station for a total of 24
data points over 2 years for monthly regression analysis.
Fig. 5 through Fig. 8 show scatter plots of the relationships
between L-Q, Q-SSC, R-Q, and R-SSC. The results of the
relationship equations and performances of the regression
analyses are represented in Table 2. The best fit results for
all the relationships in our study followed a power function.
From Table 2, a significant overall relationship between
total load, L, and discharge, Q, was observed with a high
value of R2 that was greater than 0.8 at all stations. The
fit parameters of the three fit equations, in this case, were
also similar. For example, the scaling factor and exponent
parameters ranged from 0.23 to 1.26 and 1.49 to 1.86,
respectively. Thus, in future studies, the relationship
between L and Q can be defined by a single equation for the
three stations.
400
5
200
0
0
TC
Power (ST)
10000
9000
8000
7000
6000
5000
4000
3000
2000
1000
0
0.09
100.09
200.09
300.09
400.09
Monthly mean suspended sediment concentration, SSC (g/m3)
TC
HN
ST
Power (TC)
Power (HN)
Power (ST)
Fig. 6. Scatter plots of monthly mean discharge, Q, and monthly
mean suspended sediment concentration, SSC, at the three
stations TC, HN, and ST.
Fig. 6. Scatter plots of monthly mean discharge, Q, and monthly mea
sediment concentration, SSC, at the three stations TC, HN, and ST.
9000
September 2020 • Volume 62 Number
3
8000
harge, Q (m3/s)
Vietnam Journal of Science,
Technology and Engineering
Power (HN)
10000
Fig. 5.
of monthly
meanmean
total load,
and monthly
Fig.
5. Scatter
Scatterplots
plots
of monthly
total L,load,
L, and monthly mean
mean discharge, Q, at the three stations TC, HN, and ST.
the
three stations TC, HN, and ST.
10000
6
2000
4000
6000
8000
Monthly mean discharge, Q (m3/s)
HN
ST
Power (TC)
Monthly mean discharge, Q (m3/s)
SSC (Fig. 3). The discharge at TC, on average, makes up
approximately 45% of Q at ST. However, the total load, L,
at TC is about 78% of L at ST during 2012 due to a dramatic
increase in SSC at TC (Fig. 3). It is noted that SSC does
not follow the balance term because of bank erosion or
landslides along the river. However, the total sediment load
seems to satisfy the general principle of mass balance: L at
ST is equal to the sum of L at TC and L at HN. Moreover,
the load of suspended sediment was higher in the rainy
season than in the dry season.
Monthly mean total load, L (106 g/s)
800
As shown in Eq. (1), the total load, L, (Fig. 4) is the product of
discharge, Q, (Fig. 2)
shown insediment,
Eq. (1), the
total
load,3).L,The
(Fig.discharge
4) is the at TC, on average, makes up
and As
suspended
SSC
(Fig.
approximately
45% of Q,
Q at
ST.2)However,
the total
load, L, at TC is600about 78% of L at ST
product of discharge,
(Fig.
and suspended
sediment,
7000
6000
Monthly mean suspended sediment concentration, SSC (g/m3)
TC
HN
ST
Power (TC)
Power (HN)
Power (ST)
Eq.
(3)
(1)
Physical Sciences | Substituting
Physics, Environmental
Substituting
Eq. (2)
(2) and
and Eq.
Eq. Sciences
(3) into
into Eq.
Eq.| Ecology
(1) reveals
reveals
Monthly mean discharge, Q (m3/s)
b
β
aQmonthly
= Q*αR
Q*αRmean
b=
β
Fig. 6. Scatter plots of monthly mean discharge, Q, andaQ
suspended
sediment concentration, SSC, at the three stations TC, HN, Then,
and ST.
Then,
Then,
10000
9000
8000
(( ))
(6)
(( ))
(7)
ComparingEq.
Eq.(6)(6)
(6)
with
Eq.
(4)
gives
Comparing
Eq.
with
gives
Comparing
with
Eq.Eq.
(4) (4)
gives
7000
6000
5000
4000
and
and
and
3000
2000
((
1000
))
(8)
Depending
Depending on
on Eq.
Eq. (7)
(7) and
and Eq.
Eq. (8),
(8), it
it is
is possible
possible to
to estimate
estimate the
the pp
three
equations
(Eq.
(2)
Eq.
(3),
or
Eq.
(4))
from
the
parameters
Depending
on
Eq.
(7)
and
Eq.
(8),
it
is
possible
to
three equations (Eq. (2) Eq. (3), or Eq. (4)) from the parameters of
of
example,
observed
specific
point
river
estimate if
parameters
forQ
three equations
example,
ifthewe
we
observed
Qoneat
atofaa the
specific
point of
of(Eq.
river section,
section, w
w
TC
HN
ST
satellite-observed
R
and
then
γ
and
δ
parameter
in
Eq.
(4)
could
be
(2)
Eq.
(3),
or
Eq.
(4))
from
the
parameters
of
the
other
satellite-observed R and then γ and δ parameter in Eq. (4) could be oo
Power (TC)
Power (HN)
Power (ST) parameters a and b could be possibly estimated from hydro-geolo
equations. aForand
example,
if we
a specific from
point hydro-geolo
parameters
b could
beobserved
possiblyQ at
estimated
land
cover
in
the
upstream
area
using
a
regionalization
scheme
land
cover
in
the
upstream
area
using
a
regionalization
scheme [18]
[18]
of
river
section,
we
can
correlate
Q
with
satellite-observed
Fig.
7. Scatter
Scatterplots
plotsof of
monthly
reflectance,
and monthly mean discharge, Q, at the
Fig. 7.
monthly
reflectance,
R, andR,monthly
δ,
a,
and
b
are
identified
through
the
above
procedure,
α
and
β
δ, Ra,and
andthen
b are
through
thecould
above
procedure,
in
mean stations
discharge,TC,
Q, atHN,
the three
stations TC, HN, and ST.
three
and ST.
γ andidentified
δ parameter
in Eq. (4)
be obtained.
In α and β in
from
Eqs.
(7)
and
(8)
without
using
observed
SSC
data.
Then,
Eq.
2
from
Eqs.
(7)
and
(8)
without
using
observed
SSC
data.
Then,
Eq.
addition,atthe
a and
b could
be possibly estimated
A close relationship between R-Q and R-SSC were near-real-time
recorded
theparameters
HN station.
The
Rusing
SSC
monitoring
satellite observed
water-surf
A was
close0.40
relationship
between
R-QR-SSC,
and R-SSC
were near-real-time
SSC
monitoring
using
observed
from
hydro-geological
characteristics
andsatellite
land cover
in the water-surf
value
and 0.33 for
R-Q and
respectively,
for
this
station.
However,
TC
and
parameters
α and
β.
identified
parameters
recorded
at the HN
station. The
R2 value
and 0.33 identified
ST
had smaller
correlation
results
than was
HN.0.40
An interesting
point
in these
thatβ.using
upstream
area results
using α
aisand
regionalization
scheme [18]. Once
for reflectance
R-Q and R-SSC,
for this
station.
However,
the
valuerespectively,
to predict SSC
is better
than
predictingthe
Q parameters
by R. Bothγ,the
factors
δ, a,scaling
and b are
identified through the above
TC exponents
and ST had
correlation
results
HN. An
and
in smaller
the R-SSC
equations
were than
not much
different
for the αthree
procedure,
and stations,
β in Eq.but
(3) they
can be obtained from Eqs.
did
vary
significantly
in
case
of
the
R-Q
relationship
equations.
The
R-SSC
relationship
(see SSC data. Then, Eq.
interesting point in these results is that using the reflectance (7) and (8) without using observed
Fig.
8)todisplayed
a similar
trend
all stations,
more outlier points in TC than
value
predict SSC
is better
thanfor
predicting
Q bybut
R. there
Both were
(3) could be applied for near-real-time SSC monitoring
intheHN
and ST.
scaling
factors and exponents in the R-SSC equations
0.11
0.13
0.15
Monthly reflectance, R
0.17
were not much different for the three stations, but they did
vary significantly in case of the R-Q relationship equations.
The R-SSC relationship (see Fig. 8) displayed a similar
trend for all stations, but there were more outlier points in
TC than in HN and ST.
One possible reason to explain the outlier points is the
effect of clouds. The cloud cover is different at each station
and it influences the reflectance value of the pixel where the
observation data was taken.
Inter-relationship between regression parameters
As shown in Figs. 5, 6, and 7, the relationship of L-Q,
R-SSC, and R-Q can be expressed as
using satellite observed water-surface reflectance, R, and
identified parameters α and β.
7
350
Monthly suspended sediment concentation, SSC
(g/m3)
0
0.09
300
250
200
150
100
50
0
0.09
L=aQb
(2)
SSC=αRβ
(3)
TC
Q=γR
(4)
Power (TC)
δ
Substituting Eq. (2) and Eq. (3) into Eq. (1) reveals
aQb = Q*αRβ
0.11
0.13
0.15
Monthly reflectance, R
HN
ST
Power (HN)
0.17
Power (ST)
Fig. 8. Scatter plots of the monthly mean suspended sediment
(5)
Fig.
8. Scatter plots
themonthly
monthlyreflectance,
mean suspended
sediment
concentration,
SSC, of
and
R, at the
three concentration
monthly
reflectance,
stations TC,
HN, andR,
ST.at the three stations TC, HN, and ST.
Table 2. Relationship equation and performance of regression of L-Q, Q-SS
SSC at the three stations.
Correlation
Station
September 2020 • Volume 62 Number 3
TC
Relationship
Vietnam
Journal of Science,
equation
Technology
and Engineering
7
R2
0.94
Physical Sciences | Physics, Environmental Sciences | Ecology
Table 2. Relationship equation and performance of regression of
L-Q, Q-SSC, R-Q, R-SSC at the three stations.
Correlation
L-Q
Q-SSC
R-Q
R-SSC
Station
Relationship
equation
R2
TC
L=0.23Q1.86
0.94
HN
L=1.03Q
0.82
ST
L=1.26Q
0.87
TC
Q=19.87SSC0.87
0.76
HN
Q=116.53SSC
0.37
ST
Q=75.42SSC0.86
0.43
TC
Q=1575R
0.11
HN
Q=64678R2.90
0.40
ST
Q=22716R
0.13
TC
SSC=3427.1R1.60
0.21
HN
Q=7926.8R
0.33
REFERENCES
ST
Q=2927R
0.18
[1] K. Fryirs (2013), “(Dis) Connectivity in catchment sediment
cascades: a fresh look at the sediment delivery problem”, Earth Surf.
Process. Landf., 38(1), pp.30-46, DOI: 10.1002/esp.3242.
1.55
1.49
0.66
1.19
2.23
2.38
1.92
Conclusions
This study explored the possibility of detecting a seasonal
change of suspended sediment flux by using remotely
sensed reflectance of MODIS imagery. At first, we extracted
R from MODIS (band 1, 250-m resolution, Surface Daily
L2G Global) and then analysed the relationship between
R-SSC and R-Q. We also estimated the relationship between
L-Q and Q-SSC.
The results indicate a significant relationship in L-Q
and Q-SSC and a possible connection in R-SSC and R-Q.
Although there were some error sources that affected
the accuracy of the suspended sediment and discharge
estimation, the results showed a potential of using MODIS
satellite reflectance to detect SSC in the delta region. A set
of equations that calculate the sediment depending on Q
and R was built in this study. This set has a potential for
application in other study areas where the change in Q and
R corresponds to the characteristics of each area.
The approach introduced here illustrates the possible
use of satellite images and the information of Q in SSC
monitoring in a data-poor basin. One limitation in this
study is using only R extracted from satellites, which
cannot exactly detect the value of suspended sediment
without Q data. However, a combination of other satellite
observations such as the EOMAP (Earth Observation and
Environmental Services) water quality monitoring services
and R from MODIS images can solve the problem of
monitoring suspended sediment in ungauged river basins
in future research. Moreover, using hydrological results
8
obtained from remote sensing can be used in combination
with a numerical model for a deeper understanding about
the basin.
Vietnam Journal of Science,
Technology and Engineering
ACKNOWLEDGEMENTS
The authors would like to acknowledge the University of
Yamanashi, Ministry of Education, Culture, Sports, Science
and Technology, Japan (MEXT) for supporting this study;
and Vietnam Academy for Water Resources (VAWR),
Ministry of Agriculture and Rural Development (MARD)
for providing data and information.
The authors declare that there is no conflict of interest
regarding the publication of this article.
[2] R.P.C Morgan (2005), “Soil Erosion & conservation”, European
Journal of Soil Science, 56, pp.681-687, DOI: 10.1111/j.13652389.2005.0756f.x.
[3] V. Kim, R.C. Grabowski, R.J. Rickson (2017), “Suspended
sediment transport dynamic in rivers: multi scale drivers of temporal
variation”, Earth-Science Reviews, 166, pp.38-52, DOI: 10.1016/j.
earscirev.2016.12.016.
[4] D.J. Dean, D.J. Topping, J.C. Schmidt, R.E. Griffiths, T.A.
Sabol (2016), “Sediment supply versus local hydraulic controls
on sediment transport and storage in a river with large sediment
loads”, J. Geophys. Res. Earth Surf., 121(1), pp.110-182, DOI:
10.1002/2015JF003436.
[5] A.J. Koiter, P.N. Owens, E.L. Petticrew, D.A. Lobb (2013),
“The behavioural characteristics of sediment properties and their
implications for sediment fingerprinting as an approach for identifying
sediment sources in river basins”, Earth-Science Reviews, 125, pp.2442, DOI: 10.1016/j.earscirev.2013.05.009.
[6] E. Robert, M. Grippa, L. Kergoat, S. Pinet, L. Gal, G.
Cochonneau, J.M. Martinez (2016), “Monitoring water turbidity and
surface suspended sediment concentration of the Bagre reservoir
(Burkina Faso) using MODIS and field reflectance data”, International
Journal of Applied Earth Observation and Geoinformation, 52,
pp.243-251, DOI: 10.1016/j.jag.2016.06.016.
[7] R.L. Miller, B.A. McKee (2004), “Using MODIS terra 250
m imagery to map concentration of total suspended matter in coastal
waters”, Remote Sensing of Environment, 93, pp.259-266.
[8] Z. Chen, C. Hu, K.F. Muler (2007), “Monitoring turbidity in
Tampa bay using MODIS/Aqua 250-m imagery”, Remote Sensing of
Environment, 109, pp.207-220.
[9] A.I. Dogliotti, K.G. Ruddick, B. Nechad, D. Doxaran,
E. Knaeps (2015), “A single algorithm to retrieve turbidity from
remotely-sensed data in all coastal and estuarine waters”, Remote
Sensing of Environment, 156, pp.157-168.
September 2020 • Volume 62 Number 3
Physical Sciences | Physics, Environmental Sciences | Ecology
[10] N.E. Kilham, D. Roberts (2011), “Amazon river time series
of surface sediment concentration from MODIS”, International
Journal of Remote Sensing, 32(10), pp.2659-2679, DOI:
10.1080/01431161003713044.
[11] J.E. Min, J.H. Ryu, S. Lee, S. Son (2012), “Monitoring
of suspended sediment variation using Landsat and MODIS in the
Saemangeum coastal area of Korea”, Marine Pollution Bulletin,
64(2), pp.382-390, DOI: 10.1016/j.marpolbul.2011.10.025.
[12] E. Park, E.M. Latrubesse (2014), “Modelling suspended
sediment distribution patterns of the Amazon river using MODIS
data”, Remote Sensing of Environment, 147, pp.232-242, DOI:
10.1016/j.rse.2014.03.013.
[13] M. Zhang, Q. Dong, T. Cui, C. Xue, S. Zhang (2014),
“Suspended sediment monitoring and assessment for Yellow river
estuary from Landsat TM and ETM+ imagery”, Remote Sensing of
Environment, 146, pp.136-147, DOI: 10.1016/j.rse.2013.09.033.
[14] K. Hashimoto, K. Oki (2013), “Estimation of discharges at
river mouth with MODIS image”, International Journal of Applied
Earth Observation and Geoinformation, 21, pp.276-281, DOI:
10.1016/j.jag.2012.06.008.
[15] J.D. Milliman, C. Rutkowski, M. Meybeck (1995), River
Discharge to the Sea: a Global River Index, LOICZ Core Project
Office, Texel, Netherlands, DOI: 10.13140/RG.2.1.2119.8565.
[16] V.D. Vinh, S. Ouillon, T.D. Thanh, L.V. Chu (2014), “Impact
of the Hoa Binh dam (Vietnam) on water and sediment budgets in the
Red river basin and delta”, Hydrology and Earth System Sciences,
18(10), pp.3987-4005, DOI: 10.5194/hess-18-3987-2014.
[17] T.P.Q. Le, J.A. Garnier, G. Billen, S. Thery, V.M. Chau
(2007), “The changing flow regime and sediment load of the Red
river, Viet Nam”, Journal of Hydrology, 334(1), pp.199-214, DOI:
10.1016/j.jhydrol.2006.10.020.
[18] S. Heng, T. Suetsugi (2015), “Regionalization of sediment
rating curve for sediment yield prediction in ungauged catchments”,
Hydrology Research, 46(1), pp.26-38, DOI:10.2166/nh.2013.090.
September 2020 • Volume 62 Number 3
Vietnam Journal of Science,
Technology and Engineering
9