Impact of organised cervical screening on cervical cancer incidence and mortality in migrant women in Australia
Bạn đang xem bản rút gọn của tài liệu. Xem và tải ngay bản đầy đủ của tài liệu tại đây (540.91 KB, 10 trang )
Aminisani et al. BMC Cancer 2012, 12:491
/>
RESEARCH ARTICLE
Open Access
Impact of organised cervical screening on cervical
cancer incidence and mortality in migrant
women in Australia
Nayyereh Aminisani1,2,3*, Bruce K Armstrong1, Sam Egger2 and Karen Canfell1,2
Abstract
Background: Organised cervical screening, introduced in 1991, appears to have reduced rates of cervical cancer
incidence and mortality in women in Australia. This study aimed to assess whether cervical cancer rates in migrant
women in the state of New South Wales (NSW) showed a similar pattern of change to that in Australian-born
women after 1991.
Methods: Data from the NSW Central Cancer Registry were obtained for females 15+ years diagnosed with invasive
cervical cancer from 1973 to 2008 (N=11,485). We used joinpoint regression to assess annual percent changes (APC)
in cervical cancer incidence and mortality before and after the introduction of organised cervical screening in 1991.
Results: APC in incidence fell more rapidly after than before 1991 (p<0.001) amongst women from seven groups
defined by country of birth (including Australia). There was only weak evidence that the magnitude of this
incidence change varied by country-of-birth (p=0.088). The change in APC in mortality after 1991, however, was
heterogeneous by country of birth (p=0.004). For Australian and UK or Ireland-born women the mortality APC fell
more rapidly after 1991 than before (p=0.002 and p=0.001 respectively), as it did for New Zealand, Middle East,
North Africa and Asian-born (p≥0.05), but in other European-born and women from the ’Rest of the World’ it
appeared to rise (p=0.40 and p=0.013 respectively).
Conclusions: Like Australian-born women, most, but not all, groups of migrant women experienced an increased
rate of fall in incidence of cervical cancer following introduction of organised cervical screening in 1991. An
apparent rise in mortality in women in a ‘Rest of the World’ category might be explained by a recent rise in
migration from countries with high cervical cancer incidence and mortality rates.
Background
Incidence of and mortality from cervical cancer have
generally fallen following the establishment of organised
cervical screening programs in developed countries [1].
Since the introduction of organised screening in Australia in 1991, cervical cancer incidence and mortality rates
among women 20 years of age and older have fallen substantially [2,3], by about 50% to date [4].
Cervical cancer remains one of the most common cancers in women in developing countries, and has its highest incidence in women in Sub-Saharan Africa, Central
America, South-Central Asia, and Melanesia [5]. Studies
* Correspondence:
1
School of Public Health, University of Sydney, Sydney, Australia
2
Cancer Council New South Wales, Sydney, Australia
Full list of author information is available at the end of the article
in various populations with well organised screening
programs have also documented disparities in cervical
cancer incidence and mortality between women born
overseas and native-born women [6-12]. In New South
Wales (NSW), the most populous Australian state, cervical cancer incidence among some migrant groups, notably women born in Vietnam or Fiji, is higher than in
Australian-born women [13-15]. It has been suggested
that variation in cervical screening uptake or in treatment may explain these disparities. The impact of organised screening programs on the incidence and
mortality of cervical cancer, however, has not been
assessed in different migrant groups in any country.
Thus it is not known whether women of different origins
have shared equally in the benefits of organised cervical
screening.
© 2012 Aminisani et al.; licensee BioMed Central Ltd. This is an Open Access article distributed under the terms of the Creative
Commons Attribution License ( which permits unrestricted use, distribution, and
reproduction in any medium, provided the original work is properly cited.
Aminisani et al. BMC Cancer 2012, 12:491
/>
The aim of this study was to assess whether migrant
women in Australia shared with Australian-born women
the downturn in cervical cancer incidence and mortality
that was observed following the 1991 introduction of
organised cervical screening.
Methods
Data for this study were obtained from the NSW Central
Cancer Registry (CCR), which was established in 1972
[16]. The CCR is a population-based registry supported
by a statutory obligation for all public and private hospitals, radiotherapy facilities, nursing homes, outpatient
departments and day-procedure centres to notify malignant neoplasms [16].
Women of all ages who were diagnosed with, or died
from, invasive cervical cancer in the period 1973 to 2008
and who had complete information on age and country
of birth were included in these analyses (10,820 incident
cases and 4,037 deaths). We obtained data on country of
birth, date of diagnosis, age at diagnosis, and date of
death. To calculate incidence rates, the mid-year estimated resident female population for NSW by 5 year
age group and by country of birth (COB) over the period
of study was obtained from the Australian Bureau of
Statistics (ABS) and from the Health Outcomes Information Statistical Toolkit (HOIST) which is a 'data warehouse' operated by the Centre for Epidemiology and
Research of the NSW Department of Health. Annual
population estimates by sex, age and COB were not
available before 1981, so we used estimates from the
Census populations of 1972, 1976 and 1981 for Census
years and two years either side of these years (as needed)
for annual values [17]. To correctly estimate the female
population at risk of cervical cancer, the proportion of
women who had undergone hysterectomy prior to each
year of study should be considered and removed from
the population for that year. However, we did not perform this correction in the main analyses because hysterectomy frequencies by calendar year, age and region
of birth were only collected by the NSW Admitted
Patient Data Collection from 1991 onwards. In order
to assess whether this had an impact on our findings
we performed sensitivity analysis in which hysterectomy frequencies were modelled by fitting a generalised linear model, assuming a Poisson distribution
and a log link function, to the NSW Admitted Patient
Data from 1991 to 2008. In the sensitivity analysis we
identified no substantial differences between the
results derived from the original analyses and those
derived from the hysterectomy-corrected analyses (see
Appendix).
The NSW Population and Health Services Research
Ethics Committee approved this project. De-identified
data were used for the analysis.
Page 2 of 10
Statistical analysis
Age was grouped into 5-year age groups for ageadjustment in Poisson regression and in three categories
(20–49 years, 50–69 years, and 70+ years) for the analysis of age-specific trends. Country of birth was grouped
into 7 regions [18]: Australia, New Zealand (NZ), the
United Kingdom and Ireland, rest of Europe, the Middle
East and North Africa, Asia, and the ‘Rest of the World’.
These groups were based on numbers in different country of birth categories from the 2006 Census [19] and
formed to create a manageable number of regions of
birth with reasonably large numbers and reasonable cultural homogeneity.
We used generalised linear models, assuming a Poisson distribution and a log link function, to compare the
annual percent change (APC) in cervical cancer incidence and mortality rates from 1973 to 1991 and from
1991 to 2008. Comparisons were performed for all NSW
cervical cancer cases and deaths and in subgroups
defined by region of birth and three broad age groups:
20–49 years, 50–69 years, and 70+ years. The dependent
variable in each model was either the number of newly
diagnosed cervical cancer cases or the number of cervical cancer deaths for each combination of categories of
the independent variables; with the corresponding midyear populations included as an offset. The independent
variables included categories of age (<20 years, 20–24,
25–29. . ., 80–84, 85+ years), region of birth (Australia,
New Zealand (NZ), the United Kingdom and Ireland,
rest of Europe, the Middle East and North Africa, Asia,
and the ‘Rest of the World’), calendar year of diagnosis
(1973–2008 as a continuous variable) and calendar year
of diagnosis or death for the period after the introduction of organised screening (1992–2008 or zero for years
prior to 1992, also a continuous variable). The last of
these independent variables and its corresponding
regression function parameter allows a potential change
in the APC occurring after 1991 to be modelled through
a join-point [20]. Terms for the interaction between
regions of birth, broad age group and calendar year of
diagnosis or death variables were included where appropriate to allow APCs to be estimated separately for each
subgroup. To account for possible over-dispersion, Poisson standard errors were inflated by a scale parameter
equal to the Pearson chi-squared statistic divided by the
residual degrees of freedom [21].
For graphical presentation the observed age-adjusted
cervical cancer incidence and mortality rates were plotted
against the fitted age-adjusted rates derived from the
regression models. Observed age-adjusted rates were calculated in the usual manner using observed age-specific
rates and the 1991 Australian Standard Population. Fitted
age-adjusted rates were calculated using the expected agespecific rates predicted by the estimated regression
Aminisani et al. BMC Cancer 2012, 12:491
/>
Page 3 of 10
functions. To assess whether our results were robust to
the choice of statistical method, we also performed the
same analyses using join-point weighted linear regression
models in which the log of the age-adjusted rate was
regressed against the calendar year of diagnosis or death.
Observations were weighted by the inverse of the variance
of the log of the age-adjusted rate and errors were
assumed to be auto-correlated with lag one (the use of this
method to analyse trends in age-adjusted rates is described
in detail elsewhere [22]). Because the results derived from
the weighted linear regression were almost identical to
those derived from the Poisson regression, we report only
the results from the Poisson regression. We consider the
Poisson method to have a slight technical advantage for
analysing the current data because of its ability to
handle calendar years with zero cases or deaths
whereas the weighted linear regression method
requires the introduction of a small correction factor
[23]. All data were analysed using STATA version 11
(STATA Corp, Texas USA).
Results
Descriptive characteristics of the study population
A total of 11,485 women were diagnosed with cervical
cancer between 1973 and 2008 in NSW. Of these, information on country of birth and age was available for
7,635 Australian-born women and 3,185 overseas-born
(migrant) women (Table 1). The mean ages of the
Australian-born and migrant women included in the
Table 1 Distributions by age and country of birth of
women diagnosed with and dying from cervical cancer in
NSW in 1973-2008
Mortality
Incidence
N
%
N
%
16
0.15
1
0.02
Age
<20
20-29
656
6.1
64
1.6
30-39
2118
19.6
322
8.0
40-49
2247
20.8
582
14.4
50-59
1920
17.7
742
18.4
60-69
1914
17.7
922
22.8
70+
1949
18.0
1404
34.8
Australia
7635
70.6
2953
73.1
NZ
203
1.9
52
1.3
UK& Ireland
946
8.7
384
9.5
Rest of Europe
1035
9.6
401
9.9
Middle East & North Africa
144
1.3
40
1.0
Asia
599
5.5
132
3.3
Rest of the World
258
2.4
75
1.9
Country of birth
analyses were broadly similar at 52.2 (SD=16.8) years
and 53.9 (SD=15.4) years respectively.
There were 4,049 women who died of cervical cancer
between 1973 and 2008 in NSW; of these, information
on country of birth and age was available for 2,953
Australian-born women and 1,084 overseas-born women
(Table 1). The mean ages of Australian-born and
overseas-born women dying from cervical cancer were
broadly similar at 61.6 (SD=15.9) years and 62.5
(SD=15.4) years, respectively.
There was a highly significant difference in the annual
percent changes (APC) in cervical cancer incidence and
mortality when rates before 1991 were compared with
those after the introduction of organised screening in
1991 in NSW women of all ages and countries of birth
(Figure 1, Table 2). For incidence, the APC was −2.28 up
to, and −4.67 after, 1991 (p<0.001) and for mortality it
was −2.94 up to, and −4.64 after 1991 (p=0.001).
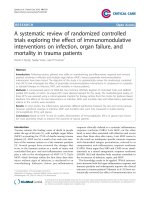
These patterns in the APC in cervical cancer incidence
before and after 1991 were also seen in women with different countries of birth (Figures 2a-g and Table 2), except in
women born in Europe (other than in UK or Ireland), who
showed a steady downtrend in incidence across the two
periods, and in women born in the ‘Rest of the World’,
who showed almost no fall in incidence after 1991,
although with a wide confidence interval. Patterns in the
APC in cervical cancer mortality were generally similar to
those in incidence except that for women born in the Rest
of the World mortality appeared to increase after 1991.
The incidence and mortality P-values for heterogeneity
among regions of birth in the change in slope after 1991
were 0.088 and 0.004, respectively.
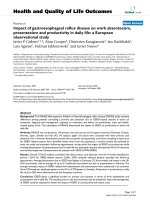
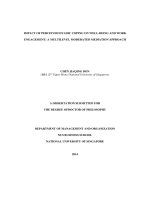
The overall trends in incidence up to and after 1991 were
also evident in the APCs in incidence for the broad age
categories 20–49 years, 50–69 years and 70+ years
(p≤0.002 in each case; Figures 1b-d and Table 2) and in the
APC in cervical cancer mortality for women aged <49
years (p<0.0001; Figure 1d). In older women, there was little difference in the APC in mortality up to and after 1991.
The incidence and mortality P-values for heterogeneity
among age groups in the change in slope after 1991 were
0.75 and 0.005 respectively. Examination of trends by age
and region of birth showed that a greater fall in the APC in
cervical cancer rates after 1991 than before was evident in
most age and country of birth categories (Table 2). At
40–49 years of age, it was seen for incidence in six of seven
regions of birth and for mortality in five of seven. At
50–69 years of age it was seen for incidence in five of seven
and for mortality in four of seven and at 70+ years of age
for incidence in 6 of 7 and in mortality for five of seven.
Discussion
As has been reported previously [2,3], organised cervical
screening from 1991 was apparently effective in increasing
Aminisani et al. BMC Cancer 2012, 12:491
/>
40
APC2=-6.16 (-7.58, -4.72)
20
APC2=-4.79 (-5.48, -4.09)
Mortality: APC1=-1.26 (-2.46, -0.05)
10
10
5
2
Incidence: APC1=-2.15 (-2.73, -1.57)
5
APC2=-4.62 (-5.24, -4.00)
Age-Adjusted Rate Per 100,000
40
APC2=-4.67 (-5.12, -4.23)
Mortality: APC1=-2.94 (-3.46, -2.43)
20
Incidence: APC1=-2.28 (-2.66, -1.91)
49 years of age
0
2
b
All ages
0
Age-Adjusted Rate Per 100,000
a
Page 4 of 10
1975
1980
1985
1990
1995
2000
2005
1975
1980
1985
1990
Year
Incidence: Observed
Mortality: Observed
Fitted
Fitted
Incidence: Observed
Mortality: Observed
Tests of APC1=APC2: P(incidence)<0.0001, P(mortality)=0.0011
2005
Fitted
Fitted
40
APC2=-4.21 (-5.34, -3.07)
20
APC2=-4.12 (-5.16, -3.07)
Mortality: APC1=-2.74 (-3.75, -1.72)
10
10
5
0
2
Incidence: APC1=-1.26 (-2.26, -0.26)
5
APC2=-4.11 (-5.23, -2.99)
Age-Adjusted Rate Per 100,000
APC2=-4.92 (-5.72, -4.11)
Mortality: APC1=-4.03 (-4.90, -3.15)
20
Incidence: APC1=-2.85 (-3.50, -2.20)
70+ years of age
2
d
50-69 years of age
40
2000
Tests of APC1=APC2: P(incidence)<0.0001, P(mortality)<0.0001
0
Age-Adjusted Rate Per 100,000
c
1995
Year
1975
1980
1985
1990
1995
2000
2005
Incidence: Observed
Mortality: Observed
1975
1980
1985
1990
1995
2000
2005
Year
Year
Fitted
Fitted
Tests of APC1=APC2: P(incidence)=0.0018, P(mortality)=0.92
Incidence: Observed
Mortality: Observed
Fitted
Fitted
Tests of APC1=APC2: P(incidence)=0.0020, P(mortality)=0.13
Figure 1 Trends in age-adjusted cervical cancer incidence and mortality by broad age categories in NSW women, 1973–2008(APC1:
annual percent change from 1973-1991, APC2: annual percent change from 1991-2008).
the rate of fall in cervical cancer incidence and mortality
in NSW women. We observed this pattern in both incidence and mortality in women born in Australia, New
Zealand, the United Kingdom and Ireland, Asia and the
Middle East and North Africa. For women born in Europe
(other than the United Kingdom and Ireland) and the
‘Rest of the World’, however, there was no evidence of an
increase in the rate of fall in incidence after 1991 and for
women born in the Rest of the World mortality from cervical cancer may have increased after 1991.
While we did not attempt to relate the observed
downtrends up to 1991 to change in cervical screening
during this period, opportunistic screening and better
treatment probably increased following the introduction
of universal health insurance in 1975 with reimbursement of the cost of cervical cytology and access free-ofcharge to treatment of cervical cancer precursors and
cervical cancer itself. Changes in sexual behaviour might
also have influenced these and the later trends. There is
evidence from studies both in and outside Australia that
mortality from cervical cancer in young women was
increasing just before or early in the study period
[24-27] due, perhaps, to the changes in sexual mores
that occurred during and after the Second World War.
These changes might have kept cervical cancer incidence
and mortality rates higher in the first part of the period
than they would otherwise have been. It is possible, also,
that increasing condom use after the beginning of the
epidemic of HIV infection during the 1980s [28] could
have contributed to the downtrends in the 1990s. In
addition, it is possible that the observed trends may have
been influenced by differential exposure over time and
between various groups of migrant women to the established co-factors of human papillomavirus (HPV) infection (parity, age at first full term pregnancy, use of
tobacco and oral contraceptives) The very small fall in
incidence and the increase in mortality from cervical
cancer in women from the Rest of the World after 1991
may reflect recent changes in patterns of migration to
Australia. Many women classified as from the ‘Rest of
the World’ have come from African and Latin America
countries where cervical cancer is very common [5]. The
Aminisani et al. BMC Cancer 2012, 12:491
/>
Page 5 of 10
Table 2 Annual percent change (APC) in age-adjusted cervical cancer incidence and mortality by region of birth and
broad age categories before and after organised screening in NSW
Age group
Region of birth
APC (95%CI) incidence trends
APC (95%CI) mortality trends
Up to organised
screening
After organised
screening
P value
Up to organised
screening
After organised
screening
P value
All regions
−2.28(−2.66,-1.91)
−4.67(−5.12, -4.23)
<0.0001
−2.94(−3.46,-2.43)
−4.62(−5.24,-4.00)
0.0011
0.0024
All ages
Australia
−2.25(−2.68,-1.81)
−4.81(−5.34,-4.27)
<0.0001
−2.80(−3.39,-2.20)
−4.64(−5.37,-3.90)
New Zealand
−1.60(−4.58,1.46)
−5.06(−7.95,-2.08)
0.20
−0.09(−5.26,5.37)
−4.42(−9.15,0.56)
0.35
United Kingdom/Ireland
−1.86(−3.09,-0.61)
−4.14(−5.68,-2.57)
0.073
−2.28(−3.87,-0.66)
−7.91(−10.16,-5.60)
0.0014
Rest of Europe
−3.40(−4.57,-2.21)
−3.47(−4.93,-1.99)
0.95
−4.68(−6.30,-3.03)
−3.30(−5.22,-1.33)
0.40
Middle East/North Africa
−2.36(−5.72,1.12)
−8.49(−11.99,-4.85)
0.050
0.34(−6.52,7.69)
−2.99(−8.06,2.37)
0.55
Asia
−1.45(−3.69,0.84)
−6.39(−7.91,-4.85)
0.0033
−0.85(−5.04,3.52)
−6.52(−9.26,-3.71)
0.069
Rest of the World
−2.45(−5.48, 0.67)
−0.39(−2.82, 2.11)
0.41
−7.51(−11.70,-3.13)
2.11(−1.92, 6.31)
0.013
≤49 years of age
−2.15(−2.73,-1.57)
−4.79(−5.48,-4.09)
<0.0001
−1.26(−2.46,-0.05)
−6.16(−7.58,-4.72)
<0.0001
Australia
−2.11 (−2.75, -1.47)
−5.00 (−5.78, -4.21)
<0.0001
−0.80 (−2.17, 0.60)
−6.16 (−7.80, -4.50)
<0.0001
New Zealand
−3.42 (−7.33, 0.65)
−3.77 (−7.56, 0.17)
0.92
−1.92 (−11.54, 8.74)
−4.76 (−13.37, 4.70)
0.74
0.34 (−1.84,2.57)
−3.48(−5.99, -0.90)
0.074
3.90 (−1.23, 9.29)
−12.60 (−19.03, -5.66)
0.0020
−1.52 (−3.38, 0.36)
−4.09 (−6.81, -1.30)
0.22
−4.60 (−8.02, -1.04)
−2.23 (−7.55, 3.40)
0.56
Middle East/North Africa −5.76 (−10.26, -1.03) −9.96 (−16.17, -3.30)
All regions
United Kingdom/Ireland
Rest of Europe
0.40
15.21 (−3.09, 36.97)
−27.35 (−43.13, -7.19)
0.0092
Asia
−3.67 (−6.74, -0.49)
−4.45 (−6.69, 2.16)
0.74
−4.15 (−11.54, 3.86)
−4.79 (−10.27, 1.04)
0.91
Rest of the World
−1.26 (−5.57,3.25)
−0.05 (−3.40, 3.41)
0.73
−10.06 (−17.43, -2.04)
1.80 (−6.50, 10.83)
0.12
50-69 years of age
All regions
Australia
−4.92(−5.72,-4.11)
0.0018
−4.03(−4.40,-3.15)
−4.11(−5.23,-2.99)
0.92
−5.04 (−6.00, -4.06)
0.0056
−3.91 (−4.92, -2.90)
−4.11 (−5.45, -2.76)
0.85
2.41 (−3.80, 9.03)
−8.61(−14.27,-2.58)
0.046
1.86 (−8.60, 13.52)
−1.05 (−9.34, 7.99)
0.75
United Kingdom/Ireland
−3.89 (−5.86, -1.88)
−4.75 (−7.44,-2.00)
0.69
−4.34 (−7.17, -1.43)
−7.83 (−12.13, -3.32)
0.29
Rest of Europe
0.51
New Zealand
70+ years of age
−2.85(−3.50,-2.20)
−2.88 (−3.62, -2.14)
−5.61 (−7.34, -3.85)
−3.57 (−5.75, -1.33)
0.26
−5.90 (−8.49, -3.24)
−4.11 (−7.44, -0.66)
Middle East/North Africa
2.84 (−3.57, 9.68)
−9.13 (−13.99,-4.01)
0.019
−5.63 (−16.11, 6.16)
4.39 (−4.54, 14.16)
0.29
Asia
0.26 (−3.30, 3.97)
−8.88 (−11.31, -6.38)
0.0007
1.80 (−5.27, 9.40)
−9.59 (−14.18, -4.75)
0.031
Rest of the World
−4.69 (−9.43, 0.30)
−1.14 (−5.28, 3.18)
0.40
−3.45 (−10.84, 4.54)
0.22 (−5.73, 6.53)
0.56
All regions
−1.26(−2.26,-0.26)
−4.12(−5.16,-3.07)
0.0020
−2.74(−3.75,-1.72)
−4.21(−5.34,-3.07)
0.13
Australia
−1.27 (−2.37, -0.14)
−4.11 (−5.30, -2.91)
0.0065
−2.75 (−3.92, -1.57)
−4.19 (−5.51, -2.84)
0.21
New Zealand
−1.88 (−9.04, 5.85)
−4.37 (−12.37, 4.35)
0.73
0.47 (−9.22, 11.19)
−12.94 (−25.31, 1.47)
0.20
United Kingdom/Ireland
−1.67 (−4.09, 0.81)
−4.19 (−7.17,-1.11)
0.31
−2.42 (−4.99, 0.21)
−6.55 (−10.04, -2.94)
0.14
0.77
Rest of Europe
−3.78 (−7.29, -0.14)
−2.26 (−5.46, 1.06)
0.62
−2.70 (−6.50, 1.25)
−3.65 (−7.00, -0.17)
Middle East/North Africa
−2.44 (−11.98, 8.13)
−8.79 (−17.36, 0.66)
0.46
−2.49 (−15.91,13.08)
−1.58 (−11.69, 9.70)
0.94
Asia
9.27 (−0.66, 20.19)
−9.39 (−13.44, -5.16)
0.0026
0.36 (−10.20, 12.17)
−4.50 (−10.30, 1.67)
0.52
Rest of the World
0.59 (−9.91, 12.32)
−1.66 (−8.99, 6.26)
0.79
−10.83 (−20.67,0.24)
4.86 (−5.73, 16.62)
0.12
numbers of migrants from these areas have increased in
the last two decades [29,30]. Thus the apparently less
favourable trend in incidence and the unfavourable trend
in mortality in this migrant group may reflect the high
cervical cancer incidence and mortality of their home region, which would be expected to persist for some time
after coming to Australia.
No previous study has examined trends in cervical
cancer incidence and mortality in migrant women in
Australia. While a number of international studies in
diverse populations have documented disparities in cervical cancer incidence and mortality between migrant
women and native-born women or women of different
ethnic backgrounds [6-12], only a few have examined
Aminisani et al. BMC Cancer 2012, 12:491
/>
Page 6 of 10
e Middle East and North Africa
Incidence: APC1=-2.36 (-5.72, 1.12)
40
10
20
APC2=-2.99 (-8.06, 2.37)
5
10
5
2
APC2=-8.49 (-11.99, -4.85)
Mortality: APC1=0.34 (-6.52, 7.69)
0
2
APC2=-4.64 (-5.37, -3.90)
Age-Adjusted Rate Per 100,000
40
APC2=-4.81 (-5.34, -4.27)
Mortality: APC1=-2.80 (-3.39, -2.20)
20
Incidence: APC1=-2.25 (-2.68, -1.81)
0
Age-Adjusted Rate Per 100,000
a Australia
1975
1980
1985
1990
1995
2000
2005
1975
1980
1985
1990
Year
Incidence: Observed
Mortality: Observed
Fitted
Fitted
Incidence: Observed
Mortality: Observed
Tests of APC1=APC2: P(incidence)<0.0001, P(mortality)=0.0024
Fitted
Fitted
40
APC2=-6.52 (-9.26, -3.71)
10
20
APC2=-6.39 (-7.91, -4.85)
Mortality: APC1=-0.85 (-5.04, 3.52)
5
10
5
Incidence: APC1=-1.45 (-3.69, 0.84)
0
2
APC2=-7.91 (-10.16, -5.60)
Age-Adjusted Rate Per 100,000
40
Mortality: APC1=-2.28 (-3.87, -0.66)
20
APC2=-4.14 (-5.68, -2.57)
2
Age-Adjusted Rate Per 100,000
2005
f Asia
Incidence: APC1=-1.86 (-3.09, -0.61)
0
1975
1980
1985
1990
1995
2000
1975
2005
1980
1985
1990
Incidence: Observed
Mortality: Observed
Incidence: Observed
Mortality: Observed
Fitted
Fitted
2000
2005
Fitted
Fitted
Tests of APC1=APC2: P(incidence)=0.0033, P(mortality)=0.069
Tests of APC1=APC2: P(incidence)=0.073, P(mortality)=0.0014
c New Zealand
g Rest of the World
Incidence: APC1=-2.45 (-5.48, 0.67)
10
5
2
40
20
APC2=2.11 (-1.92, 6.31)
0
0
APC2=-0.39 (-2.82, 2.11)
Mortality: APC1=-7.51 (-11.70, -3.13)
10
APC2=-4.42 (-9.15, 0.56)
5
Mortality: APC1=-0.09 (-5.26, 5.37)
2
APC2=-5.06 (-7.95, -2.08)
Age-Adjusted Rate Per 100,000
Incidence: APC1=-1.60 (-4.58, 1.46)
20
40
1995
Year
Year
Age-Adjusted Rate Per 100,000
2000
Tests of APC1=APC2: P(incidence)=0.050, P(mortality)=0.55
b UK& Ireland
1975
1980
1985
1990
1995
2000
2005
Year
Incidence: Observed
Mortality: Observed
Fitted
Fitted
40
APC2=-3.30 (-5.22, -1.33)
0
2
5
10
20
APC2=-3.47 (-4.93, -1.99)
Mortality: APC1=-4.68 (-6.30, -3.03)
1985
1990
1995
Year
Incidence: Observed
Mortality: Observed
Tests of APC1=APC2: P(incidence)=0.95, P(mortality)=0.40
Figure 2 (See legend on next page.)
1985
1990
Tests of APC1=APC2: P(incidence)=0.41, P(mortality)=0.013
Incidence: APC1=-3.40 (-4.57, -2.21)
1980
1980
Incidence: Observed
Mortality: Observed
d Rest of Europe
1975
1975
1995
Year
Tests of APC1=APC2: P(incidence)=0.20, P(mortality)=0.35
Age-Adjusted Rate Per 100,000
1995
Year
Fitted
Fitted
2000
2005
Fitted
Fitted
2000
2005
Aminisani et al. BMC Cancer 2012, 12:491
/>
Page 7 of 10
(See figure on previous page.)
Figure 2 Trends in age-adjusted cervical cancer incidence and mortality in all ages by region of birth in NSW women, 1973–2008APC1:
annual percent change from1973-1991, APC2: annual percent change from 1991-2008.
time trends in cervical cancer incidence or mortality by
ethnic background or country of birth.
A New Zealand study [31] examined trends in cancer
incidence from 1981–1986 to 2002–2004 in four groups
defined by ethnicity or country of birth: Maori, Pacific
Islander, Asian and European or Other. The investigators found that, compared to European or Other women,
Maori, Pacific Islander, and Asian women had higher
incidence rates of cervical cancer in 2002–2004. The age
standardised incidence rate ratio (SRR) comparing Maori
and Pacific Islander women with European/Other
women fell with time, which suggests a greater rate of
fall in Maori and Pacific Islander than European/Other
women. However, the SRR for Asian women increased
with time. While New Zealand introduced organised cervical screening in 1991, this report did not compare
trends before and after this date.
McDougall et al. [6] examined trends in incidence of
cervical cancer by ethnicity in the US between 1992 and
2003 based on information from the 13 cancer registries.
They found similar falls in incidence of cervical cancer
overall and in squamous cell carcinoma in four different
ethnic groups: Non-Hispanic whites, Hispanic whites,
African-American, and Asian or Pacific Islander, over
the period of study. However falls were more pronounced among Asian or Pacific Islanders. A second US
study [8], examined cervical cancer incidence trends in
four categories: Hispanic/all races, Non-Hispanic/white,
non-Hispanic/black, non-Hispanic/other using a dataset
from 22 state cancer registries. Incidence of cervical cancer was significantly less in all four race/ethnic groups in
2000–2004 than 1995–1999 (rate ratio 0.83, 95% CI
0.82-0.84), with standardized rate ratios ranging from
0.75 (95% CI 0.70-0.79) for Non-Hispanic/other to 0.84
(95% CI 0.82-0.85) for non-Hispanic/white. A third US
study examined the incidence and mortality of cervical
cancer among Asian and non-Hispanic white women in
California in 1990 to 2004. Cervical cancer incidence
and mortality fell in each group during this period. The
APCs in the rates were −8.7% for Vietnamese, -5.1%
among Koreans, -4.6% among Filipinos, -5.4% for Chinese and −2.3% among non-Hispanic Whites [10]. None
of these studies related the trends in incidence or mortality with trends in cervical screening, which is largely
opportunistic in the USA.
When examined in broad age categories, there was less
evidence in older than younger NSW women that mortality fell faster after 1991 than it did up to 1991. This age
group difference could be due to less screening [32-34]
or less effective screening in older women [35] after
1991, although the first should also affect incidence
trends. We have no reason to think that older women
treated for cervical pre-neoplasia or cancer would have
received poorer treatment after 1991 than before. However, it is important to note that the optimal interval
for screening is longer in women over 50 years [1]
when compared to younger women, and it has previously been proposed that apparently greater effects of
opportunistic screening in older women could be partly
due to the greater efficacy of irregular screening in
older than younger women [3].
Our findings are based on 36 years of data from a high
quality cancer registry covering a large population. The
period for which cancer registry data was available
included 18 years before the year of introduction of
organised cervical screening program (1991) and 17
years after; thus trends before and after introduction of
an organised approach could be modelled with considerable precision in a range of groups of migrant women.
We analysed trends in cervical cancer rates in relation
to country of birth, but we did not have individual-level
data on the age of migration, and therefore could not explicitly account for prior screening experience in the
country of origin. However, cytological screening in
women aged 20–24 years has been shown to have little
or no impact on rates of invasive cervical cancer up to
age 30 years [36], and therefore any effects of premigration screening for women who migrated as children or young adults are expected to be very limited.
Even for women who migrated at ages older than 25
years, the results of a major audit and case–control
study in the UK (a study which underpins IARC’s 2005
recommendations for the cervical screening interval) [1],
found that the relative risk of invasive cancer in screened
women dropped to the same level as that of unscreened
women after 3.5 years in women younger than 50 years,
and after 5–6 years in women over 50 years of age [37].
In effect, the cytological screening effect ‘wears off’ relatively rapidly which is why frequent repeated screening
is required with cytology. Therefore, it is unlikely that
screening history before migration would have a major
impact on the trends observed in this study.
We were unable to adjust for hysterectomy over the
whole analysis period because hysterectomy frequencies
by calendar year, age and region of birth were only collected by the NSW Admitted Patient Data Collection
from 1991 onwards. However, we conducted sensitivity
analyses using the NSW Admitted Patient Data to
Aminisani et al. BMC Cancer 2012, 12:491
/>
correct the populations at risk for hysterectomies and
found very similar results to those in the main analysis.
In addition, the age adjusted hysterectomy incidence
rates in women 20-85+ years of age, estimated from the
NSW Admitted Patient Data Collection [38], were stable
from 1991 to 1997 and then fell steadily in all country of
birth groups from 5.2/1,000 (Australian born) to 3.0/
1,000 (Asian born) in1997 to a half to two-thirds of the
1997 values (3.1/1,000 in Australian born to 1.7/1,000 in
Asian born) in 2008 (data not shown). The effect of
these trends would be to reduce the observed rate of fall
in cervical cancer rates in all country of birth groups in
the later part of the period following introduction of
organised screening. This effect, though, would be
greater in older than younger women and thus might
comprise part of the explanation of the less evident
increase in the downtrends in cervical cancer incidence
and mortality in older women after 1991 (Figures 1b-d).
We were, in addition, not able address possible confounding of trends by country of birth by, for example,
trends by socioeconomic status and area of residence. Information on socioeconomic status based on the Australian
Bureau of Statistics Index of Relative Socioeconomic
Disadvantage (IRSD) was not available from the CCR
for years before 1980 and classification of area of residence based on Accessibility and Remoteness Index for
Areas (ARIA) was only available from 2000. Neither of
these, however, would be expected to have had much of
a confounding effect. There were only small differences
in the distributions of IRSD between Australian-born
and migrant women studied from 1980 and the vast
bulk of both Australian born and migrant women studied from 2000 resided in major city or inner regional
areas (89.8% and 98.0% respectively).
Finally, it should be noted that rates of invasive cervical cancer incidence and mortality in Australia nationally appear to have stabilised since about 2002 [39];
reductions prior to that time have been predominately
driven by declines in invasive squamous cervical cancer,
whereas the incidence of adenocarcinoma (glandular
cancers) appears not to have been substantially impacted
by cytological-based screening. This stabilisation effect
may have resulted in our calculated average annual percent changes from 1991 to 2008 being slightly lower
than if rates had not stabilised over the last 5 years of
the period included in our assessment. However, in this
study we have taken a broad approach to assessing the
overall changes in rates after the period of interest, and
focused mainly on the differentials between various
groups of migrant women. We have identified some
groups of migrant women from certain European and
other countries that may be able to benefit, to a greater
degree, from the organised cervical screening program
in Australia. In the context of a current review of
Page 8 of 10
cervical screening recommendations and technology in
Australia [40], further reductions in invasive cervical
cancer incidence and mortality rates could also potentially be achieved in the population overall by switching
to a primary screening test which is potentially more effective in detecting adenocarcinoma, such as primary HPV
DNA-based screening. In the longer term, the National
HPV Vaccination Program, introduced in Australia in
1997, also has the potential to further reduce rates of cervical cancer in all Australian women [41].
Conclusions
As has been the case for Australian-born women, most
categories of migrant women experienced an increased
rate of fall in incidence of cervical cancer following
introduction of organised cervical screening in 1991.
Most, but not all, also experienced an increased rate of
fall in cervical cancer mortality. An apparent rise in
mortality in women in a ‘Rest of the World’ category
may be explained by a recent rise in migration from
countries with high cervical cancer incidence and mortality rates.
Appendix. Sensitivity analysis for the effect of
hysterectomy rates
To correctly estimate the female population at risk of
cervical cancer, women who had undergone hysterectomy should be excluded from the population at risk for
that year. However, we did not perform this correction
in the main analyses because hysterectomy frequencies
by calendar year, age and region of birth were only collected by the NSW Admitted Patient Data Collection
from 1991 onwards. However, we conducted sensitivity
analyses using the NSW Admitted Patient Data to correct the populations at risk for the effect of hysterectomy. Hysterectomy frequencies were modelled using
methods specified in detail elsewhere [42]. In brief, this
involved fitting a generalised linear model assuming a
Poisson distribution and a log link function to the NSW
Admitted Patient Data from 1991 to 2008. The
dependent variable in the model was the number of new
hysterectomies for each combination of categories of the
independent variables with the corresponding mid-year
populations included as an offset. The independent variables included categories of age (20–24, 25–29. . .,
80–84, 85+ years; it was assumed that hysterectomies did
not occur at <20 years of age), region of birth (Australia,
New Zealand (NZ), the United Kingdom and Ireland,
rest of Europe, the Middle East and North Africa, Asia,
and the rest of the world), calendar year of diagnosis (1991–2008 as a continuous variable) and 18 birth
cohorts (1888-1978+ as continuous variable with linear
and quadratic terms). Age, year of diagnosis and birth
cohort effects were modelled specific to each region of
Aminisani et al. BMC Cancer 2012, 12:491
/>
birth through the inclusion of appropriate interaction
terms. The estimated regression equation was then used
to predict hysterectomy rates within and beyond the
range of observed values of the independent variables so
as to provide predicted hysterectomy rates for the diagnosis years 1973–2008. For each region of birth, year of
diagnosis and birth cohort, the predicted rates were
converted to cumulative probabilities of having an intact
uterus and cervix at age x using the cumulative risk formula Px = exp(Σi = 1x − 5ri) where Px is the cumulative
probability at age x and ri is the predicted hysterectomy
rate at age i. This formula accounts for the sequential removal of women who have previously had hysterectomies from the population at risk of the procedure [42,43].
Hysterectomy-corrected populations at risk were then
calculated by multiplying the cumulative probabilities
of having an intact uterus and cervix by the corresponding
all-women populations. The main analyses of cervical
cancer trends were then re-executed after replacing the
all-women populations with the hysterectomy-corrected
populations.
Additional file 1: Figure S1 indicates that the modelled
age-standardised hysterectomy rates (using 1991
Australian Standard Population) were good predictors of
the empirical age-standardised rates for the years of
diagnosis for which data were available (1991–2008).
Additional file 1: Figures S2(a-c) and S3(a-g) show that
no substantial differences were observable between the
results derived from the original analyses and those
derived from the hysterectomy-corrected analyses.
Additional file
Additional file 1: Figure S1. Trends in age standardised hysterectomy
rates by region of birth in NSW women, 1973–2008. Modelled and
empirical rates using hysterectomy-corrected populations as
denominators. Figure S2- Trends in age-adjusted cervical cancer
incidence and mortality by broad age categories in NSW women,
1973–2008. Fig S2a All ages. Fig S2b ≤49 years of age. Fig S2c 50–69
years of age. Fig S2d 70+ years of age. Figure S3- Trends in agecorrected cervical cancer incidence and mortality in all ages by region of
birth in NSW women, 1973–2008. Fig S3a Australia. Fig S3b UK& Ireland.
Fig S3c New Zealand. Fig S3d Rest of Europe. Fig S3e Middle East and
North Africa. Fig S3f Asia. Fig S3g Rest of the world.
Competing interests
The authors declare that they have no competing interests.
Authors’ contributions
Authors’ contribution: All authors were involved in design of the protocol
and preparation of the Human Research Ethics Committee application. NA
and SE were responsible for data analysis and SE performed the sensitivity
analysis. NA and SE prepared drafts of the manuscript. BA and KC supervised
and supported data analysis. All authors contributed to all drafts of the
manuscript, including the final one. All authors read and approved the final
manuscript.
Acknowledgements
The authors gratefully acknowledge the NSW Department of Health, the
Cancer Institute NSW, and the Central Cancer Registry. We gratefully thank
Page 9 of 10
Narelle Grayson at the Central Cancer Registry, Cancer Institute NSW for her
assistance. We also thank Freddy Sitas of the Cancer Council NSW for his
support and assistance. This study was funded by a PhD scholarship from
the Health Ministry of Iran, the University of Sydney and Cancer Council
NSW, for which the authors are thankful.
Author details
School of Public Health, University of Sydney, Sydney, Australia. 2Cancer
Council New South Wales, Sydney, Australia. 3Faculty of Health and Nutrition,
Tabriz University of Medical Sciences, Tabriz, Iran.
1
Received: 18 June 2012 Accepted: 8 October 2012
Published: 23 October 2012
References
1. IARC: Handbook of Cancer Prevention, Cervix Cancer Screening.
The International Agency for Research on Cancer 2005, 10:201–212.
2. Taylor R, Morrell S, Mamoon H, Wain G, Ross J: Decline in cervical cancer
incidence and mortality in New South Wales in relation to control
activities (Australia). Cancer Causes Control 2006, 17(3):299–306.
3. Canfell K, Sitas F, Beral V: Cervical cancer in Australia and the United
Kingdom: comparison of screening policy and uptake, and cancer
incidence and mortality. Med J Aust 2006, 185(9):482–486.
4. Australian Institute of Health and Welfare: Australian Cancer Incidence and
Mortality (ACIM) books. Canberra: Australian Institute of Health and Welfare; 2011.
5. Jemal A, Bray F, Center MM, Ferlay J, Ward E, Forman D: Global cancer
statistics. CA Cancer J Clin 2011, 61(2):69–90.
6. McDougall JA, Madeleine MM, Daling JR, Li CI: Racial and ethnic disparities
in cervical cancer incidence rates in the United States, 1992–2003.
Cancer Causes Control 2007, 18(10):1175–1186.
7. Downs LS, Smith JS, Scarinci I, Flowers L, Parham G: The disparity of cervical
cancer in diverse populations. Gynecol Oncol 2008, 109(2 Suppl):S22–30.
8. Barnholtz-Sloan J, Patel N, Rollison D, Kortepeter K, MacKinnon J, Giuliano A:
Incidence trends of invasive cervical cancer in the United States by
combined race and ethnicity. Cancer Causes Control 2009, 20(7):1129–1138.
9. Wang SS, Carreon JD, Gomez SL, Devesa SS: Cervical cancer incidence
among 6 asian ethnic groups in the United States, 1996. Cancer 2004,
116(4):949–956.
10. Bates JH, Hofer BM, Parikh-Patel A: Cervical cancer incidence, mortality,
and survival among Asian subgroups in California, 1990–2004. Cancer
2008, 113(10 Suppl):2955–2963.
11. Patel NR, Rollison DE, Barnholtz-Sloan J, Mackinnon J, Green L, Giuliano AR:
Racial and ethnic disparities in the incidence of invasive cervical cancer
in Florida. Cancer 2009, 115(17):3991–4000.
12. McDermott S, Desmeules M, Lewis R, Gold J, Payne J, Lafrance B, Vissandjee B,
Kliewer E, Mao Y: Cancer incidence among Canadian immigrants, 1980–1998:
results from a national cohort study. J Immigr Minor Health 1998, 13(1):15–26.
13. Kricker A, Bell J, Coates M, Talor R, Armstrong BK: Cancer of the cervix in NSW
in 1972 to 1992. NSW Cancer Council: Cancer Epidemiology Unit; 1996.
14. McCredie M, Coates M, Duque-Portugal F, Smith D, Talor R: Common
cancers in migrants to New South Wales 1972–1990. NSW Cancer Council,
Sydney: Cancer Epidemiology Research Unit and NSW Central Cancer
Registry; 1993.
15. Supramaniam R, O’Conell D, Tracy E, Sitas F: Cancer incidence in New South
Wales migrants 1991 to 2001. Sydney: NSW Cancer Council; 2006.
16. NSW Central Cancer Registry. Cancer Institute NSW; http://www.
cancerinstitute.org.au/data-and-statistics/cancer-registries/nsw-centralcancer-registry.
17. Australian Bureau of Statistics (ABS): 1971, 1976, 1981 census of population
and housing NSW by country of birth, age, and gender. Canberra:
Commonwealth of Australia; 2011.
18. Australian Bureau of Statistics: Standard Australian Classification of Countries
(SACC), Edition, cat. no. 1269.0. Canberra: ABS; 2008.
19. Australian Bureau of Statistics: 2006 census of population and housing,
New South Wales by country of birth by age and by gender. Canberra:
Commonwealth of Australia; 2011.
20. Kim HJ, Fay MP, Feuer EJ, Midthune DN: Permutation tests for joinpoint
regression with applications to cancer rates. Stat Med 2000, 19(3):335–351.
21. McCullagh P, Nedler J: Generalized Linear Models. London: Chapman&Hall; 1989.
Aminisani et al. BMC Cancer 2012, 12:491
/>
Page 10 of 10
22. Jensen O, Parkin D, MacLennan R, Muir C, Skeet R: Cancer registration;
Principles and Methods. IARC Scientific Publications No 95. Lyon:
International Agency for Research on Cancer; 1991.
23. Tiwari RC, Clegg LX, Zou Z: Efficient interval estimation for age-adjusted
cancer rates. Stat Methods Med Res 2006, 15(6):547–569.
24. Armstrong B, Holman D: Increasing mortality from cancer of the cervix in
young Australian women. Med J Aust 1981, 1(9):460–462.
25. Cox B, Skegg DC: Trends in cervical cancer in New Zealand. N Z Med J
1986, 99(812):795–798.
26. Hill GB, Adelstein AM: Cohort mortality from carcinoma of the cervix.
Lancet 1967, 2(7516):605–606.
27. Beral V: Cancer of the cervix: a sexually transmitted infection?
Lancet 1974, 1(7865):1037–1040.
28. Tanaka M, Nakayama H, Sakumoto M, Matsumoto T, Akazawa K, Kumazawa
J: Trends in sexually transmitted diseases and condom use patterns
among commercial sex workers in Fukuoka City, Japan 1990–93.
Genitourin Med 1996, 72(5):358–361.
29. Australian Bureau of Statistics: Characteristics of Recent Migrants, Australia,
cat.no, 6250.0. Canberra: ABS; 2010.
30. Australian Bureau of Statistics 2008: Perspectives on migrants. Canberra: ABS;
2008. cat.no. 3416.0.
31. Blakely T, Shaw C, Atkinson J, Cunningham R, Sarfati D: Social inequalities
or inequities in cancer incidence? Repeated census-cancer cohort
studies, New Zealand 1981–1986 to 2001–2004. Cancer Causes Control
2011, 22(9):1307–1318.
32. Lofters AK, Moineddin R, Hwang SW, Glazier RH: Predictors of low cervical
cancer screening among immigrant women in Ontario. Canada.
BMC Womens Health 2011, 11:20.
33. Lofters AK, Moineddin R, Hwang SW, Glazier RH: Low rates of cervical
cancer screening among urban immigrants: a population-based study in
Ontario, Canada. Med Care 2010, 48(7):611–618.
34. Gakidou E, Nordhagen S, Obermeyer Z: Coverage of cervical cancer
screening in 57 countries: low average levels and large inequalities. PLoS
Med 2008, 5(6):e132.
35. Gustafsson L, Sparen P, Gustafsson M, Pettersson B, Wilander E, Bergstrom R,
Adami HO: Low efficiency of cytologic screening for cancer in situ of the
cervix in older women. Int J Cancer 1995, 63(6):804–809.
36. Sasieni P, Castanon A, Cuzick J: Effectiveness of cervical screening with
age: population based case–control study of prospectively recorded
data. BMJ 2009, 339:b2968.
37. Sasieni P, Adams J, Cuzick J: Benefit of cervical screening at different
ages: evidence from the UK audit of screening histories. Br J Cancer 2003,
89(1):88–93.
38. Australian Bureau of Statistics: NSW Health Department Admitted Patient
Data Collection. Canberra: New South Wales Regional Statistics, 2007; 2007.
Cat.no.1368.1.
39. Cervical screening in Australia 2009–2010, Cancer series no. 67. Cat. no. CAN 63;
/>40. National Cervical Screening Program Renewal; cerscreening.
gov.au/internet/screening/publishing.nsf/Content/ncsp-renewal.
41. The National Human Papillomavirus (HPV) Vaccination Program Register;
/>42. Taylor R, Rushworth RL: Hysterectomy fractions in New South Wales,
1971–2006. Aust N Z J Public Health 1998, 22(7):759–764.
43. Schouten LJ, Straatman H, Kiemeney LA, Verbeek AL: Cancer incidence:
life table risk versus cumulative risk. J Epidemiol Community Health 1994,
48(6):596–600.
doi:10.1186/1471-2407-12-491
Cite this article as: Aminisani et al.: Impact of organised cervical
screening on cervical cancer incidence and mortality in migrant women
in Australia. BMC Cancer 2012 12:491.
Submit your next manuscript to BioMed Central
and take full advantage of:
• Convenient online submission
• Thorough peer review
• No space constraints or color figure charges
• Immediate publication on acceptance
• Inclusion in PubMed, CAS, Scopus and Google Scholar
• Research which is freely available for redistribution
Submit your manuscript at
www.biomedcentral.com/submit