Systematic review with meta-analysis of the epidemiological evidence relating FEV1 decline to lung cancer risk
Bạn đang xem bản rút gọn của tài liệu. Xem và tải ngay bản đầy đủ của tài liệu tại đây (543.07 KB, 15 trang )
Fry et al. BMC Cancer 2012, 12:498
/>
RESEARCH ARTICLE
Open Access
Systematic review with meta-analysis of the
epidemiological evidence relating FEV1 decline to
lung cancer risk
John S Fry, Jan S Hamling and Peter N Lee*
Abstract
Background: Reduced FEV1 is known to predict increased lung cancer risk, but previous reviews are limited. To
quantify this relationship more precisely, and study heterogeneity, we derived estimates of β for the relationship RR
(diff) = exp(βdiff), where diff is the reduction in FEV1 expressed as a percentage of predicted (FEV1%P) and RR(diff)
the associated relative risk. We used results reported directly as β, and as grouped levels of RR in terms of FEV1%P
and of associated measures (e.g. FEV1/FVC).
Methods: Papers describing cohort studies involving at least three years follow-up which recorded FEV1 at baseline
and presented results relating lung cancer to FEV1 or associated measures were sought from Medline and other
sources. Data were recorded on study design and quality and, for each data block identified, on details of the
results, including population characteristics, adjustment factors, lung function measure, and analysis type.
Regression estimates were converted to β estimates where appropriate. For results reported by grouped levels, we
used the NHANES III dataset to estimate mean FEV1%P values for each level, regardless of the measure used, then
derived β using regression analysis which accounted for non-independence of the RR estimates. Goodness-of-fit
was tested by comparing observed and predicted lung cancer cases for each level. Inverse-variance weighted
meta-analysis allowed derivation of overall β estimates and testing for heterogeneity by factors including sex, age,
location, timing, duration, study quality, smoking adjustment, measure of FEV1 reported, and inverse-variance
weight of β.
Results: Thirty-three publications satisfying the inclusion/exclusion criteria were identified, seven being rejected as
not allowing estimation of β. The remaining 26 described 22 distinct studies, from which 32 independent β
estimates were derived. Goodness-of-fit was satisfactory, and exp(β), the RR increase per one unit FEV1%P decrease,
was estimated as 1.019 (95%CI 1.016-1.021). The estimates were quite consistent (I2 =29.6%). Mean age was the only
independent source of heterogeneity, exp(β) being higher for age <50 years (1.024, 1.020-1.028).
Conclusions: Although the source papers present results in various ways, complicating meta-analysis, they are very
consistent. A decrease in FEV1%P of 10% is associated with a 20% (95%CI 17%-23%) increase in lung cancer risk.
Background
There have been a number of studies that have reported
a strong relationship of forced expiratory volume in one
second (FEV1) to risk of lung cancer (e.g. [1-10]). However, apart from a review in 2005 by Wasswa-Kintu
et al. [11] we are unaware of any previous attempt to
meta-analyse the available data, and that review
restricted its meta-analysis only to those four studies
* Correspondence:
P N Lee Statistics and Computing Ltd, Sutton, Surrey, United Kingdom
which reported results by quintiles of FEV1, although
noting the existence of data from a larger number of
studies. In order to obtain a more precise estimate of the
relationship of FEV1 to lung cancer risk, and to study
factors which might affect the strength of this relationship, this systematic review and meta-analysis combines
separate quantitative estimates of the relationship from
studies which have presented their findings in a variety
of ways. For each available set of data we estimate the
slope (β) and its standard error (SE β) of the relationship
RR(diff ) = exp(βdiff ) where diff is the reduction in FEV1
© 2012 Fry et al.; licensee BioMed Central Ltd. This is an Open Access article distributed under the terms of the Creative
Commons Attribution License ( which permits unrestricted use, distribution, and
reproduction in any medium, provided the original work is properly cited.
Fry et al. BMC Cancer 2012, 12:498
/>
Page 2 of 15
expressed as a percentage of its predicted value (FEV1%
P), and RR(diff ) is the relative risk associated with this
reduction. Our procedures allow us to incorporate
results reported as quintiles, by other grouped levels or
as regression coefficients and also to include results
reported not only in terms of FEV1%P, but also in terms
of associated measures such as FEV1, or the ratio of
FEV1 to forced vital capacity (FEV1/FVC).
Identification of studies
Methods
Data recorded
Inclusion and exclusion criteria
Attention was restricted to epidemiological studies of
cohort design involving a follow-up period of at least
three years, in which FEV1 was recorded at baseline, and
which presented the results of analyses relating FEV1 (or
related measures) to subsequent risk of lung cancer.
The following exclusion criteria were applied:
Patients
Studies of patients who had undergone, or were selected
for, surgery; of patients with cancer or serious diseases
other than COPD; publications describing case reports
or reviews concerning treatment for cancer or surgical
procedures.
Not cohort
Clinical studies; studies of cross-sectional design; studies
involving a follow-up period shorter than three years.
Not lung cancer
Lung cancer not an endpoint; no lung cancer cases seen
during follow-up.
Reviews not of interest
Review papers where the relationship of FEV1 to lung
cancer was not considered, the papers typically only describing the relationship of an exposure (e.g. smoking)
with FEV1 and separately with lung cancer.
Note that the four sets of exclusion criteria were applied in turn, and once one criterion was satisfied no attempt was made to consider the others.
Literature searching
A Medline search was first carried out using the search
term (“Forced expiratory volume” [Mesh Terms] OR
FEV1 [All fields] OR “Forced expiratory volume” [All
Fields]) AND Lung cancer) with no limits. An Embase
search was then carried out using the same search terms.
Reviews of interest, including the earlier systematic review of Wasswa-Kintu et al. [11], were then examined to
see if they cited additional relevant references. Finally,
reference lists of the papers obtained were examined.
Relevant papers were allocated to studies, noting multiple papers on the same study, and papers reporting on
multiple studies. Each study was given a unique reference code (REF) of up to six characters (e.g. MANNIN
or MRFIT), usually based on the principal author’s
name. Possible overlaps between study populations were
considered.
Relevant information was entered onto a study database
and a linked relative risk (RR) database. The study
database contained a record for each study describing
the following aspects: relevant publications; study
title; study design; sexes considered; age range; details
of the population studied; location; timing; length of
follow-up; definition of lung cancer, and whether
mortality or incidence. It also contains details of the
individual components making up the NewcastleOttawa study quality score [12], described in detail in
Additional file 1: Quality.
The RR database holds the detailed results, typically
containing multiple records for each study. Each record
is linked to the relevant study and refers to a specific
RR, recording the comparison made and the results.
This record includes the following: sex; age range; race;
smoking status; adjustment factors; type of lung cancer;
source publication and length of follow-up. For studies
which provided a block of results by level of FEV1%P (or
by an associated measure, such as FEV1/FVC, FEV1
unnormalised or SDs of FEV1/height3 below average),
the record also included the measure reported, the range
(or mean if provided) of values for the comparison
group, and for each level the range (or mean) of values,
and the reported or estimated RR and 95% confidence
interval (CI) relative to the comparison group. Also
recorded was an estimate of the ratio of the number at
risk in the comparison group to the overall number at
risk, and the ratio of the number at risk to the number
of lung cancer cases for the block, and information to
distinguish between multiple blocks within the same
study (e.g. for different sexes or smoking groups). For
studies which only provided summary statistics for a
block (such as the RR for a 1% decrease in the measure),
the record contained details of the summary statistic
and also the information to distinguish between multiple
blocks. Although our main analyses are restricted to
the most relevant estimates recorded in the RR database
(e.g. data for FEV1%P if available, direct estimates of β
rather than estimates derived from RRs by level, data for
longest follow-up, or whole population data rather than
data for small subsets of the population), all data were
entered as available. However, most studies did not allow
any choice.
Fry et al. BMC Cancer 2012, 12:498
/>
Statistical methods
The basic model
The underlying model is that proposed by Berlin et al.
[13], which we previously used to study the relationship
of dose of environmental tobacco smoke exposure to
lung cancer [14]. In this model, the absolute risk of lung
cancer, R, in someone exposed to a given dose is
expressed as
R ¼ α expðβd Þ
where α and β are constants. This implies that the relative risk RR(d2,d1) comparing dose d2 to dose d1 is given
by
RRðd2 ; d1 Þ ¼ expðβðd2 À d1 ÞÞ
or RRðdiff Þ ¼ exp ðβdiff Þ
where diff is the difference in dose. This model implies
that a fixed difference in dose increases risk by a fixed
multiplicative factor.
When applying this model the dose, d, is the estimated
mean level of FEV1%P, and the difference in doses, diff,
is taken to be the reduction in FEV1%P compared to the
highest level studied. As RRs tend to increase with decreasing level of FEV1%P, expressing diff in terms of
reductions in FEV1%P ensures that estimates of β tend
to be positive. Note that no attempt is made to estimate
absolute risks or the parameter α, only the slope parameter, β, being estimated.
To use this method it was required to estimate β, and
its standard error (SE β), for each block to be analysed.
Three main situations were found in the blocks
examined:
a) Some studies actually presented estimates of β
together with its SE or 95% CI that could be used
directly. Others presented estimates in a form that
could readily be converted, e.g. increase in risk per
1% decrease in FEV1%P.
b) Other studies presented data by grouped values of
FEV1%P either directly as RRs and 95% CIs or in
other ways that allowed RRs and 95% CIs to be
calculated using standard methods [15]. Berlin et al.
[13] described a method for estimating β, and its
standard error (SE β), that requires data for a study
to consist of dose and number of cases and controls
(or subjects at risk) at each level of exposure. The
method is not a straightforward regression, as it has
to take into account the fact that the level-specific
RR estimates for a block are correlated, as they all
depend on the same comparison group. It can also
be applied to studies with data in the form of
confounder-corrected RRs and 95% CIs, provided
that such data are first converted into counts
Page 3 of 15
(“pseudo-numbers”). We used the method of
Hamling et al. [16] to estimate the pseudo-numbers.
c) A final group of studies had RRs that were not
expressed in terms of FEV1%P, but in terms of an
associated measure, such as uncorrected FEV or
FEV1/FVC. To ensure consistency in the estimation
process for β, we converted values of the associated
measure into values in terms of FEV1%P. To do this
we made use of the publicly available data in the
NHANES III study.
The NHANES III dataset
The National Health and Nutrition Examination Surveys
(NHANES) were conducted on nationwide probability
samples of approximately 32,000 persons 1–74 years of
age. The NHANES III survey [17], conducted from 1988
to 1994, was the seventh in a series of these surveys
based on a complex, multi-stage plan, designed to provide national estimates for the US of the health and nutritional status of the civilian, non-institutionalised
population aged two months and older. Inter alia, the
NHANES III study makes available data on age, sex,
race, height, smoking habits, FEV1 and FVC on an
individual-person basis.
Based on the NHANES data, Hankinson et al. (1999)
[18] provides widely-used equations to predict FEV1 for
an individual which are of the form:
FEV1 ðpredictedÞ ¼ b0 þ b1 ageðyearsÞ þ b2 ageðyearsÞ2
þ b3 heightðcmÞ2
where the coefficients: b0, b1, and b2, vary by sex, race
and age, as shown in Table 1. The observed value of
FEV1 for an individual can then be divided by the predicted value based on the individual’s characteristics,
and then multiplied by 100, to give the estimated value
of FEV1%P for that individual.
For each result not expressed in terms of FEV1%P, we
selected those NHANES III subjects who had the range
of characteristics relevant to that result. These characteristics included the range of the lung function measure
provided, age and sex (and in some cases smoking habit
or an additional lung function specification). We then
applied the FEV1 prediction equations to each of the
selected subjects and thus estimated the mean value of
FEV1%P. For example, one study [19] was of males aged
16–74 and gave relative risks for categories of FEV1/
FVC (<80%, 80-89% and 90%+ of predicted). From the
NHANES data we looked within males aged 16–74 and,
for each category of FEV1/FVC, calculated the mean
value of FEV1%P. The calculated mean was then used as
the dose value for our calculations of β.
One study [20] was a particular problem as the groupings were in terms of residuals from a regression analysis
Fry et al. BMC Cancer 2012, 12:498
/>
Page 4 of 15
Table 1 Age, sex and race specific coefficients used to predict FEV1 for the equations of Hankinson et al. [18]a
Sex
Race
Age
b0
b1
b2
b3
Male
Caucasian
<20
−0.7453
−0.04106
0.004477
0.00014098
20+
0.5536
−0.01303
−0.000172
0.00014098
<20
−0.7048
−0.05711
0.004316
0.00013194
20+
0.3411
−0.02309
0
0.00013194
<20
−0.8218
−0.04248
0.004291
0.00015104
20+
0.6306
−0.02928
0
0.00015104
<18
−0.8710
0.06537
0
0.00011496
18+
0.4333
−0.00361
−0.000194
0.00011496
<18
−0.9630
0.05799
0
0.00010846
18+
0.3433
−0.01283
−0.000097
0.00010846
<18
−0.9641
0.06490
0
0.00012154
18+
0.4529
−0.01178
−0.000113
0.00012154
African-American
Mexican-American
Female
Caucasian
African-American
Mexican-American
a The equation is of the form: FEV1 (predicted) = b0 + b1 age(years) + b2 age(years)2 + b3 height(cm)2. The coefficients are taken from Tables 4 and 5 of
Hankinson et al. [18].
including age, smoking status and current cigarettes
smoked. This model was fitted to the NHANES III data,
and mean values of FEV1%P were calculated for different
quartiles of the residuals.
Only one publication [21] provided mean levels for
each category when the original measure was FEV1%P.
Where means were not available, we used the NHANES
III dataset to calculate them. This was of particular
benefit when dealing with open-ended categories.
Predictions and goodness-of-fit of the fitted model
For data presented by grouped levels of FEV1%P (or
associated measures) the estimate of β was used to calculate predicted RRs and numbers of lung cancer cases at
each level corresponding to the observed RRs and numbers. The observed (O) and predicted (P) numbers were
then used to derive a chisquared test of goodness-of-fit by
summing (O-P)2/P, taking the degrees of freedom (d.f) as
one less than the number of levels. For defined values of d
(0, 0.01-10, 10.01-20, 20.01-30, 30.01-40, >40) O and P
were summed over block to similarly derive an overall
goodness-of-fit chisquared statistic on 5 d.f. Blocks involving only two levels were ignored for the chisquared tests
as providing no useful information on goodness-of-fit.
Meta-analysis and meta-regression
Individual study estimates of β and SE β were combined
to give overall estimates using inverse-variance weighted
regression analysis, equivalent to fixed-effect meta-analysis. Random-effects meta-analyses were also conducted, but are not reported here as the results were
virtually identical. Heterogeneity was investigated by
testing for significant variation in β, considering the following factors: sex (male, female, combined), publication
year (<1990, 1990–1994, 1995+), age at baseline (<50,
50–59, 60+ years), Newcastle-Ottawa quality score (5–7,
8–9), continent (North America, other), mortality or incidence (deaths, incidence, both), population type (general population, other), exposed population (exposed to
known lung carcinogens, other), length of follow up
(≤15, 16–23, 24+ years), smoking adjustment (yes, no),
measure of FEV1 reported (FEV1%P, other), effect as originally reported (regression coefficient, RR and CI,
SMR/SIR) and inverse-variance weight of β (<1000,
1000–2999, 3000+). Simple one factor at a time regressions were carried out first, with the significance of each
factor tested by a likelihood-ratio test compared to the
null model. A stepwise multiple regression analysis was
then carried out to determine which of the factors predicted risk independently.
Forest plots
Exp(β) is an estimate of the RR associated with a decrease
of 1% in FEV1%P. For each such RR included, referenced
by the study REF and associated block details such as sex,
the RR is shown as a rectangle, the area of which is
proportional to its weight. The CI is indicated by a horizontal line. The RRs and CIs are plotted on a logarithmic
scale so that the RR is centred in the CI. Also shown are
the values of each RR and CI and the weight as a percentage of the total. Results from the meta-analysis are shown
at the bottom of the plot. The combined estimate is
presented as a diamond, with the width corresponding to
the CI and the RR as the centre of the diamond.
Publication bias
Publication bias was investigated using Egger’s test [22]
and using funnel plots. In the funnel plots, β is plotted
against its precision (=1/SE). A dotted vertical line corresponds to the overall estimate.
Fry et al. BMC Cancer 2012, 12:498
/>
Page 5 of 15
Software
Results
All data entry and most statistical analyses were carried
out using ROELEE version 3.1 (available from P.N.Lee
Statistics and Computing Ltd, 17 Cedar Road, Sutton,
Surrey SM2 5DA, UK). Some analyses were conducted
using SAS or Excel 2003.
Publications and studies identified
Medline
search
1177 hits
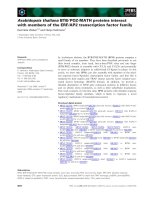
Thirty-three publications [1-5,7,9,10,19-21,23-44] satisfying the inclusion and exclusion criteria were identified
from the searches carried out in October 2011. Details
of these searches are given in Figure 1. Subsequently, at
→
11 reviews of interest
1102 rejects based on abstracts
examined
(954 patients, 111 not cohort, 27 not
lung cancer, 10 reviews not of interest)
→
42 rejects based on papers examined
(24 no lung cancer results, 18 no results
relating FEV1 to lung cancer)
→
23 reviews of interest
2072 rejects based on abstracts
examined
(1544 patients, 298 not cohort, 36 not
lung cancer, 194 reviews not of interest)
40 duplicates with Medline search
→
46 rejects based on papers examined
(33 no lung cancer results, 13 no results
relating FEV1 to lung cancer)
→
12 rejected
(1 not cohort, 10 no lung cancer results,
1 no results relating FEV1 to lung
cancer)
→
10 rejected
(1 not cohort, 7 no lung cancer results, 2
no results relating FEV1 to lung cancer)
→
7 rejected later
↓
64 possibly relevant
based on abstract
↓
22 accepted papers
Embase
search
2186 hits
↓
51 possibly relevant
based on abstract
↓
5 accepted papers
Reviews of
interest
34 reviews examined
(11 from Medline, 23
from Embase)
↓
15 additional papers
examined
↓
3 accepted papers
Secondary
references
30 accepted papers
examined
(22 from Medline, 5 from
Embase, 3 from reviews
of interest)
↓
13 additional papers
examined
↓
3 accepted papers
Total
33 accepted papers
Figure 1 Flow diagram for literature searching. The diagram gives details of the four stages of the search; the Medline search, the
Embase search, the search based on reviews of interest, and the search based on secondary references. The four criteria for rejecting
papers during these four stages are described further in the Methods section under the headings “patients”, “not cohort”, “not lung
cancer” and “reviews not of interest”. Note that one of the three papers accepted from the search based on secondary references cited a
paper that was also examined but provided no lung cancer results. The four stages produced a total of 33 accepted papers (22 Medline,
5 Embase, 3 reviews of interest, 3 secondary references). Subsequently 7 of these were rejected for reasons described in the first
paragraph of the Results section.
Fry et al. BMC Cancer 2012, 12:498
/>
Page 6 of 15
Table 2 Selected details of the 22 studies of FEV1 and lung cancer
Study
REF
Reference(s) Location
Baseline population
Follow-up Lung Newcastleperiod
cancer Ottawa
(years)
cases scorea
BEATY
[23]
USA,
Baltimore
874 men aged 17+ entering study on aging between 1958 and 1979
24
15
7
CALABR
[1]
Italy,
multicentre
3804 male and female current or former smokers aged 50–75 entering
study between 2000 and 2008
5
57
6
CARET
[25,26]
USA,
multicentre
3033 male asbestos exposed heavy smokers aged 45–74 entering study
between 1985 and 1994
20
205
8
CARTA
[19]
Italy, Sardinia 696 male silicotics aged up to 74 entering study between 1964 and 1970 23
22
6
FINKEL
[27]
Canada,
Ontario
733 male radon exposed uranium miners studied in 1974
18
42
5
ISLAM
[4,38]
USA,
Michigan
3956 men and women aged 25+ entering community health study
between 1962 and 1965
25
77
9
LANGE
[5]
Denmark,
13946 men and women aged 20+ entering heart health study between
Copenhagen 1976 and 1978
12
225
8
MALDON [31]
USA,
Minnesota
1520b male and female current or former smokers aged 50+ studied in
1999
4
64
5
MANNIN
[32]
USA,
national
5402 men and women aged 25–74 participating in NHANES between
1971 and 1975
22
113
9
MRFIT
[2,30]
USA,
multicentre
6613 men aged 35–57 at high risk of heart disease participating in the
Multiple Risk Factor Intervention Trial between 1973 and 1982
26
363
8
NOMURA [7]
USA, Hawaii
6317 Japanese-American men aged 46–68 entering study between 1965
and 1968
22
172
8
PETO
[35]
UK, five
areas
2718 men in occupational groups aged 25–64 entering study between
1954 and 1961
25
103
7
PURDUE
[37]
Sweden,
national
176997 male construction workers entering study between 1971 and
1993
31
834
7
RENFRE
[3,28]
Scotland,
two cities
15244 men and women aged 45–64 entering study between 1972 and
1976
23
651
8
SKILLR
[9]
USA,
Minnesota
226c men and women aged 45–59 living in rural areas entering study
between 1973 and 1974
11
11
7
SPEIZE
[20]
USA six cities 8427 men and women aged 25–74 entering study between 1974 and
1977
12
61
8
STAVEM
[21]
Norway,
Oslo
1623 male workers in five companies aged 40–59 entering study
between 1972 and 1975
26
42
7
TAMMEM [39]
Canada,
British
Columbia
2596 male and female current and former smokers of 20+ pack-years
aged 40+ studied in 1990
17
154
8
TOCKMA
[10]
USA,
Baltimore
3728 male current smokers and recent quitters, smoking 1+ packs/day,
aged 45+ studied in 1987
2d
19
7
VANDEN
[40]
USA,
California
153925 male and female members of the Kaiser Permanente Medical
Care Program entering study between 1964 and 1972
24
1514
9
WILES
[43]
South Africa, 2062 male gold miners aged 45–54 entering study between 1968 and
national
1970
18
74
5
WILSON
[44]
USA,
1553 male and female current or former smokers of 10+ cigs/day for 25
Pennsylvania + years with FEV1/FVC <0.7, aged 50–79, entering study from 2002
5
67
6
a
See Methods for a description of this score. The maximum possible value is 9.
Nested case–control analysis involving 64 cases and 377 controls drawn from original population of 1520.
Nested case–control analysis involving 113 men and women with FEV1 <70% predicted, and 113 with FEV1 of 85% or more drawn from a study with original
sample size not stated.
d
Although the mean follow-up was less than 3 years, follow-up for some subjects was 3 years or more, so the study was not considered to have failed the
inclusion criteria.
b
c
Fry et al. BMC Cancer 2012, 12:498
/>
Page 7 of 15
the analysis stage, seven of these publications were
rejected. Two [41,42] described a study in Denmark
which presented its results in a way that did not allow
estimation of β. Two [24,36] described a study in France
of iron miners which only provided results for decreased
FEV1 without giving the ranges of FEV1 being compared.
One [29] described a nested case–control study in the
USA of heavily asbestos-exposed shipyard workers, which
reported only the mean difference in FEV1 between cases
and controls. Two [33,34] described results from the
Italian rural cohorts of the Seven Countries Study, which
reported results only for forced expiratory volume in ¾
second. A brief summary of the findings from these is
reported in Additional file 2: Others, which demonstrates
that these were consistent in showing an association of
reduced FEV1 with increased lung cancer risk.
The remaining 26 publications were then subdivided
into 22 distinct studies, some details of which are summarized in Table 2. Of the 22 studies, 12 were conducted in the USA, 3 in Scandinavia, 2 in Italy, 2 in the
UK, 2 in Canada and 1 in South Africa. Many of the
studies were quite old, with 16 starting before 1980. 12
involved follow-up of 20 years or more, with a further 6
involving at least 10 years follow-up. Numbers of lung
cancers analysed ranged from 11 in study SKILLR to
1514 in study VANDEN. 10 studies involved over 100
cases. 3 studies involved subjects exposed to known lung
carcinogens other than smoking (CARET: asbestos,
CARTA: silica, FINKEL: radon) and a further study
(WILES) was of gold miners. Newcastle-Ottawa quality
scores ranged from 5 to 9, with 10 studies scored as 8 or
9. The 22 studies provided data for 32 independent data
blocks, with CARET giving results separately for those
with FEV1/FVC above or below 0.70, RENFRE, SPEIZE
and TAMMEM giving results separately for men and
women, ISLAM giving results separately for current and
non-current smokers, and VANDEN, the study involving
the largest number of lung cancer cases, giving six sets
of results, separately for all combinations of sex and
smoking status (never, former, current).
β was directly available, and for the other three β could
readily be calculated from the odds ratio for a given percentage increase or decrease in FEV1%P.
Table 4 summarizes the results for the remaining 27
blocks where results were given by level of FEV1%P or an
associated measure. The table shows the measure the data
were originally presented in, the estimated mean reduction
in FEV1%P compared to the base group with the highest
value of FEV1%P, the observed RRs and 95% CIs and those
fitted using the estimate of β, which is also shown. Also
shown are the observed pseudo-numbers of lung cancer
cases at each level and those fitted using the estimate of β,
and the goodness-of-fit chisquared. Additional file 3: Fit
gives plots comparing the observed and fitted RRs.
Where only two levels of FEV1%P were available, the
fitted numbers of cases necessarily equalled the numbers
observed. Where there were more than two levels being
compared, the goodness-of-fit to the model was generally satisfactory. The significant (p<0.05) misfits to the
model were for: block 5 (CARTA), where there was almost a 4-fold difference in risk between the highest and
middle groups (90+ and 80 to <90 FEV1/FVC) but virtually the same estimated FEV1%P; block 13 (NOMURA)
and block 29 (VANDEN female former smokers), where
the pattern of increasing risk with declining FEV1%P
was non-monotonic; and block 14 (PETO), block 17
(RENFRE females) and block 30 (VANDEN female
current smokers), where the increase in risk was similar
but marked in all the groups with reduced FEV1%P.
Only for block 13 (NOMURA) was the p value for the
fit <0.01. Table 4 also includes the results from an overall goodness-of-fit test for those blocks involving more
than two levels. While there is some tendency for fitted
numbers of lung cancer cases to be somewhat higher
than the observed numbers at the extremes (the comparison group and differences in FEV1%P greater than
40), and lower in the four intermediate groups (differences of 0.01 to 10, 10.01 to 20, 20.01 to 30 and 30.01 to
40) the goodness-of-fit chisquared statistic of 8.43 on 5
d.f. is not significant (p=0.13).
Fitted β estimates and goodness-of-fit
Meta-analysis and meta-regressions
Table 3 summarizes the results for those five blocks
where regression estimates for the lung cancer/FEV1 relationship were provided by the authors. For two blocks,
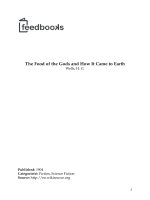
Exp(β) is the RR associated with a decrease in FEV1%P
by one unit, and Figure 2 presents a forest plot showing
the estimated values with 95% CI for each of the 32
Table 3 Results for the five blocks already expressed as regression coefficients
Block: study
Block details
β (SE)
Comment
7: ISLAM
Never and former smokers
0.016 (0.010)
As given (FEV1%P)
8: ISLAM
Current smokers
0.013 (0.007)
As given (FEV1%P)
10: MALDON
Whole population
0.015 (0.008)
Given as 1.15 (95% CI 1.00-1.32) for an OR for a 10% decrease in FEV1%P
22: TAMMEM
Females
0.010 (0.008)
Given as 0.99 (95% CI 0.98-1.01) for an OR for a 1% increase in FEV1%P
23: TAMMEM
Males
0.030 (0.007)
Given as 0.97 (95% CI 0.96-0.99) for an OR for a 1% increase in FEV1%P
Fry et al. BMC Cancer 2012, 12:498
/>
Page 8 of 15
Table 4 Fit of the model to the data for the 27 blocks with grouped data
Block: studya
Measureb
Rangec
FEV1 %P Diffd
RR (95%CI)
Fitted RR
Cases observede
Cases fitted
1: BEATY
FEV1%P
>80
(95.33)
1.00
1.00
14.30
14.30
β (SE) =
−0.028 (0.034)
≤80
29.77
0.43 (0.06-3.20)
0.43
1.03
1.03
2: CALABR
FEV1%P
90+
(104.94)
1.00
1.00
24.20
25.71
β (SE) =
0.024 (0.008)
70 to <90
23.90
2.29 (1.24-4.23)
1.76
17.09
13.98
χ2 (df) =
1.04 (1)
<70
49.60
2.90 (1.34-6.27)
3.25
8.50
10.11
3: CARETf
FEV1%P
80+
(100.75)
1.00
1.00
35.35
34.69
β (SE) =
0.022 (0.007)
70 to <80
24.89
1.54 (0.80-2.63)
1.74
14.59
16.20
χ (df) =
0.22 (2)
60 to <70
34.92
2.25 (1.20-4.19)
2.18
12.39
11.77
<60
49.07
3.08 (1.42-6.69)
2.99
6.92
6.59
2
g
4: CARET
FEV1%P
80+
(91.97)
1.00
1.00
16.66
15.78
β (SE) =
0.012 (0.006)
70 to <80
16.94
1.05 (0.56-1.96)
1.22
19.07
20.99
χ (df) =
0.25 (2)
60 to <70
26.77
1.33 (0.74-2.42)
1.36
24.04
23.27
<60
47.77
1.66 (0.95-2.89)
1.74
34.62
34.35
2
5: CARTA
FEV1/FVC
90+
(99.82)
1.00
1.00
3.72
7.84
β (SE) =
0.072 (0.049)
80 to <90
−0.99
3.87 (1.12-15.05)
0.93
5.83
2.95
χ2 (df) =
5.25 (1), p<0.05
<80
9.64
5.18 (1.56-19.66)
2.00
6.66
5.42
6: FINKEL
FEV1%P
100+
(109.54)
1.00
1.00
7.75
6.71
β (SE) =
0.009 (0.011)
80 to <100
18.00
0.89 (0.39-2.18)
1.17
13.43
15.32
χ2 (df) =
0.47 (1)
<80
41.17
1.35 (0.57-3.36)
1.44
11.17
10.31
9: LANGE
FEV1%P
80+
(100.99)
1.00
1.00
47.92
48.77
β (SE) =
0.020 (0.004)
40 to <80
32.64
2.10 (1.30-3.40)
1.93
24.67
23.05
χ (df) =
0.17 (1)
<40
69.50
3.90 (2.20-7.20)
4.05
13.46
14.23
11: MANNIN
FEV1%P
80+
(100.24)
1.00
1.00
84.98
84.94
2
β (SE) =
0.022 (0.006)
<80
33.97
2.12 (1.44-3.11)
2.12
35.83
35.87
12: MRFIT
FEV1 unnormalised,ml
≥3674
(105.91)
1.00
1.00
27.01
26.50
β (SE) =
0.031 (0.005)
3307 to 3673
10.05
1.31 (0.82-2.10)
1.37
45.30
46.34
χ2 (df) =
0.85 (3)
2985 to 3306
15.92
1.50 (0.95-2.36)
1.64
54.20
58.27
2606 to 2984
22.21
2.13 (1.39-3.26)
2.00
80.62
74.45
≤2605
37.59
3.13 (2.07-4.72)
3.23
106.01
107.59
13: NOMURA
FEV1%P
103.5+
(113.14)
1.00
1.00
22.16
23.76
β (SE) =
0.018 (0.005)
94.5 to <103.5
14.40
1.00 (0.60-1.90)
1.29
23.34
32.35
χ (df) =
11.40 (2), p<0.01
2
84.5 to <94.5
23.45
2.50 (1.50-4.10)
1.52
44.66
29.09
<84.5
43.11
2.10 (1.30-3.50)
2.15
49.51
54.48
14: PETO
SDs of FEV1/h3 below average
Above average
(103.85)
1.00
1.00
32.15
39.80
β (SE) =
0.018 (0.008)
0 to 1
15.05
2.17 (1.40-3.38)
1.32
46.77
35.18
χ2 (df) =
6.81 (2), p<0.05
1 to 2
34.30
2.02 (0.97-3.90)
1.88
9.93
11.43
2+
65.85
1.89 (0.37-5.90)
3.35
2.03
4.47
15: PURDUE
FEV1%P
80+
(100.13)
1.00
1.00
1698.83
1698.83
β (SE) =
0.023 (0.002)
<80
31.76
2.06 (1.77-2.39)
2.06
189.24
189.24
16: RENFRE
FEV1%P
Quintile 5
(116.04)
1.00
1.00
31.54
35.64
β (SE) =
0.015 (0.003)
Quintile 4
13.70
1.36 (0.86-2.13)
1.22
42.34
42.97
χ (df) =
1.48 (3)
Quintile 3
23.79
1.81 (1.18-2.78)
1.42
55.91
49.41
Quintile 2
35.19
1.93 (1.27-2.94)
1.67
62.88
61.57
Quintile 1
57.75
2.53 (1.69-3.79)
2.32
79.83
82.90
h
2
Fry et al. BMC Cancer 2012, 12:498
/>
Page 9 of 15
Table 4 Fit of the model to the data for the 27 blocks with grouped data (Continued)
17: RENFREi
FEV1%P
Quintile 5
(119.96)
1.00
1.00
6.22
15.69
β (SE) =
0.011 (0.005)
Quintile 4
13.53
3.63 (1.49-8.84)
1.15
21.19
16.98
χ (df) =
8.39 (3), p<0.05
Quintile 3
24.26
4.03 (1.68-9.67)
1.29
24.88
20.11
Quintile 2
36.19
4.12 (1.73-9.81)
1.47
27.21
24.40
Quintile 1
59.75
4.37 (1.84-10.42)
1.88
27.40
29.72
85+
(100.81)
1.00
1.00
1.99
1.99
2
18: SKILLR
FEV1%P
β (SE) =
0.034 (0.017)
< = 70
44.85
4.50 (0.99-20.37)
4.50
8.97
8.97
19: SPEIZEh
Mean FEV1,ℓ.j
4.07
(109.98)
1.00
1.00
2.09
3.72
β (SE) =
0.048 (0.014)
3.54
9.02
4.33 (1.19-23.71)
1.54
9.35
5.93
χ2 (df) =
4.49 (2)
3.18
16.84
2.10 (0.45-12.96)
2.25
3.85
7.35
2.55
33.30
9.60 (2.93-49.67)
4.98
21.90
20.19
20: SPEIZEi
Mean FEV1,ℓ.j
2.90
(112.16)
1.00
1.00
0.50
0.62
β (SE) =
0.054 (0.029)
2.57
10.10
3.17 (0.25-166.25)
1.73
1.36
0.92
χ2 (df) =
0.52 (2)
2.34
19.47
2.05 (0.11-121.19)
2.86
0.85
1.48
1.95
35.49
8.94 (1.20-396.75)
6.80
5.74
5.43
21: STAVEM
Mean FEV1%P
121.90
(121.90)
1.00
1.00
8.99
6.19
β (SE) =
0.021 (0.008)
106.60
15.30
0.78 (0.29-2.07)
1.38
6.89
8.42
χ2 (df) =
4.48 (2)
95.30
26.60
0.67 (0.24-1.86)
1.76
6.00
10.86
75.70
46.20
2.23 (1.03-4.83)
2.67
20.40
16.82
24: TOCKMA
FEV1%P
>85
(102.90)
1.00
1.00
22.27
22.72
β (SE) =
0.021 (0.010)
60 to 85
27.52
2.57 (0.87-7.56)
1.78
3.82
2.70
χ2 (df) =
0.60 (1)
<60
57.43
2.72 (0.76-9.74)
3.34
2.61
3.27
25: VANDENk
FEV1 unnormalised, ℓ
3.85+
(105.38)
1.00
1.00
5.34
4.12
β (SE) =
0.018 (0.013)
3.35-3.85
7.12
1.19 (0.41-3.49)
1.14
8.82
6.47
χ2 (df) =
2.23 (3)
2.85-3.35
9.72
0.76 (0.27-2.14)
1.19
10.80
13.02
2.35-2.85
11.23
0.76 (0.27-2.14)
1.22
11.01
13.64
<2.35
31.46
1.49 (0.55-4.05)
1.75
13.75
12.46
3.85+
(106.21)
1.00
1.00
6.84
10.05
26: VANDENl
FEV1 unnormalised, ℓ
β (SE) =
0.010 (0.007)
3.35-3.85
5.47
1.43 (0.60-3.42)
1.06
18.46
20.11
χ2 (df) =
1.63 (3)
2.85-3.35
10.13
1.76 (0.78-3.93)
1.11
41.81
38.92
2.35-2.85
14.67
1.80 (0.83-3.91)
1.17
81.93
78.13
<2.35
3.85+
35.27
(104.52)
2.04 (0.92-4.54)
1.00
1.44
1.00
45.94
24.68
47.77
29.86
27: VANDENm
FEV1 unnormalised, ℓ
β (SE) =
0.012 (0.003)
3.35-3.85
9.72
1.32 (0.82-2.12)
1.12
55.20
56.66
χ2 (df) =
1.69 (3)
2.85-3.35
14.29
1.43 (0.94-2.19)
1.18
141.35
140.99
2.35-2.85
21.15
1.62 (1.08-2.44)
1.28
267.93
255.94
<2.35
40.79
1.89 (1.24-2.87)
1.61
167.40
173.12
28: VANDEN
FEV1 unnormalised, ℓ
2.75+
(105.01)
1.00
1.00
7.50
5.82
β (SE) =
−0.004 (0.016)
2.35-2.75
7.32
0.76 (0.30-1.90)
0.97
11.34
11.31
χ2 (df) =
2.92 (3)
2.05-2.35
8.70
0.60 (0.27-1.34)
0.97
29.24
36.34
1.65-2.05
8.73
0.92 (0.40-2.12)
0.97
21.57
17.51
<1.65
2.35-2.75p
22.96
(97.83)
0.76 (0.33-1.78)
1.00
0.91
1.00
18.43
11.85
17.11
9.95
n
29: VANDENo
FEV1 unnormalised, ℓ
β (SE) =
0.026 (0.011)
2.05-2.35
3.02
1.25 (0.61-2.57)
1.08
19.20
13.93
χ2 (df) =
6.55 (2), p<0.05
1.65-2.05
5.49
0.54 (0.24-1.21)
1.15
11.29
20.27
<1.65
27.83
1.92 (0.92-4.02)
2.05
17.24
15.43
Fry et al. BMC Cancer 2012, 12:498
/>
Page 10 of 15
Table 4 Fit of the model to the data for the 27 blocks with grouped data (Continued)
30: VANDENq
FEV1 unnormalised, ℓ
2.75+
(103.28)
1.00
1.00
9.63
21.54
β (SE) =
0.019 (0.004)
2.35-2.75
9.74
2.90 (1.46-5.77)
1.20
51.91
47.91
χ2 (df) =
8.13 (3), p<0.05
2.05-2.35
15.25
3.33 (1.72-6.48)
1.33
86.50
77.06
1.65-2.05
21.26
3.33 (1.74-6.37)
1.48
166.89
166.21
<1.65
41.80
4.76 (2.47-9.19)
2.17
107.33
109.53
56+
(105.56)
1.00
1.00
23.36
25.12
31: WILES
FEV1/h3, cl/m3
β (SE) =
0.021 (0.008)
43-56
17.66
1.69 (0.97-2.94)
1.46
25.01
23.20
χ2 (df) =
1.02 (2)
30-43
36.24
2.65 (1.29-5.20)
2.17
11.02
9.68
0-30
70.93
2.87 (0.56-9.30)
4.54
1.97
3.34
32: WILSONg
FEV1%P
80+
(100.14)
1.00
1.00
10.78
10.85
β (SE) =
0.008 (0.007)
50 to <80
30.94
1.30 (0.64-2.65)
1.28
22.87
22.73
χ2 (df) =
0.002 (1)
<50
62.07
1.65 (0.70-3.90)
1.65
9.21
9.28
TOTALr
FEV1%P
(106.16)
388.51
431.45
χ2 (df) =
8.43 (5)
0.01-10
259.67
257.83
10.01-20
666.20
658.51
20.01-30
742.1
694.76
30.01-40
364.31
358.07
>40
542.36
562.52
For each block, the block number and study reference code is shown. Also shown in columns 1 and 2 are the values of β, the fitted slope of the relationship of
log RR to the estimated mean difference (see note d), and the SE of β, and also, for blocks with more than two levels, the results of the goodness-of-fit test.
b
This is the measure the data were originally recorded in.
c
The range of values of the measure for which results were available.
d
The estimated mean difference of FEV1%P between the comparison level and the level of interest. Shown in brackets is the estimate of FEV1%P for the
comparison level.
e
These are pseudo-numbers of cases estimated using the method of Hamling et al. [16].
f
FEV1/FVC ≥0.70.
g
FEV1/FVC<0.70.
h
Males.
i
Females.
j
RRs were given by quartiles of FEV1 residuals calculated from a prediction equation. Mean FEV1 levels for each quartile were used to derive the differences in
FEV1%P.
k
Male never smokers.
l
Male former smokers.
m
Male current smokers.
n
Female never smokers.
o
Female former smokers.
p
There were no deaths in the highest quintile (2.75+ ℓ).
q
Female current smokers.
r
Total over all blocks with more than two levels.
a
blocks. These range from 0.972 to 1.075, with a combined estimate of 1.019 (95% CI 1.016 to 1.021,
p<0.001). It is evident from Figure 2 that the estimates
are reasonably consistent. As shown in Table 5, the deviance (chisquared) of the 32 results is 44.01 on 31 d.f.,
equivalent to an I2 of 29.6%.
Table 5 also presents estimates of β by level of a range
of different factors. For 10 of the 13 factors considered,
including sex, publication year, study quality, continent,
exposed to lung carcinogens, follow-up period, smoking
adjustment, measure of FEV1 reported, inverse-variance
weight of β, and how the data were originally recorded,
there was no significant evidence of variation by level.
However, there was significant evidence of variation by
mean age at baseline (p<0.01), disease fatality (p<0.01)
and population type (p<0.05), with estimates of β being
somewhat higher in younger populations, in studies involving lung cancer deaths rather than incidence, and in
studies not of the general population. In stepwise regression, however, only mean age at baseline remained in
the model as an independent predictor of lung cancer
risk.
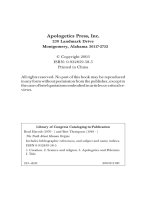
Publication bias
Based on the 32 estimates of β there was no evidence of
publication bias using Egger’s test. This is consistent
with the funnel plot shown as Figure 3, and with the lack
of relationship between β and its weight shown in
Table 5.
Fry et al. BMC Cancer 2012, 12:498
/>
Block: Study
Page 11 of 15
Exp(Beta) (RR)
95% CI
Weight
(%)
Exp(Beta) (RR)
95% CI
0.092
1.849
2.558
3.459
0.045
0.926
1.074
2.071
6.228
1.660
3.211
5.412
3.618
1.769
18.456
11.768
3.999
0.363
0.588
0.130
1.657
1.870
1.945
1.001
0.638
2.414
9.592
0.426
0.850
6.297
1.872
2.159
0.972 (0.909, 1.039)
1.024 (1.009, 1.039)
1.023 (1.010, 1.036)
1.012 (1.001, 1.023)
1.075 (0.976, 1.183)
1.009 (0.988, 1.030)
1.016 (0.996, 1.036)
1.013 (0.999, 1.028)
1.020 (1.012, 1.029)
1.015 (0.999, 1.031)
1.022 (1.011, 1.034)
1.032 (1.023, 1.041)
1.018 (1.007, 1.029)
1.019 (1.003, 1.034)
1.023 (1.018, 1.028)
1.015 (1.009, 1.021)
1.011 (1.000, 1.021)
1.034 (1.000, 1.070)
1.049 (1.022, 1.078)
1.055 (0.998, 1.117)
1.021 (1.006, 1.038)
1.010 (0.995, 1.025)
1.030 (1.015, 1.045)
1.021 (1.001, 1.042)
1.018 (0.992, 1.044)
1.010 (0.997, 1.024)
1.012 (1.005, 1.018)
0.996 (0.966, 1.028)
1.026 (1.004, 1.049)
1.019 (1.011, 1.027)
1.022 (1.007, 1.037)
1.008 (0.994, 1.022)
100.000
1.019 (1.016, 1.021)
1:BEATY
2:CALABR
3:CARET,HI
4:CARET,LO
5:CARTA
6:FINKEL
7:ISLAM,NX
8:ISLAM,C
9:LANGE
10:MALDON
11:MANNIN
12:MRFIT
13:NOMURA
14:PETO
15:PURDUE
16:RENFRE,M
17:RENFRE,F
18:SKILLR
19:SPEIZE,M
20:SPEIZE,F
21:STAVEM
22:TAMMEM,F
23:TAMMEM,M
24:TOCKMA
25:VANDEN,M,N
26:VANDEN,M,X
27:VANDEN,M,C
28:VANDEN,F,N
29:VANDEN,F,X
30:VANDEN,F,C
31:WILES
32:WILSON
Total (95% CI)
0.833
1.000
1.200
Figure 2 Forest plot of the 32 estimates of exp(β). Estimates of β and SE(β) are presented in Table 3 for results presented originally as
regression coefficients and in Table 4 for results presented by grouped level of FEV1 or associated measures. For each of the 32 estimates Figure
2 shows the associated values of exp(β) with their 95%CIs. These estimates are shown both numerically and also graphically on a logarithmic
scale. The studies are sorted in order of block number, and are referenced by study reference (REF). Multiple blocks within the same study are
distinguished by the following codes (M = males, F = females, N = never smokers, X = ex smokers, C = current smokers, HI = FEV1/FVC ≥ 0.70,
and LO = FEV1/FVC < 0.70). In the graphical representation individual RRs are indicated by a solid square, with the area of the square proportional
to the weight (inverse- variance of log RR).
Discussion
Based on 32 independent data sets from 22 studies we
estimate β as 0.018 (95%CI 0.016-0.021). This relationship is highly significant (p<0.001) and is equivalent to
saying that, compared to someone with an average
FEV1%P of 100%, someone with an FEV1%P of 90%
would have a 20% increase in lung cancer risk, and
someone with an FEV1%P of 50% would have a 151%
increase.
There is little evidence of heterogeneity over study
(I2 = 29.6%), or that estimates vary by specific factors
including sex, study location, length of follow-up, adjustment for smoking, the measure of FEV1 reported,
or how the results were originally reported. Nor was
there any evidence of publication bias. There was,
however, some evidence that estimates varied by age
of the population at baseline, but even then clear
reductions were seen in all three age groups studied,
with β varying only between 0.015 and 0.024. We discuss
below various aspects of our methods, which might attract
criticism.
One is the use of the data from NHANES III which,
though nationally representative of the USA, would
not be representative of the populations involved in
the 22 studies we considered. We used NHANES III
for two reasons. First, we needed to have mean FEV1%
P values corresponding to the groups used, only one
study actually reported such means, and NHANES III
was a large and available database. Our feeling is that
any errors for non open-ended intervals are likely to be
minor, and that even for open-ended intervals any
errors are unlikely to have affected our main conclusions. In this we are fortified by the general consistency
of the estimates of β and also by the observation that
for the one study (STAVEM) that did supply means,
the estimates reported (121.9, 106.6, 95.3 and 75.7)
were similar to those that could be estimated from
NHANES III (122.1, 106.2, 94.8 and 71.9). The other
reason was that we needed some method of incorporating studies reporting results, not by FEV1%P directly,
but by associated measures. Had we restricted attention to results reported by FEV1%P we would have
reduced the number of available blocks from 32 to 20,
and we wished to avoid such loss of power. Here it is
reassuring that the overall estimate for the 12 blocks
where β was estimated using data for associated measures of 0.019 (0.014-0.024) was very close to that for
the other 20 blocks of 0.018 (0.015-0.021).
Fry et al. BMC Cancer 2012, 12:498
/>
Page 12 of 15
Table 5 Testing for significance of variation in β by various factors considered one at a time
Factor
Level
Blocks includeda
Nb
β (95% CI)
Deviancec
None
All
1-32
32
0.018 (0.016-0.021)
44.01
42.33
Sex
Publication year
Mean age
Quality score
Continent
Disease fatality
Population type
Exposed to lung carcinogens
Follow-up period
Adjusted for smoking
Measure of FEV1 reported
Weight of β
Original data recorded as
Male
1,3-6,12-16,19,21,23-27,31
18
0.019 (0.016-0.022)
Female
17,20,22,28-30
6
0.015 (0.008-0.022)
Both
2,7-11,18,32
8
0.018 (0.012-0.024)
<1990
1,14,18-20,24
6
0.025 (0.012-0.038)
1990-1994
5,7-9,13,25-31
12
0.016 (0.012-0.020)
1995+
2-4,6,10-12,15-17,21-23,32
14
0.019 (0.016-0.023)
<50
5,6,11,12,14,15,19-21,31
10
0.024 (0.020-0.028)
50-59
1,3,4,9,13,16-18,25-30
14
0.015 (0.012-0.018)
60+
2,7,8,10,22-24,32
8
0.017 (0.011-0.022)
8 or 9
3,4,7-9,11-13,16,17,19,20,22,23,25–30,32
21
0.017 (0.014-0.020)
5 to 7
1,2,5,6,10,14,15,18,21,24,31
11
0.022 (0.017-0.026)
North America
1,3,4,6-8,10-13,18-20,22-30,32
23
0.018 (0.014-0.021)
Other
2,5,9,14-17,21,31
9
0.019 (0.016-0.023)
Deaths
1,5,9,12,14,15,19-21,24,31
11
0.024 (0.020-0.027)
Incidence
13,22,23,25-30
9
0.015 (0.011-0.020)
Both
2-4,6-8,10,11,16-18,32
12
0.015 (0.012-0.019)
General
1,7-9,11,14,16,17,19-21,25-30
17
0.016 (0.013-0.019)
Other
2-6,10,12,13,15,18,22-24,31,32
15
0.021 (0.018-0.025)
Yes
3-6
4
0.016 (0.006-0.025)
No
1,2,7-32
28
0.019 (0.016-0.021)
1-15
2,9,10,18-20,24,32
8
0.020 (0.013-0.027)
16-23
3-6,11,13,16,17,22,23,31
11
0.016 (0.012-0.021)
24+
1,7,8,12,14,15,21,25-30
13
0.019 (0.016-0.023)
Yesd
2-4,7-13,15-17,19,20,22-30,32
25
0.018 (0.016-0.021)
No
1,5,6,14,18,21,31
7
0.019 (0.009-0.029)
FEV1%P
1-4,6-11,13,15-18,21-24,32
20
0.018 (0.015-0.021)
Other
5,12,14,19,20,25-31
12
0.019 (0.014-0.024)
<125
1,5-7,18-20,24,25,28,29
11
0.021 (0.010-0.031)
125-250
2,3,8,10,14,21-23,26,31,32
11
0.017 (0.012-0.023)
250+
4,9,11-13,15-17,27,30
10
0.019 (0.015-0.022)
Regression coefficient
7,8,10,22,23
5
0.017 (0.008-0.026)
RR (CI)
1-4,9,11-13,15-18,21,24-30,32
21
0.018 (0.016-0.021)
SMR/SIR
5,6,14,19,20,31
6
0.022 (0.011-0.034)
40.12
29.12**
40.20
43.46
28.99**
37.74*
43.44
41.72
43.98
43.93
43.54
43.02
a
See Tables 3 and 4 for definition of blocks.
b
Number of estimates of β which are combined.
c
The significance of the factor is assessed by comparing the deviance for the model including that factor and the deviance for the null (no factor) model and is
indicated by *p<0.05 **p<0.01 *** p<0.001.
d
This includes blocks which relate to the whole population, current smokers or ever smokers which adjust at least for a measure of dose, such as cigs/day or pack
yrs, and blocks which are restricted to nonsmokers.
We should also comment on the fact that the method
of estimation of β required pseudo-numbers of cases
and numbers at risk for each level of FEV1%P corresponding to the adjusted RRs, as using simple numbers
would have removed the effects of adjustment. We used
the method of Hamling et al. [16] here to estimate the
pseudo-numbers, and note that Orsini et al. [45]
recently reported that they arrived at very similar results
using this method as they obtained based on the available individual person data, although this was in a
somewhat different context. Our experience too is that
the method provides a very robust way of estimating
the magnitude and significance of functions of relative
risks.
Fry et al. BMC Cancer 2012, 12:498
/>
Page 13 of 15
Precision of Beta
450
FEV1%P
Other
360
270
180
90
0
-0.100
-0.060
-0.020
0.020
0.060
0.100
Beta
Figure 3 Funnel plot. Funnel plot of the 32 estimates of β against their precision (1/SE). The dotted vertical line indicates the meta-analysis
estimate. Estimates based on data originally presented as FEV1%P are distinguished from other estimates by different symbols.
Another issue is the use of a simple model in which
the logarithm of the RR is linearly related to the difference in FEV1%P. As always, one could postulate more
complex relationships, but have found that the model
fits the data quite well, as judged by the goodness-of-fit
tests conducted. We have not explored whether more
complex models fit materially better, nor attempted to
estimate risks for a given level of FEV1%P, but note that
a simple model has advantages in expressing the relationship to the reader. Clearly our model may not fit
perfectly at the extremes (e.g. comparing someone with
a value of FEV1%P of 150 and one of 30) but data here
are limited. One would really need individual person
data to get a more precise answer, but we have not
attempted to obtain such data, particularly as many of
the studies were conducted many years ago.
Based on those studies where we could estimate β we
found no evidence of publication bias. However, we
should point out that we had to reject seven publications,
describing four studies, as the data were not presented in
a way that allowed estimation of β. These studies, which
each involved less than 40 lung cancer cases, were consistent in demonstrating a positive association of reduced
FEV1 with increased lung cancer risk, and it seems unlikely that this omission has caused material bias.
While our β estimates were quite consistent over study,
we did observe somewhat higher values in younger populations. This may reflect variations in the rate of FEV1 decline
associated with susceptibility to smoking [46]. Subjects in
younger populations who already have reduced FEV1 may
have even more reduced FEV1 later in life and therefore an
even greater risk of lung cancer during follow-up. None of
the studies we reviewed relate FEV1 recorded on two occasions to subsequent risk of lung cancer, to allow direct testing of the relationship of rapidity of FEV1 decline to lung
cancer risk.
In their review Wasswa-Kintu et al. [11] concluded
that “reduced FEV1 is strongly associated with lung
Fry et al. BMC Cancer 2012, 12:498
/>
cancer” and that “even a relatively modest reduction in
FEV1 is a significant predictor of lung cancer, especially among women.” Their meta-analyses were based
on four studies that reported FEV1 in quintiles, with
their estimated relative risks for the lowest to the highest quintile being 2.23 (95%CI 1.73-2.86) for men and
3.97 (95%CI 1.93-8.25) for women. While our metaanalyses, which are based on far more studies, confirmed the strong association of reduced FEV1 with
increased lung cancer risk, we found no significant difference between the sexes. It is not possible to compare our estimates precisely but, taking the difference
in FEV1%P between the lowest and highest quintiles to
be 60 (approximately the value for the NHANES III
population for both sexes), our estimate of β of 0.0184
predicts a lowest to highest quintile relative risk of
3.02, which is not very different from the estimates of
Wasswa-Kintu et al. [11].
Conclusions
Our review confirms the strong association between
reduced FEV1 and increased risk of lung cancer. The
strength of the association is very consistent, with our
32 estimates of β showing remarkably little variation,
given the variety of ways in which the source papers presented their results. Based on our results, we estimate
that each 10% decrease in FEV1%P is associated with a
20% (95% CI 17%-23%) increase in lung cancer risk.
Additional files
Additional file 1: Quality. DOC file which describes the components of
the Newcastle-Ottawa study quality scoring system, shows the scores
allocated to each study, and for some scores gives the reason the study
scored as negative. Scores relate to eight items - 1: “representativeness of
the exposed cohort”, 2: “selection of the non-exposed cohort”, 3:
“ascertainment of exposure”, 4: “demonstration that the outcome of interest
was not present at start of the study”, 5: “comparability of the cohorts on
the basis of design or analysis”, 6: “assessment of outcome”, 7: “was followup long enough for outcomes to occur”, and 8: “adequacy of follow up of
cohorts”. Apart from item 5, which is scored as 0, 1 or 2, each item is
scored as 0 or 1, so the total possible score for a study is 9.
Additional file 2: Others. DOC file summarizes the results for the four
studies which satisfied the inclusion/exclusion criteria but were later
rejected as estimates of β could not be derived.
Additional file 3: Fit. DOC file giving, for each of the blocks considered
in Table 4 that include more than two levels, a plot by decline in FEV1%P
of the observed RRs (with 95% CIs) and the RRs fitted based on the value
of β for that block. The fitted value of β and its SE are shown in the
heading for the block.
Abbreviations
CI: Confidence Interval; d.f.: Degrees of Freedom; FEV1: Forced Expiratory
Volume in 1 second; FEV1%P: FEV1 expressed as a percentage of predicted;
FVC: Forced Vital Capacity; NHANES: National Health and Nutrition
Examination Surveys; REF: 6 character Reference code used to identify a
study; RR: Relative Risk; SE: Standard error.
Page 14 of 15
Competing interests
PNL, founder of P.N.Lee Statistics and Computing Ltd., is an independent
consultant in statistics and an advisor in the fields of epidemiology and
toxicology to a number of tobacco, pharmaceutical and chemical
companies. This includes Philip Morris Products S.A., the sponsor of this
study. JSF and JSH are employees of P.N.Lee Statistics and Computing Ltd.
Authors’ contributions
JSF and PNL were responsible for planning the study. Literature searches
were carried out by PNL and KJC. Data entry was carried out by JSH and
checked by PNL or JSF. The statistical analyses were conducted by JSF along
lines discussed and agreed with PNL. PNL drafted the paper, which was then
critically reviewed by JSF and JSH. All authors read and approved the final
manuscript.
Acknowledgements
We thank Philip Morris Products S.A. who funded the work. However the
opinions and conclusions of the authors are their own, and do not
necessarily reflect the position of Philip Morris Products S.A. We thank
Katharine Coombs for assistance with the literature searches. We also thank
Pauline Wassell, Diana Morris and Yvonne Cooper for assistance in typing the
various drafts of the paper and obtaining the relevant literature.
Received: 11 June 2012 Accepted: 25 October 2012
Published: 27 October 2012
References
1. Calabrò E, Randi G, La Vecchia C, Sverzellati N, Marchianò A, Villani M,
Zompatori M, Cassandro R, Harari S, Pastorino U: Lung function predicts
lung cancer risk in smokers: a tool for targeting screening programmes.
Eur Respir J 2010, 35:146–151.
2. Eberly LE, Ockene J, Sherwin R, Yang L, Kuller L: Pulmonary function as a
predictor of lung cancer mortality in continuing cigarette smokers and
in quitters. Int J Epidemiol 2003, 32:592–599.
3. Hole DJ, Watt GCM, Davey-Smith G, Hart CL, Gillis CR, Hawthorne VM:
Impaired lung function and mortality risk in men and women: findings
from the Renfrew and Paisley prospective population study. BMJ 1996,
313:711–715.
4. Islam SS, Schottenfeld D: Declining FEV1 and chronic productive cough in
cigarette smokers: a 25-year prospective study of lung cancer incidence
in Tecumseh, Michigan. Cancer Epidemiol Biomarkers Prev 1994, 3:289–298.
5. Lange P, Nyboe J, Appleyard M, Jensen G, Schnohr P: Ventilatory function
and chronic mucus hypersecretion as predictors of death from lung
cancer. Am Rev Respir Dis 1990, 141:613–617.
6. Mannino DM, Buist AS, Petty TL, Enright PL, Redd SC: Lung function and
mortality in the United States: data from the First National Health and
Nutrition Examination Survey follow up study. Thorax 2003, 58:388–393.
7. Nomura A, Stemmermann GN, Chyou P-H, Marcus EB, Buist AS: Prospective
study of pulmonary function and lung cancer. Am Rev Respir Dis 1991,
144:307–311.
8. Peto R: The Oxford overview of cholesterol-lowering trials: cause-specific
mortality rates. In Low Blood Cholesterol: Health Implications. Edited by
Lewis B, Paoletti R, Tikkanen MJ. London: Current Medical Literature;
1993:29–30.
9. Skillrud DM, Offord KP, Miller RD: Higher risk of lung cancer in chronic
obstructive pulmonary disease: a prospective, matched, controlled
study. Ann Intern Med 1986, 105:503–507.
10. Tockman MS, Anthonisen NR, Wright EC, Donithan MG: Airways
obstruction and the risk for lung cancer. Ann Intern Med 1987,
106:512–518.
11. Wasswa-Kintu S, Gan WQ, Man SFP, Dare PD, Sin DD: Relationship between
reduced forced expiratory volume in one second and the risk of lung
cancer: a systematic review and meta-analysis. Thorax 2005, 60:
570–575.
12. Wells GA, Shea B, O'Connell D, Peterson J, Welch V, Losos M, Tugwell P: The
Newcastle-Ottawa Scale (NOS) for assessing the quality of nonrandomised
studies in meta-analyses.: Ottawa Health Research Institute; 2010. http://
www.ohri.ca/programs/clinical_epidemiology/oxford.asp?status=print.
13. Berlin JA, Longnecker MP, Greenland S: Meta-analysis of epidemiologic
dose–response data. Epidemiology 1993, 4:218–228.
Fry et al. BMC Cancer 2012, 12:498
/>
14. Fry JS, Lee PN: Revisiting the association between environmental tobacco
smoke exposure and lung cancer risk. I. The dose–response relationship
with amount and duration of smoking by the husband. Indoor + Built
Environment 2000, 9:303–316.
15. Gardner MJ, Altman DG: Statistics with confidence. Confidence intervals and
statistical guidelines. London: British Medical Journal; 1989.
16. Hamling J, Lee P, Weitkunat R, Ambühl M: Facilitating meta-analyses by
deriving relative effect and precision estimates for alternative
comparisons from a set of estimates presented by exposure level or
disease category. Stat Med 2008, 27:954–970.
17. US Department of Health and Human Services: National health and nutrition
examination survey (NHANES). National Center for Health Statistics; http://
www.cdc.gov/nchs/nhanes.htm.
18. Hankinson JL, Odencrantz JR, Fedan KB: Spirometric reference values from
a sample of the general U.S. population. Am J Respir Crit Care Med 1999,
159:179–187.
19. Carta P, Cocco PL, Casula D: Mortality from lung cancer among Sardinian
patients with silicosis. Br J Ind Med 1991, 48:122–129.
20. Speizer FE, Fay ME, Dockery DW, Ferris BG Jr: Chronic obstructive
pulmonary disease mortality in six US cities. Am J Respir Crit Care Med
1989, 140:S49–S55.
21. Stavem K, Aaser E, Sandvik L, Bjornholt JV, Erikssen G, Thaulow E, Erikssen J:
Lung function, smoking and mortality in a 26-year follow-up of healthy
middle-aged males. Eur Respir J 2005, 25:618–625.
22. Egger M, Davey Smith G, Schneider M, Minder C: Bias in meta-analysis
detected by a simple, graphical test. BMJ 1997, 315:629–634.
23. Beaty TH, Newill CA, Cohen BH, Tockman MS, Bryant SH, Spurgeon HA:
Effects of pulmonary function on mortality. J Chronic Dis 1985,
38:703–710.
24. Chau N, Benamghar L, Pham QT, Teculescu D, Rebstock E, Mur JM:
Mortality of iron miners in Lorraine (France): relations between lung
function and respiratory symptoms and subsequent mortality. Br J Ind
Med 1993, 50:1017–1031.
25. Chien JW, Au DH, Barnett MJ, Goodman GE: Spirometry, rapid FEV1
decline, and lung cancer among asbestos exposed heavy smokers. COPD
2007, 4:339–346.
26. Cullen MR, Barnett MJ, Balmes JR, Cartmel B, Redlich CA, Brodkin CA,
Barnhart S, Rosenstock L, Goodman GE, Hammar SP, et al: Predictors of
lung cancer among asbestos-exposed men in the β-carotene and retinol
efficacy trial. Am J Epidemiol 2005, 161:260–270.
27. Finkelstein MM: Clinical measures, smoking, radon exposure, and risk of
lung cancer in uranium miners. Occup Environ Med 1996, 53:697–702.
28. Hanlon P, Walsh D, Whyte BW, Scott SN, Lightbody P, Gilhooly MLM: The
link between major risk factors and important categories of admission in
an ageing cohort. J Public Health Med 2011, 22:81–89.
29. Harber P, Oren A, Mohsenifar Z, Lew M: Obstructive airway disease as a
risk factor for asbestos-associated malignancy. J Occup Med 1986,
28:82–86.
30. Kuller LH, Ockene JK, Meilahn E, Svendsen K: Relation of forced expiratory
volume in one second (FEV1) to lung cancer mortality in the Multiple
Risk Factor Intervention Trial (MRFIT). Am J Epidemiol 1990, 132:265–274.
31. Maldonado F, Bartholmai BJ, Swensen SJ, Midthun DE, Decker PA, Jett JR:
Are airflow obstruction and radiographic evidence of emphysema risk
factors for lung cancer?: a nested case–control study using quantitative
emphysema analysis. Chest 2010, 138:1295–1302.
32. Mannino DM, Aguayo SM, Petty TL, Redd SC: Low lung function and
incident lung cancer in the United States. Data from the First National
Health and Nutrition Examination Survey follow-up. Arch Intern Med 2003,
163:1475–1480.
33. Menotti A, Conti S, Giampaoli S, Mariotti S, Signoretti P: Coronary risk
factors predicting coronary and other causes of death in fifteen years.
Acta Cardiol 1980, 35:107–120.
34. Menotti A, Mariotti S, Seccareccia S, Giampaoli S: The 25 year estimated
probability of death from some specific causes as a function of twelve
risk factors in middle aged men. Eur J Epidemiol 1988, 4:60–67.
35. Peto R, Speizer FE, Cochrane AL, Moore F, Fletcher CM, Tinker CM, Higgins
ITT, Gray RG, Richards SM, Gilliland J, et al: The relevance in adults of airflow obstruction, but not of mucus hypersecretion, to mortality from
chronic lung disease. Results from 20 years of prospective observation.
Am Rev Respir Dis 1983, 128:491–500.
Page 15 of 15
36. Pham QT, Gaertner M, Mur JM, Braun P, Gabiano M, Sadoul P: Incidence of
lung cancer among iron miners. Eur J Respir Dis 1983, 64:534–540.
37. Purdue MP, Gold L, Järvholm B, Alavanja MC, Ward MH, Vermeulen R:
Impaired lung function and lung cancer incidence in a cohort of
Swedish construction workers. Thorax 2007, 62:51–56.
38. Schottenfeld D: COPD increases risk of lung cancer in smokers
[Medigram]. Am Fam Physician 1992, 45:2728.
39. Tammemagi MC, Lam SC, McWilliams AM, Sin DD: Incremental value of
pulmonary function and sputum DNA image cytometry in lung cancer
risk prediction. Cancer Prev Res 2011, 4:552–561.
40. van den Eeden SK, Friedman GD: Forced expiratory volume (1 second)
and lung cancer incidence and mortality. Epidemiology 1992, 3:253–257.
41. Vestbo J, Rasmussen FV: The single breath nitrogen test, mortality, and
cancer. Am Rev Respir Dis 1990, 142:1022–1025.
42. Vestbo J, Knudsen KM, Rasmussen V: Are respiratory symptoms and
chronic airflow limitation really associated with an increased risk of
respiratory cancer? Int J Epidemiol 1991, 20:375–378.
43. Wiles FJ, Hnizdo E: Relevance of airflow obstruction and mucus
hypersecretion to mortality. Respir Med 1991, 85:27–35.
44. Wilson DO, Weissfeld JL, Balkan A, Schragin JG, Fuhrman CR, Fisher SN,
Wilson J, Leader JK, Siegfried JM, Shapiro SD, et al: Association of
radiographic emphysema and airflow obstruction with lung cancer. Am J
Respir Crit Care Med 2008, 178:738–744.
45. Orsini N, Li R, Wolk A, Khudyakov P, Spiegelman D: Meta-analysis for linear
and nonlinear dose–response relations: examples, an evaluation of
approximations, and software. Am J Epidemiol 2012, 175:66–73.
46. Fletcher C, Peto R, Tinker C, Speizer FE: The natural history of chronic
bronchitis and emphysema. An eight-year study of early chronic obstructive
lung disease in working men in London. Oxford. New York, Toronto: Oxford
University Press; 1976.
doi:10.1186/1471-2407-12-498
Cite this article as: Fry et al.: Systematic review with meta-analysis of
the epidemiological evidence relating FEV1 decline to lung cancer risk.
BMC Cancer 2012 12:498.
Submit your next manuscript to BioMed Central
and take full advantage of:
• Convenient online submission
• Thorough peer review
• No space constraints or color figure charges
• Immediate publication on acceptance
• Inclusion in PubMed, CAS, Scopus and Google Scholar
• Research which is freely available for redistribution
Submit your manuscript at
www.biomedcentral.com/submit