Estimates of introgression as a function of pairwise distances
Bạn đang xem bản rút gọn của tài liệu. Xem và tải ngay bản đầy đủ của tài liệu tại đây (922.9 KB, 11 trang )
(2019) 20:207
Pfeifer and Kapan BMC Bioinformatics
/>
METHODOLOGY ARTICLE
Open Access
Estimates of introgression as a function
of pairwise distances
Bastian Pfeifer1 and Durrell D. Kapan2*
Abstract
Background: Research over the last 10 years highlights the increasing importance of hybridization between species
as a major force structuring the evolution of genomes and potentially providing raw material for adaptation by natural
and/or sexual selection. Fueled by research in a few model systems where phenotypic hybrids are easily identified,
research into hybridization and introgression (the flow of genes between species) has exploded with the advent of
whole-genome sequencing and emerging methods to detect the signature of hybridization at the whole-genome or
chromosome level. Amongst these are a general class of methods that utilize patterns of single-nucleotide
polymorphisms (SNPs) across a tree as markers of hybridization. These methods have been applied to a variety of
genomic systems ranging from butterflies to Neanderthals to detect introgression, however, when employed at a fine
genomic scale these methods do not perform well to quantify introgression in small sample windows.
Results: We introduce a novel method to detect introgression by combining two widely used statistics: pairwise
nucleotide diversity dxy and Patterson’s D. The resulting statistic, the distance fraction (df ), accounts for genetic
distance across possible topologies and is designed to simultaneously detect and quantify introgression. We also
relate our new method to the recently published fd and incorporate these statistics into the powerful genomics
R-package PopGenome, freely available on GitHub (pievos101/PopGenome) and the Comprehensive R Archive
Network (CRAN). The supplemental material contains a wide range of simulation studies and a detailed manual how
to perform the statistics within the PopGenome framework.
Conclusion: We present a new distance based statistic df that avoids the pitfalls of Patterson’s D when applied to
small genomic regions and accurately quantifies the fraction of introgression (f ) for a wide range of simulation
scenarios.
Keywords: Genomics, Introgression, Hybridisation, SNPs
Background
Hybridization between species is increasingly recognized
as a major evolutionary force. Although long known to
occur in plants, evidence is mounting that it regularly
occurs in many animal groups [1]. Generally thought
to decrease differences between two species by sharing
alleles across genomes, hybridization can paradoxically
act as a ready source of variation, impacting adaptation
[2, 3], aiding in evolutionary rescue [4], promoting range
expansion [5], leading to species divergence [6, 7] and
ultimately fueling adaptive radiation [8, 9]. The advent
*Correspondence:
Department of Entomology and Center for Comparative Genomics, Institute
for Biodiversity Science and Sustainability, California Academy of Sciences, 55
Music Concourse Dr., San Francisco, USA
Full list of author information is available at the end of the article
2
of whole genome sequencing has prompted the development of a number of methods to detect hybridization
across the genome (recently summarized in Payseur and
Rieseberg [10])
One class of methods involves quantifying single
nucleotide polymorphism (SNP) patterns to detect
hybridization between taxa. Here we focus on this class of
tests involving four taxa. The most widely used of these,
Patterson’s D, was first introduced by Green et al. [11]
and further developed by Durand et al. [12]. Patterson’s
D compares allele patterns of taxa with the Newick tree
(((P1,P2),P3),O), to detect introgression between archaic
taxon 3 (P3) and in-group taxon 1 (P1) or 2 (P2 or viceversa). In brief, assuming the outgroup O is fixed for
allele A, derived alleles (B) in P3, when shared with either
P2 or P1, act as a marker of introgression leading to
© The Author(s). 2019 Open Access This article is distributed under the terms of the Creative Commons Attribution 4.0
International License ( which permits unrestricted use, distribution, and
reproduction in any medium, provided you give appropriate credit to the original author(s) and the source, provide a link to the
Creative Commons license, and indicate if changes were made. The Creative Commons Public Domain Dedication waiver
( applies to the data made available in this article, unless otherwise stated.
Pfeifer and Kapan BMC Bioinformatics
(2019) 20:207
the following patterns: ABBA or BABA respectively. An
excess of either pattern, ABBA or BABA represents a difference from the 50:50 ratio expected from incomplete
lineage sorting and thus represents a signal that can be
used to detect introgression.
Since its introduction, Patterson’s D has been used for
a wide range of studies to estimate the overall amount of
hybrid ancestry by summing the ABBA or BABA pattern
excess on a whole genome scale starting with studies of
Neanderthals and archaic humans [11, 12]. In the past 7 years,
Patterson’s D has been increasingly used to localize regions o
f hybrid ancestry, not only in archaic humans [13] but also in
species including butterflies, plants and snakes [14–16].
Currently, Patterson’s D is frequently used in sliding
window scans of different regions of the genome [17–19].
However, intensive evaluations of the four-taxon ABBABABA statistics [20] showed that this approach can lead
to many false positives in regions of low recombination
and divergence. One of the main reasons is the presence
of mainly one of the two alternative topologies as a consequence of a lack of independence of adjacent genomic
regions [20], resembling an introgression event, which
is exacerbated when analyzing smaller gene-regions. To
circumvent this issue, several strategies have been developed. On one side, more sophisticated non-parametric
methods have been used to reduce the number of false
positives (e.g., Patterson et al. [21]). On the other side, new
statistics have been developed to better estimate the proportion introgression. Martin et al. [20] recently proposed
the fd estimate based on the f estimates (e.g. fG , fhom )
originally developed by Green et al. [11] which measure
the proportion of unidirectional introgression from P3
to P2. Specifically, fd assumes that maximal introgression
will lead to equally distributed derived allele frequencies
in the donor and the recipient population and therefore utilizes the higher derived allele frequency at each
variant site. This strategy aims to model a mixed population maximally affected by introgression. However, this
approach has two major shortcomings: First, it is designed
to sequentially consider introgression between the archaic
population P3 and only one ingroup taxa (P1 or P2).
Second, the accuracy of measuring the fraction of introgression strongly depends on the time of gene-flow.
Here we combine the approaches of the four-taxon tests
with genetic distance to derive a statistic, the distance
fraction (df ), that estimates the proportion of introgression on a four-taxon tree which strictly ranges from -1
to 1, has symmetric solutions, can be applied to small
genomic regions, and is less sensitive to variation in the
time of gene-flow than fd .
Approach
To derive df we took a two-fold approach. First, we
reformulated Patterson’s D, and fd in terms of genetic
Page 2 of 11
distances based on the hypothesis that past or recent
hybridization will leave a signature of reduced dxy between
taxa [18, 22]. Second, we account for non-introgressed
histories by incorporating distances from species tree
patterns into the denominator.
First, following convention, A and B denote ancestral
and derived alleles respectively. Derived allele frequencies
of the four taxa are p1k . . . p4k at variant site k. Second,
dxyk is the average pairwise nucleotide diversity (genetic
distance) between population x and y at variant site k.
Each genetic distance can be expressed as a sum of patterns in terms of ancestral and derived alleles allowing the
terms ABBA and BABA to be rewritten in terms of genetic
distances.
Patterson’s D statistic as a function of pairwise distances
Here we derive the Patterson’s D statistic as a function
of pairwise genetic distance between taxon x and taxon y
(dxy ). Following [23] the genetic distance dxy is defined as
dxyk
1
=
nx ny
nx
ny
πijk
i=1 j=1
at a given variant site k, where nx is the number of individuals in population x and ny is the number of individuals
in population y. Then at site k, πij = 1 ∨ 0 is the boolean
value indicating that the individual i of population x and
the individual j of population y contains the same variant
(0) or not (1). Following [12, 21] instead of pattern counts,
allele frequencies can be used as an unbiased estimator.
Given only bi-allelic sites (SNPs) the genetic distances dxy
can be formulated as a function of allele frequencies (p) as
follows:
d12k = p1k (1 − p2k ) + (1 − p1k )p2k
d13k = p1k (1 − p3k ) + (1 − p1k )p3k
d23k = p2k (1 − p3k ) + (1 − p2k )p3k
If we define a as the ancestral allele frequency (1 − p) and
b as the derived allele frequency (p) then
d12k = b1k a2k + a1k b2k
d13k = b1k a3k + a1k b3k
d23k = b2k a3k + a2k b3k
Note, the fourth taxon (outgroup) is used to define the
ancestral state a.
While incorporating the species tree pattern BBAA, the
introgression patterns ABBA and BABA can be re-written
in terms of allele frequencies:
ABBAk :=[ (b1k b2k a3k a4k + a1k b2k b3k a4k )
− (b1k b2k a3k a4k + b1k a2k b3k a4k )
+ (b1k a2k b3k a4k + a1k b2k b3k a4k )] /2
(2019) 20:207
Page 3 of 11
BABAk :=[ (b1k b2k a3k a4k + b1k a2k b3k a4k )
where π3k is the average pairwise nucleotide diversity
within population P3 at site k. The terms p3k · d13k may be
interpreted as the contribution of population 3 to the variation contained between the lineages 1 to 3 (subtracting
the contribution of population 1 contained in population 3). Following Martin et al. [20] fd is defined as fd =
S(P1,P2,P3,O)
S(P1,PD,PD,O) where PD is the population (2 or 3) with the
higher derived allele frequency at each variant position.
Here the denominator is:
Pfeifer and Kapan BMC Bioinformatics
− (b1k b2k a3k a4k + a1k b2k b3k a4k )
+ (b1k a2k b3k a4k + a1k b2k b3k a4k )] /2
Using distances (dxy ) from above, these patterns can
then be expressed as:
ABBAk =[ p2k · d13k − p1k · d23k + p3k · d12k ] ·(1 − p4k )/2
BABAk =[ p1k · d23k − p2k · d13k + p3k · d12k ] ·(1 − p4k )/2
Finally, this leads to the following distance based Patterson’s D equation for a region containing L variant
positions:
D=
L
k=1 ABBAk
L
k=1 ABBAk
− BABAk
+ BABAk
=
L
k=1 p2k · d13k
L
k=1 p3k
− p1k · d23k
· d12k
Martin’s fd estimator
We can apply the same distance logic to rewrite the fd
statistic. Following the example above for D we start with
the definition of the statistic fhom [11] upon which fd is
based. The basic idea of the fhom estimate is that complete
introgression would lead to complete homogenization of
allele frequencies. Here it is assumed that introgression
goes from P3 to P2, therefore:
S(P1, P2, P3, O)
S(P1, P3, P3, O)
where the numerator is the same as Patterson’s D:
L
p2k · d13k − p1k · d23k
S(P1, P2, P3, O) =
k
and the denominator can be formulated by substituting P2
with P3,
L
p3k · d13k − p1k · π3k
S(P1, P3, P3, O) =
k
=
(1)
In the context of distances p2k · d13k may be seen as
the contribution of the variation contained between the
lineages 1 to 3 (d13k ) to population 2.
As seen from Eq. (1) the Patterson’s D denominator
(ABBA + BABA) simplifies to an expression of the derived
allele frequency of the archaic population P3 times the
average pairwise nucleotide diversity (dxy ) between population P1 and P2. This interpretation highlights the original difficulty that Patterson’s D has handling regions of
low diversity since the denominator will be systematically
reduced in these areas due to the d12k variable; increasing the overall D value. This effect intensifies when at
the same time the divergence from the donor population
P3 is high. Martin et al. [20] proposed fd which corrects
for this by considering the higher derived allele frequency
(P2 or P3) at each given variant position; systematically
increasing the denominator.
fhom =
S(P1, PD, PD, O) =
L
k pDk
L
k pDk
· d1Dk − p1k · dDDk
(2)
· d1Dk − p1k · πDk
Leading to the statistic:
fd =
L
k=1 p2k
L
k=1 pDk
· d13k − p1k · d23k
· d1Dk − p1k · πDk
(3)
where in the denominator, πDk is the nucleotide diversity
within population PD, which is the population with the
higher derived allele frequency (P2 or P3) for each variant site k. The difference between the fhom statistic versus
fd is that there is no assumption in the latter about the
direction of introgression.
The distance based interpretations (above) for SNP
based introgression statistics Patterson’s D and fd suggest
that it would be beneficial to derive estimators for the proportion of introgression that are free from the problem of
reduced diversity. Here we propose a very simple statistic we call the distance fraction (df ), that makes direct
use of the distance based numerator of the Patterson’s D
statistic and relates the differences of distances to the total
distance considered (Fig. 1) by incorporating the BBAA
species tree pattern into the denominator. The species
tree pattern BBAA contributes to increased divergence
between (P1,P2) and P3 in the absence of introgression.
As a consequence within our df framework, we explicitly
include the divergence to P3 on the four-taxon tree.
The df estimator
In distance terms we may interpret the ABBA and BABA
patterns as polarized shared distances (shared distance
between two taxa caused by the derived alleles) on a 4taxon tree. ABBA for example can be interpreted as the
polarized shared distance between (P2,P3) and P1, where
BABA is the polarized shared distance between (P1,P3)
and P2. Thus, ABBA is a signal of shared increased distance to P1 and BABA is a signal of shared increased
Pfeifer and Kapan BMC Bioinformatics
(2019) 20:207
Page 4 of 11
a
b
c
d
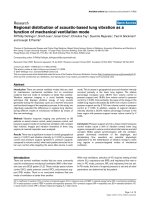
Fig. 1 A graphical interpretation of the df estimate. The distance fraction (df ) estimates the fraction of introgression (f) by relating the differences of
the genetic distances between taxa, here hi-lit by path lengths between ingroup taxa (d13 = light blue, d23 = dark blue) to the overall sum of the path
lengths to the archaic population P3 taking into account derived alleles resulting in a change of path length distance. a. The four-taxon (P1, P2, P3
and O) species tree (gray) with coalescence at nodes denoted as P12, P123 and P123O. Path length P12-P123 helps visualize the scale of relative
distance between taxa and signifies the shared distance of P1 and P2 to P3. b. Illustrates introgression from P3 to P2, here marked by derived alleles
arising in and replacing the P3 lineage after the split leading to P12 (black dot). c. Without introgression d13 = d23 and resulting in df = 0 (left a & c).
d. Introgression of derived alleles reduces genetic distance between P2 and P3 at the time of gene-flow (tGF ) causing d23 < d13 and df to be
positive (right b & d). Note, allele replacement in example (b, d) corresponds to SNP pattern ABBA. The df estimate relates the reduced distance
caused by introgression to the total sum of path length distances after introgression. A mutation on the P12-P123 path corresponds to the SNP
pattern BBAA and signifies shared distance
distance to P2. This leads naturally to the distance based
numerator that is the same as Patterson’s D statistic
Eq. (1).
However, for the denominator, in order to relate those
distances to the distances which are not a signal of
introgression, the BBAA pattern must to be taken into
account, because the species tree captures the third way
in which exactly two populations can share derived alleles. According to the interpretations given above, the
BBAA species tree pattern can be seen as the polarized shared distances of (P1,P2) to P3. We incorporate this pattern to refine two classes given the system
described above:
• Class 1: The contribution of derived alleles in P2 to
distance (ABBA+BBAA).
• Class 2: The contribution of derived alleles in P1 to
distance (BABA+BBAA).
The union of both classes includes all possible patterns producing distances on a 4-taxon tree by shared
derived alleles. Thus, to incorporate all these distances,
those representing the BBAA pattern must be added to
the denominator, df can be written as:
L
(ABBAk + BBAAk ) + (BABAk + BBAAk )
(4)
k=1
L
=
p2k · s13k + p1k · d23k
k=1
For a given region including L variant sites.
A decreased BBAA polarized shared distance and an
increased polarized shared distance ABBA is a signal of
P3 ↔ P2 introgression. When at the same time the BABA
signal reduces we have a maximal support for the ABBA
signal.
To hi-light the exclusive distances due to introgression
the df statistic we propose here has the following form:
df =
L
k=1 p2k
L
k=1 p2k
· d13k − p1k · d23k
· d13k + p1k · d23k
(5)
Pfeifer and Kapan BMC Bioinformatics
(2019) 20:207
In distance terms, df may be interpreted as the difference
of the distances from P1 and P2 to the archaic population
P3 that is caused by introgression (Fig. 1). The transformation of the denominator back into the basic Patterson’s D
statistic form suggests adding the given species tree BBAA
pattern to the ABBA and BABA class respectively; which
can be reasonably assumed to be the most likely pattern
in the absence of introgression for a given species tree
(((P1,P2),P3),O). With these patterns in hand it becomes
possible to distinguish between signals of introgression
and non-introgression. It should be noticed, however, that
the df equation still produces some extreme values when
e.g the derived allele frequency p1 or p2 is zero (often
true when block-size is small). To mitigate this issue, we
encourage the user to apply Laplace smoothing in genomic
scan applications. In this case the derived allele frequency
n+2
p is simply replaced by p =
k=1 π + 1 /(n + 2) for
population P1 and P2 and dxy is updated accordingly. The
parameter π is a boolean variable and equals to 1 when
a derived allele is present. Thus, we simply add a derived
allele and an ancestral allele to the populations P1 and
P2. We have implemented Laplace smoothing for df as a
feature in PopGenome.
Simulation study
To evaluate the performance of the df we used a simulation set-up following Martin et al. [20]. The Hudson’s
ms program [24] was used to generate the topologies with
different levels of introgression and the seq-gen program
[25] to generate the sequence alignments upon which to
compare the performance of the three main statistics discussed in this paper, Patterson’s D (D), fd and df . The
baseline simulation is shared with [20] and is performed
as follows:
ms 32 1 -I 4 8 8 8 8 -ej 1 2 1 -ej 2
3 1 -ej 3 4 1 -es 0.1 2 0.9 -ej 0.1 5 3
-r 50 5000 -T | tail -n + 4 | grep -v
// > treefile
The above Unix call produces the trees and stores them
into a file (treefile). Next, we will store the number of trees
in an object called partitions.
partitions=($(wc -I treefile))
With these parameters as an input we are now able to
call the seq-gen program to generate the actual sequences
and we store the results into a file called seqfile.
seq-gen -mHKY -I 5000 -s 0.01 -p
$partitions < treefile > seqfile
These example calls generate a 5kb sequence with 8
samples for each of the four populations (-I) with split
times P12=1 × 4N, P123=2 × 4N and P123O=3 × 4N
generations ago (-ej). The time of gene-flow (tGF ) is set
to 0.1 × 4N generations ago with a fraction of introgression of f = 0.1 (-es). The recombination rate is r =
Page 5 of 11
0.01 (-r) and the Hasegawa-Kishino-Yano model substitution model was applied with a branch scaling factor of
s = 0.01 (-s). Note, we have created a GitHub repository (pievos101/Introgression-Simulation) including more
example calls and add the option to use the R-package
PopGenome to directly apply the proposed statistics to
simulated datasets.
Simulations were varied across a wide range of parameters such as distance to ancestral population, time of
gene flow, recombination, ancestral population size and
the effect of low variability, window size and sample size
as detailed in the Additional file 1: Section S1. These simulations had the following in common: for each fraction of
introgression f =[ 0, 0.1, . . . , 0.9, 1], we simulated 100 loci,
we calculated D, fd and df and assessed their performance
with three standard statistics: adjusted R2 (a measure of
the ’goodness of fit’), the ’sum of squares due to lack of
fit’ (SSLF) the sum of squared distances from the mean
value for each fraction of introgression estimated to the
real fraction of introgression, and the ’pure sum of squares
error’ (SSPE) the sum of squared distances between each
simulated value and the mean value for that simulation.
It should be noted that we simulate P2 ↔ P3 introgression to be able to compare the results of the proposed df
method with the fd estimate. However, df can naturally
measure the fraction of introgression in both directions;
with P2 ↔ P3 introgression df indicated by positive values (e.g. Fig. 1, change in distance due to shared ABBA
pattern) and in the case of P1 ↔ P3 introgression negative values (BABA, not illustrated). Thus, assessing the
accuracy in case of P2 ↔ P3 introgression applies also for
P1 ↔ P3 introgression.
To further test df , we evaluated the performance to
detect introgression by simulating 10,000 neutral loci
(f = 0) and 1000 loci subject to introgression (following the parameters outlined in the above example).
We interpreted the results using a receiver operating
characteristic curve (ROC) analysis that evaluates the
area under the curve (AUC), a measure that summarizes
model performance, the ability to distinguish introgression from the neutral case, calculated with the R-package
pROC [26].
We also show the application of our method to
real data by calculating df for 50 kb consecutive
windows on the 3L arm of malaria vectors in the
Anopheles gambiae species complex [17]. In order to
detect chromosome-wide outliers we tested the null
hypotheses df = 0 outside of the inversion, and inside
the inversion df = df since the inversion was previously
identified as a negative outlier [17]. The analysis was done
using a weighted block jackknife to generate Z-values.
The corresponding P values were corrected for multiple testing using the Benjamini-Hochberg false discovery
Pfeifer and Kapan BMC Bioinformatics
(2019) 20:207
rate (FDR) method [27]. This analysis is easily replicated by following the example in the Additional file 1:
Section S2.
Page 6 of 11
All of these analyses were done in the R-package
PopGenome [28], that efficiently calculates df (and other
statistics including fd , the recently published two-taxon
a
b
c
d
Fig. 2 Accuracy of statistics to measure the fraction of introgression. The comparison of simulated data with a known fraction of introgression using
ms versus the statistics (y-axis). We simulated 100 loci for every fraction of introgression f =[ 0, 0.1, . . . 0.9, 1] and plotted the distribution of the
corresponding statistic outcomes. A window size of 5kb and a recombination rate of r=0.01 was used. The background histories (coalescent events,
see insets) are a P12=1 × 4N, P123=2 × 4N, P123O=3 × 4N generations ago. b P12=1 × 4N, P123=2 × 4N, P123O=3 × 4N generations ago. c
P12=1 × 4N, P123=1 × 4N, P123O=3 × 4N generations ago. d P12=1 × 4N, P123=1 × 4N, P123O=3 × 4N generations ago. Introgression directions
are P3 → P2 (a,c) and P2 → P3 (b,d) tGF = 0.1 × 4N generations ago. Colors: fd (grey), df (orange) Patterson’s D (light blue) and the real fraction of
introgression (red dashed lines). The calls to the ms program can be found in the caption of Additional file 1: Table S1.1
Pfeifer and Kapan BMC Bioinformatics
(2019) 20:207
Page 7 of 11
RNDmin method [29] and the original Patterson’s D) from
the scale of individual loci to entire genomes.
Results
We performed extensive simulations varying distance
to ancestral populations, time of gene flow, recombination, ancestral population size, the effect of low variability, window size and sample size. We found that df
outperforms or is essentially equivalent to the fd estimate
to measure the real fraction of introgression for most of
the studied ranges of simulation cases. Overall, because
it captures natural variation in the denominator, df has
slightly higher variances compared to fd while the mean
values are often the least biased as shown by the sum of
squares due to lack of fit, yet it provides the best (or nearly
equivalent) estimates to fd as judged by the goodness of fit
in almost all cases (Additional file 1: Section S1).
The effect of background history and ancestral population
sizes
Simulations under a variety of distances to ancestral populations (coalescent times) show that df is
the most accurate estimator for the real fraction of
introgression, including under the different coalescent
events simulated for both directions of introgression
(Fig. 2, Table 1). Following behind df is fd , which
is more affected by differences in coalescent times.
In this comparison, Patterson’s D consistently overestimates the fraction of introgression (Fig. 2, Table 1).
This known effect [20] is greatest in the most common
case where the coalescent times differ between ingroup
taxa (P1,P2) and the archaic taxon P3 (Fig. 2a and b).
Table 1 The effect of the distance to ancestral population
Direction of gene-flow
Distance to ancestral
P2 → P3
P3 → P2
P2 → P3
1-2-3 (panel a)
1-2-3 (panel b)
1-1-3 (panel c)
1-1-3 (panel d)
b
One advantage of df compared to the other methods studied in this paper is that it is rarely affected by the time of
gene-flow (Fig. 3). This is due to the fact that, unlike fd , df
does not relate the signal of introgression to its maximum
calculated from the present. When gene flow occurs in
the distant past the denominator of fd estimates increases
leading to an underestimation of the fraction of introgression. The model fit shown by adjusted R2 of df is
consistently higher than fd (Fig. 3a), but more importantly,
at the same time the SSLF values are almost unaffected
by the time of gene-flow (Fig. 3b). Notably, we see the
same effect when introgression is from P2 → P3 (Additional file 1: Table S1.3) with df and fd both showing higher
adjusted R2 than Patterson’s D and a relatively low SSPE,
yet, unlike the other direction, both show an increase in
SSLF with time of gene-flow with fd greater than df .
fd
df
0.39
0.80
0.81a
1.41
0.09
0.00b
0.48
0.19
0.25c
0.40
0.78
0.77 a
0.70
0.54
0.30b
0.48
0.19
0.19c
The effect of recombination and low variability
0.77
0.70a
0.12
0.40
0.04b
0.60
0.17
0.35c
0.57
0.76
0.70a
0.12
0.42
0.05b
0.59
0.17
0.33c
We found that all three methods df , fd and Patterson’s
D become more accurate with increasing recombination
rates. This is due to the increase of independent sites of
a region analyzed. While df tends to have higher variances when the recombination rate is low it’s variance
is comparable to fd as soon as the recombination rate
increases (see Additional file 1: Table S1.4). We also varied the scaled mutation rate (θ ) to study the effect of low
mutational genomic variability. Overall, df and fd are only
slightly affected by that parameter, whereas in comparison
to the other methods df again showing the lowest SSLF
0.58
This table refers to Fig. 2 and displays some supporting values
the adjusted R2 ’goodness of fit’ (higher is better).
SSLF ’sum of squares due to lack of fit’ divided by the sample size n=100 (lower is
better).
c
SSPE ’pure sum of squares error’ (lower is better).
a
The effect of the time of gene-flow
D
t12 -t123 -t123O
P3 → P2
This effect is also slightly impacted by the direction of
introgression (e.g. lowered for P2 → P3 introgression,
see Fig. 2b and d, Table 1). However, for the case where
the ingroup taxa (P1,P2) and the archaic taxon P3 are
evolutionary very close, it should be noted that df essentially differs from the fd estimate (Table 1 and Additional
file 1: Table S1.1). In this specific case the SSPE of df
increases leading to a lower ’goodness of fit’ compared
to fd , while the SSLF are still notably low signifying a
very precise mean estimate of the real fraction of introgression. In an further analyses we varied the ancestral
population size (Additional file 1: Table S1.2). We observe
that an increasing size of the ancestral population of
P1 and P2 (N12) relative to N123 leads to higher fd
specific SSLF values while df again is nearly unaffected
in this parameter. Interestingly, the df specific SSPE values are affected by this setting resulting in an equivalent
or slightly lower adjusted R2 compared to fd . Notably, the
opposite is the case when decreasing the ancestral population size N12 relative to N123. In this case df shows higher
SSPE values than fd but in both cases, the adjusted R2 of
both statistics are high and much greater than those for
Patterson’s D as in other cases noted below.
Pfeifer and Kapan BMC Bioinformatics
(2019) 20:207
a
Page 8 of 11
The effect of window size and sample size
As expected df , fd and Patterson’s D are more accurate
with increasing genomic window size (varied from 0.5
kb to 50 kb, Fig. 4), however the latter performs much
a
b
b
c
c
Fig. 3 The effect of time of gene-flow. For P3 → P2 introgression we
varied the time of gene-flow (tGF =0.1, 0.3, 0.5, 0.7 ×4N) and calculated
for each statistic (D, fd and df ) a the adjusted R2 ’goodness of fit’. b
SSLF ’sum of squares due to lack of fit’ divided by the sample size
n=100. c SSPE ’pure sum of squares error’. A window size of 5kb and a
recombination rate of r=0.01 was used. The background history is:
P12=1 × 4N, P123=2 × 4N and P123O=3 × 4N generations ago. The
calls to the ms program can be found in the caption of Additional
file 1: Table S1.3
values and with its goodness of fit (adjusted R2 ) slightly
outperforming fd (see Additional file 1: Table S1.5), while
Patterson’s D, as in the other cases, performs more poorly
than the other statistics in this comparison.
Fig. 4 The effect of window size. For P3 → P2 introgression we varied
window sizes (0.5, 1, 5, 10, 50 kb) and calculated for each statistic (D, fd
and df ) a the adjusted R2 ’goodness of fit’. b SSLF ’sum of squares due
to lack of fit’ divided by the sample size n=100. c SSPE ’pure sum of
squares error’. The recombination rate is r = 0.01. The background
history is: P12=1 × 4N, P123=2 × 4N and P123O=3 × 4N generations
ago. Time of gene-flow is set to tGF = 0.1 × 4N generations ago. The
calls to the ms program can be found in the caption of Additional
file 1: Table S1.6
Pfeifer and Kapan BMC Bioinformatics
(2019) 20:207
more poorly than the former statistics. As the window size
increased both df and fd show a nearly identical pattern
of increasing goodness of fit (adjusted R2 from approximately 0.6 - 0.9 respectively) and corresponding near zero
SSLF (with df slightly outperforming fd ) and a decreasing SSPE, (with fd slightly outperforming df at the two
smallest window sizes; Fig. 4, Additional file 1: Table S1.6).
Both df and fd perform satisfactorily at all windows sizes
tested. In contrast, the Patterson’s D shows a poor goodness of fit, a much larger SSLF and for the two smallest
window sizes, a much larger SSPE. Note sample size had
very little effect overall (Additional file 1: Table S1.7).
On the ability to detect introgression
In this simulation scenario df and the fd estimate show
nearly the same utility (higher is better) for the fraction of introgression and distance to ancestral population
(Additional file 1: Section S2); but both greatly outperform
the Patterson’s D statistic especially for smaller genomic
regions. We also included the recently published RNDmin
[29] method in this latter analysis; this alternative only
gives good results when the signal of introgression is very
strong (Additional file 1: Section S2). In addition, unlike
fd , df is able to quantify the proportion of admixture symmetrically (P3 ↔ P2 and P3 ↔ P1) thus simplifying the
analysis of real genomic data on a 4-taxon system.
Application
Figure 5 shows df for 50kb consecutive windows on the 3L
arm of malaria vectors in the Anopheles gambiae species
complex confirming the recently detected region of introgression found in an inversion [17]. Outliers detected both
inside and outside the inversion are shown in Table 2.
Overall, we found 9 significant outliers outside the
inversion and two outliers within the inversion based on
a 0.05 significance level (see Fig. 5). This further reduces
to 7 significant outliers outside the inversion and one
Page 9 of 11
remaining outlier within the inversion when tested against
a 0.01 significance level (see Table 2).
These analyses were all performed within the R package
PopGenome [28] and can be easily reproduced with the
code given in the Additional file 1: Section S3.
Discussion
In the last 8 years there has been an explosion of population genomic methods to detect introgression. The
Patterson’s D method, based on patterns of alleles in
a four-taxon comparison, has been widely applied to a
variety of problems that differ from those for which it was
originally developed. This statistic can be used to assess
whether or not introgression is occurring at the whole
genome scale, however, Patterson’s D is best not applied to
smaller genomic regions or gene-scans as noted by Martin
et al. 2015.
The distance based approach proposed here has the
following strengths: First, the approach is based on characterizing changes in genetic distances that are a natural
consequence of introgression. Second, distance measured
by dxy allows direct comparisons of quantities that are easily interpreted. Third, the distance fraction, df , accurately
predicts the fraction of introgression over a wide-range
of simulation parameters. Furthermore, the df statistic
is symmetric (like Patterson’s D) which makes it easy to
implement and interpret. Yet, df outperforms Patterson’s
D in all cases (the latter shows a strong positive bias)
and df also outperforms or is equivalent to fd in nearly
all cases judged by the goodness of fit and the sum of
squares due to lack of fit. Furthermore, unlike fd , df does
not vary strongly with the time of gene-flow. This latter
strength comes from incorporating the shared genetic distance to taxon 3 (P3) into the denominator, serving to
scale df relative to dxy values between the three species
in the comparisons. Ultimately this makes the statistic less
subject to extreme values due to low SNP diversity (low
Fig. 5 Anopheles gambiae 3La inversion. Confirming introgression on the 3L arm of the malaria vector Anopheles gambiae (Fontaine et al. 2015,
Fig. 4). The area between the vertical dashed lines delineate the introgressed chromosomal inversion. We used the R-package PopGenome to scan
the chromosome with 50kb consecutive windows and plotted the df values along the chromosome (Laplace smoothed). Orange boxes indicate
outlier windows below a significance level of 0.05 and red boxes show outlier windows on the basis of a 0.01 significance level. The p-values were
corrected for multiple testing by the Benjamini-Hochberg method
Pfeifer and Kapan BMC Bioinformatics
(2019) 20:207
Page 10 of 11
Table 2 Significant outliers detected on the Anopheles gambiae
3La chromosome
Mb (start)
Mb (end)
df
Z
0.90
0.95
0.45
2.05*
1.05
1.10
0.53
2.41**
4.55
4.60
0.41
1.87*
7.20
7.25
-0.65
-2.92**
7.25
7.30
-0.98
-4.45**
7.45
7.50
-0.60
-2.73**
21.85
21.90
-0.90
-5.91**
23.30
23.35
-0.48
-2.45*
26.25
26.30
0.24
2.28**
36.45
36.50
-0.68
-6.42**
38.65
38.70
-34
-3.22**
*
a
0.05 significance level
0.01 significance level
**
b
genetic distances), as evidence by lower values than other
statistics in our examples.
There are several areas where further improvements
could be made. Although the distance based derivation of
all three statistics is sound, and df is empirically supported
by simulation, further mathematical analysis for this general class of distance estimators is desired. Like other
statistics under consideration in this paper, df depends
on resolved species tree with a particular configuration
of two closely related species, a third species and an
outgroup, and therefore it is not directly applicable to
other scenarios. In addition, both the fd and df perform
less accurately when measuring the proportion of admixture when the gene-flow occurs from P2 to P3. On the
other hand, our simulations show (Fig. 6) the asymmetrical effect of gene-flow direction on genetic distance: geneflow from P3 to P2 does not affect the distance between
taxon 1 & 3 (d13 ), however, the opposite it true when introgression from P2 to P3 occurs, the distance between taxon
1 & 2 (d12 ) is not affected. This suggests comparisons of
dxy within given genomic regions may contain signal to
infer the direction of introgression and therefore more
accurately measure the proportion of admixture.
Overall, the distance based interpretation of introgression statistics suggests a general framework for estimation of the fraction of introgression on a known tree
and may be extended in a few complementary directions
including the use of model based approaches to aid
in outlier identification and potentially model selection.
The distance based framework introduced here may
lead to other further improvements by measuring how
genetic distance changes between different taxa as a
Fig. 6 The effect of introgression on pairwise distances. The effect of
the fraction of introgression on the average pairwise distance
measurements d12 , d13 and d23 . a The effect is shown for P3 → P2
introgression. b Shows the effect in case of P2 → P3 introgression.
The background history is: P12=1 × 4N, P123=2 × 4N and
P123O=3 × 4N generations ago. Time of gene-flow is set to
tGF = 0.1 × 4N generations ago. The calls to the ms program can be
found in the example from the methods section
function of hybridization across different parts of the
genome.
Conclusion
Here we present both a simplified distance based interpretation for Patterson’s D and Martin et al.’s fd and a
new distance based statistic df that avoids the pitfalls of
Pfeifer and Kapan BMC Bioinformatics
(2019) 20:207
Patterson’s D when applied to small genomic regions and
is more accurate and less prone to vary with variation in
the time of gene flow than fd . We propose df as an estimate of introgression which can be used to simultaneously
detect and quantify introgression. We implement df (as
well as the other four-taxon statistics, fd , and the original Patterson’s D) in the powerful R-package, PopGenome
[28], now updated to easily calculate these statistics for
individual loci to entire genomes.
Additional file
Additional file 1: Section S1 On the Accuracy to Measure the Real
Fraction of Introgression. Section S2 Detecting Introgression from Whole
Genome Data. Section S3 PopGenome Usage. (PDF 275 kb)
Abbreviations
FDR: False discovery rate (Benjamini-Hochberg method) R2 : Adjusted R2 (a
measure of ‘goodness of fit’) SSLF: Sum of squares due to lack of fit (a measure
of bias) SSPE: Pure sum of squares error SNPs: Single-nucleotide
polymorphisms
Acknowledgements
We would like to thank Bettina Harr, Matthew Hansen, Jim Henderson, Karl
Lindberg, Paul Staab, Sebastian E. Ramos-Onsins, the California Academy of
Sciences genomics discussion group and the IMI journal club for helpful
discussions.
Funding
This work was supported by National Science Foundation DBI grant 1427772
to Kapan.
Availability of data and materials
An updated PopGenome package including the methods presented in this
paper is available for download from a GitHub repository ( />pievos101/PopGenome). R-code to reproduce the simulations can be found at
PopGenome can also
be found on the Comprehensive R Archive Network (CRAN). The mosquito
data set (Fontaine et al. 2015, Fig. 4) can be downloaded from https://
datadryad.org/resource/doi:10.5061/dryad.f4114. This research was shared on
the bioRxiv preprint server: />Authors’ contributions
BP and DDK designed the project. BP developed the methods and performed
the simulations. BP and DDK wrote the manuscript. Both authors read and
approved the final manuscript.
Ethics approval and consent to participate
Not applicable.
Consent for publication
Not applicable.
Competing interests
The authors declare that they have no competing interests.
Publisher’s Note
Springer Nature remains neutral with regard to jurisdictional claims in
published maps and institutional affiliations.
Author details
1 Institute for Medical Informatics, Statistics and Documentation, Medical
University, Graz, Austria. 2 Department of Entomology and Center for
Comparative Genomics, Institute for Biodiversity Science and Sustainability,
California Academy of Sciences, 55 Music Concourse Dr., San Francisco, USA.
Received: 24 July 2018 Accepted: 18 March 2019
Page 11 of 11
References
1. Mallett J. Hybridization reveals the evolving genomic architecture of
speciation. Trends Ecol Evol. 2005;20:229–37.
2. Gilbert LE. Adaptive novelty through introgression in Heliconius wing
patterns: evidence for shared genetic “tool box” from synthetic hybrid
zones and a theory of diversification. In: Boggs CL, Watt W, Ehrlich P,
editors. Ecology and Evolution Taking Flight: Butterflies as Model Systems.
Chicago: University of Chicago Press; 2003. p. 281–318.
3. Hedrick PW. Adaptive introgression in animals: examples and comparison
to new mutation and standing variation as sources of adaptive variation.
Mol Ecol. 2013;22:4606–18.
4. Stelkens RB, et. al. Hybridization facilitates evolutionary rescue. Evol Appl.
2014;7:1209.
5. Pfennig KS, Kelly AL, Pierce AA. Hybridization as a facilitator of species
range expansion. Proc R Soc Lond Ser B. 2016;283:.
6. Mallett J. Hybrid speciation. Nature. 2007;446:279–83.
7. Abbott R, Albach S, Arntzen JW, Baird SJE, Bierne N, et. al. Hybridization
and speciation. J Evol Biol. 2013;26:229–46.
8. Seehausen O. Hybridization and adaptive radiation. Trends Ecol Evol.
2004;16:198–207.
9. Meier JI, Marques DA, Mwaiko S, et. al. Anciencrapid cichlid fish adaptive
radiations. Nat Comm. 2017;8:14363.
10. Payseur BA, Rieseberg LH. A genomic perspective on hybridization and
speciation. Mol Ecol. 2016;25:2337–60.
11. Green RE, Krause J, Briggs AW, et. al. A draft sequence of the neandertal
genome. Science. 2010;328:710–22.
12. Durand EY, Patterson N, Reich D, M S. Testing for ancient admixture
between closely related populations. Mol Biol Evol. 2011;28:2239–52.
13. Racimo F, Sankararaman S, Nielsen R, Huerta-Sanchez E. Evidence for
archaic adaptive introgression in humans. Nat Rev Genet. 2015;16:359–71.
14. Dasmahapatra, et. al. (Heliconius Genome Consortium):Butterfly genome
reveals promiscuous exchange of mimicry adaptations among species.
Nature. 2012;487:94–8.
15. Eaton DAR, Ree RH. Inferring phylogeny and introgression using radseq
data: An example from flowering plants (pedicularis: Orobanchaceae).
Syst Biol. 2013;62:689–706.
16. Zinenko O, Sovic M, Joger U, Gibbs HL. Hybrid origin of european vipers
(vipera magnifica and vipera orlovi) from the caucasus determined using
genomic scale dna markers. BMC Evol Biol. 2016;16:76.
17. Fontaine MC, Pease JB, Steele A, et. al. Extensive introgression in a
malaria vector species complex revealed by phylogenomics. Science.
2015;347:1258524.
18. Kronforst MR, Hansen MEB, Crawford NG, et. al. Hybridization reveals the
evolving genomic architecture of speciation. Cell Rep. 2013;5:666–77.
19. Zhang W, Dasmahapatra KK, Mallet J, Moreira G, Kronforst MR.
Genome-wide introgression among distantly related heliconius butterfly
species. Genome Biol. 2016;17:.
20. Martin SH, Davey JW, Jiggins CD. Evaluating the use of abba-baba
statistics to locate introgressed loci. Mol Biol Evol. 2015;32:244–57.
21. Patterson N, Moorjani P, Luo Y, et. al. Ancient admixture in human
history. Genetics. 2012;192:1065–93.
22. Smith J, Kronforst MR. Do heliconius butterfly species exchange mimicry
alleles ?. Biol Lett. 2013;9:20130503.
23. Wakeley J. The variance of pairwise nucleotide differences in two
populations with migration. Theor Popul Biol. 1996;49:39–57.
24. Hudson RR. Generating samples under a wright-fisher neutral model of
genetic variation. Bioinformatics. 2002;18:337–8.
25. Rambaut A, Grass N. Seq-gen: an application for the monte carlo
simulation of dna sequence evolution along phylogenetic trees.
Bioinformatics. 1997;13:235–8.
26. Robin X, et. al. proc: an open-source package for r and s+ to analyze and
compare roc curves. BMC Bioinformatics. 2011;12:77.
27. Benjamin J., Hochberg Y. Controlling the false discovery rate: a practical
and powerful approach to multiple testing. J R Stat Soc Ser B Methodol.
1995;57:289–300.
28. Pfeifer B, Wittelsbuerger U, Ramos-Onsins SE, Lercher M. Popgenome:
an efficient swiss army knife for population genomic analyses in r. Mol
Biol Evol. 2014;31:1929–36.
29. Rosenzweig BK, Pease JB, Besansky NJ, Hahn MW. Powerful methods for
detecting introgressed regions from population genomic data. Mol Ecol. 2016.