The research on gene-disease association based on text-mining of PubMed
Bạn đang xem bản rút gọn của tài liệu. Xem và tải ngay bản đầy đủ của tài liệu tại đây (1.17 MB, 8 trang )
Zhou and Fu BMC Bioinformatics (2018) 19:37
/>
RESEARCH ARTICLE
Open Access
The research on gene-disease association
based on text-mining of PubMed
Jie Zhou* and Bo-quan Fu
Abstract
Background: The associations between genes and diseases are of critical significance in aspects of prevention,
diagnosis and treatment. Although gene-disease relationships have been investigated extensively, much of the
underpinnings of these associations are yet to be elucidated.
Methods: A novel method integrates MeSH database, term weight (TW), and co-occurrence methods to predict
gene-disease associations based on the cosine similarity between gene vectors and disease vectors. Vectors are
transformed from the texts of documents in the PubMed database according to the appearance and location of
the gene or disease terms. The disease related text data has been optimized during the process of constructing
vectors.
Results: The overall distribution of cosine similarity value was investigated. By using the gene-disease association
data in OMIM database as golden standard, the performance of cosine similarity in predicting gene-disease linkage
was evaluated. The effects of applying weight matrix, penalty weights for keywords (PWK), and normalization were
also investigated. Finally, we demonstrated that our method outperforms heterogeneous network edge prediction
(HNEP) in aspects of precision rate and recall rate.
Conclusions: Our method proposed in this paper is easy to be conducted and the results can be integrated with
other models to improve the overall performance of gene-disease association predictions.
Keywords: MeSH, TF-IDF, Text mining, Human disease
Background
In the medical research, an understanding of the association between genes and diseases is a crucial step toward
prevention, diagnosis, and therapy of diseases. Although
such gene-disease relationships have been investigated in
many studies, the complex mechanism from genotype to
phenotype and details of the genetic basis for diseases
are still unrevealed. Furthermore, identifying all possible
relationships by wet experimental methods are currently
too expensive and time-consuming to be a feasible approach in consideration. To fill this gap, the
bioinformatics-based approach may provide some candidate gene-disease linkages before employing large-scale
population based epidemiological analysis.
In the recent decades, data-mining approaches, include the graph, machine learning, and text mining
* Correspondence:
Guangdong Key Laboratory of Computer Network, School of Computer
Science and Engineering, South China University of Technology, Guangzhou
510006, China
methods, had been proposed to study the gene-disease
association [1–8]. Based on graph theory, the graph
method constructs graphical models and several algorithms have been proposed like neighbor association [1],
shortest path [2, 3], walking model [4], random surfer
model [5], and network propagation model [6]. However,
the power of the graph method may be limited in investigating less-studied genes or diseases [7, 8]. The machine learning method (MLM) explores associations
between characteristic vectors reduced from genes and
diseases. However, due to the specificity and structure of
the data format used in MLM, a high quality data is required. In addition, to our knowledge, there is no best
method for formatting or quantifying data, especially,
disease data. As a consequence, the general application
of MLM in deciphering gene-disease associations may
be limited due to the availability of source data.
Text mining method had been applied in studying
various biological problems like functional genomics [9],
© The Author(s). 2018 Open Access This article is distributed under the terms of the Creative Commons Attribution 4.0
International License ( which permits unrestricted use, distribution, and
reproduction in any medium, provided you give appropriate credit to the original author(s) and the source, provide a link to
the Creative Commons license, and indicate if changes were made. The Creative Commons Public Domain Dedication waiver
( applies to the data made available in this article, unless otherwise stated.
Zhou and Fu BMC Bioinformatics (2018) 19:37
biological pathways [10], protein-protein interactions
[11], protein representation [12], drug-gene association
[13], comparative toxicogenomics [14, 15], neuropsychiatric disorder [16], and other areas in the biomedical domain [17] including large-scale bioinformatics analyses
[8, 18–32]. DISEASES predicted the association through
the co-occurrence method [21]. MimMiner [28] transformed OMIM [29] text to a relationship matrix and
quantified the association among diseases using the term
frequency–inverse document frequency method (TFIDF). CATAPULT [8] and Heterogeneous Network Edge
Prediction (HNEP) [30] integrated the graphic model
and machine learning method, IMC [31] used a semisupervised machine learning method, and LGscore [32]
associated genes with disease through a Google search
engine to predict associations between genes and
diseases.
However, these methods did not integrate other valuable information that can be curated from other databases, such as MeSH, to improve accuracy or efficiency
[27]. Moreover, the gene-disease co-occurrence ratio is
usually low and this leads to a huge amount of text
document sets needed to be curated to achieve the effective sample size. Therefore, in this study, we demonstrate an efficient data mining approach of deciphering
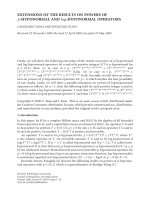
gene-disease association by integrating the MeSH database and TF-IDF methods (Fig. 1). We transformed keywords in the dictionary to describe each of 3288 genes
and 445 diseases, respectively, in a vector form and measured associations between genes and diseases using cosine similarity. The prediction performance was
evaluated based on the accuracy and recall. Finally, our
method was compared with HNEP [30] (Fig. 2).
Methods
Public data sources
The gene-disease linkages, including genes’ ID and disease names were curated from OMIM. Among all genes
and diseases from OMIM, a total of 3288 genes and 445
diseases were also found in MeSH and used for analysis.
Fig. 1 Use of keywords in the dictionary to describe genes and diseases
Page 2 of 8
The dictionary and the text document set were constructed according to MeSH and the content of abstract
in PubMed, respectively. Although there were 16 categories at the first level of MeSH, we only used 5 categories, anatomy, organisms, diseases, chemicals and
drugs, and psychiatry and psychology, of gene-disease
associations relevant to construct the vector. Text files
which not related with genes or diseases were removed.
In total, the dictionary contained 27,453 keywords mapping to 56,341 nodes in MeSH. The text document set
contained 528,878 associated with 3288 genes and
1,435,091 text files associated with 445 diseases,
respectively.
Data preprocessing
The relationship between N keywords was represented
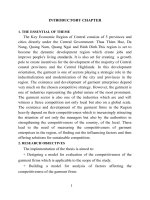
as the matrix form in N x N dimension and each element represented the association strength between keywords. The detailed steps are depicted schematically in
Fig. 2.
Text file vector construction
Each text file was transformed into three vectors, the
vector of title, the vector of sentences in the abstract,
and the vector of MeSH terms, respectively. The vectors
of title represented the frequency of keywords occurred
in the title. The vectors of sentences in the abstract represented sentences in the abstract. The vector of MeSH
terms was coded binary: 1, if the keyword occurred, and
0, if not. Three vectors were then combined into one
representative vector of the text file by the cooccurrence method (Table 1). We assigned a higher
weight value for MeSH terms because these data had
already been carefully annotated with respect to genedisease relationships. Similarly, the gene-disease association based on their co-occurrence in the title would be
stronger than the association based on sentences in the
abstract. To reduce the bias article length, we normalized the representative vector by scaling the sum of all
values of the text vector to 1.
Zhou and Fu BMC Bioinformatics (2018) 19:37
Page 3 of 8
Fig. 2 Flow chart representing the data processing steps
Term weight (TW) of keyword
We calculated the inverse document frequency (IDF) of
keyword (eq. 1)
sffiffiffiffiffiffiffiffiffiffiffi
1
IDF i ¼ P
ð1Þ
wi
in which i represents keyword and ∑wi represents the
sum of weighted values.
IDF was used to represent the importance of a keyword in aspects of gene or disease. If a keyword occurred more frequently among vectors, the IDF of this
keyword would be smaller. We calculate penalty weights
for keywords, PWKi, to weight the distance of a keyword
to the MeSH root as eq. 2:
&
PWK i ¼
2T i −5 ðT i < 5Þ
ðT i >¼ 5Þ
1
ð2Þ
where Ti represents the depth of the keyword in the
MeSH tree.
If a keyword occurred at 5th or higher levels, no penalty it was applied. Otherwise, the weight would decrease
to half in each level. The final weight value of the
Table 1 Weight values for the vector combination in this study
Vectors
Weight
Weight of abstract vectors
with corresponding gene/disease
in sentence
Weight of abstract vectors
without corresponding gene/disease
in sentence
Weight of MeSH
terms vectors
In MeSH terms
3
3
2
3
In title
2
2
1
3
In abstract
1
2
1
2
Zhou and Fu BMC Bioinformatics (2018) 19:37
Page 4 of 8
keyword was calculated as the product of IDF and PWK
(eq. 3):
TW i ¼ IDF i Á PWK i
ð3Þ
Constructions of gene and disease vectors and correlation
measurement
We transformed each gene into the vector form, Vg, and
the entry of the vector represented the association between the gene and the keyword in the dictionary (eq.
4). As a consequence, the dimension of a vector is the
number of keywords contained in the dictionary. For
each gene, the sum of values correspondent to keywords
in all text vectors was multiplied by TWi of keywords
corresponded to these genes. Disease vectors were transformed in the same approach, Vd. A total of 3288 gene
vectors and 445 disease vectors were transformed and
used to predict gene-disease linkages.
The correlation between gene (Vg) and disease (Vd)
was measured by cosine similarity (eq. 4):
cos < V g ; V d >¼
Vg Á Vd
j Vg j Á j Vd j
ð4Þ
The precision of prediction was defined as:
P ðx Þ ¼
È
É
j ðg; dÞ : cos < V g ; V d > ≥ x ∩fðg; dÞ : ðg; dÞ∈K g j
È
É
; 0 ≤ x≤ 1
j ðg; dÞ : cos < V g ; V d > ≥x j
In which, {(g, d) : cos < Vg,Vd > ≥ x}represents all
gene-disease pairs with angle smaller than x and {(g,
d) : (g, d) ∈ K}represents the union set of known genedisease linkages. As a consequence, P(x) represents the
proportion of known gene-disease linkages among all
gene-disease pairs with angle smaller than x.
The recall of prediction was defined as:
Rðx Þ ¼
È
É
j ðg; d Þ : cos < V g ; V d > ≥ x ∩fðg; dÞ : ðg; d Þ∈K g j
; 0 ≤x≤ 1
j fðg; d Þ : ðg; dÞ∈K g j
R(x) represents the proportion of known gene-disease
linkages with angle smaller than x among all known
gene-disease linkages.
Results
The overall distribution of cosine similarity value
A total of 1,407,672 values of cosine similarity between
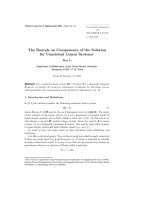
3288 gene vectors and 445 disease vectors were calculated. The distribution of cosine values was shown in the
Fig. 3. There were over 67% with cosine values < 0.01
and over 83% that were < 0.02. The distribution of cosine similarities of gene-disease pair showed that, in general, most genes were not associated with diseases. This
distribution also demonstrated that for each disease,
only a few of genes might be related with it respectively.
Fig. 3 The distribution of cosine similarity of gene-disease pairs. The
distribution of cosine similarities of 1,407,672 gene-disease pairs is
shown in the pie plot. Gene-disease pairs were binned according
their cosine similarities
Evaluating the performance of cosine similarity in
predicting gene-disease linkage
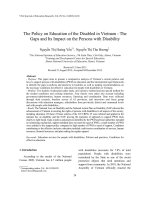
First, we investigated the relationship between cosine
similarity and precision rate. As results shown in the
Fig. 4a, the precision rate increased with increments in
cosine similarity. In addition, when cosine similarity was
greater than 0.5, the precision remained stable around
0.6. Among the gene-disease pairs with cosine similarity
greater than 0.5, over half of them were annotated in the
OMIM database. Furthermore, there were only 2 genedisease pairs with cosine similarity smaller than 0.9 and
both of them were also annotated as known linkages.
This demonstrated that the predictability of cosine similarity in aspect of the gene-disease linkage. Fig. 4b showed
the proportion of labeled gene-disease associations with
cosine similarity greater than x among different cosine
similarity ranges. The proportion of OMIM-annotated
gene-disease associations increased with cosine similarity.
Figure 4c shows that the recall rate decreases with increasing cosine similarity and it also demonstrated the
discriminant power of cosine similarity in predicting genedisease linkages. Figure 4d shows the tradeoff relationship
between precision rate and recall rate.
The effects of applying weight matrix, PWK, and
normalization
The effects of applying the weight matrix in the text
vectorization step were shown in Fig. 5a and b. Results
showed that the precision rate was marginally improved
with the weight matrix when cosine similarity value was
greater than 0.3 or recall rate was smaller than 0.4. Because the region with high precision rate or low recall
Zhou and Fu BMC Bioinformatics (2018) 19:37
Page 5 of 8
Fig. 4 The relationship between precision rate, recall rate, and cosine similarity. a The precision rate increases with increasing cosine similarity. b
The proportion of labeled gene-disease associations among different cosine similarity ranges is shown. c The relationship between recall rate and
cosine similarity is shown. d The tradeoff between precision and recall is shown
rate is more meaningful in aspect of gene-disease linkage
prediction, applying the weight matrix is meaningful in
improving the prediction performance.
The effects of applying PWK in penalizing the depth
of the keyword in the MeSH were shown in the Figs. 5c
and d. Keywords without specificity may introduce more
error while not information and, as a consequence, decreased the power and accuracy of prediction. PWK penalized keywords without specificity in terms of disease
association and decreased the effects of these keywords.
Although results also showed that without PWK penalization the precision was marginally higher in genedisease pairs with higher cosine similarity, the precision
rate with PWK penalization was higher in the low recall
rate region, than the precision rate without PWK penalization (Fig. 5d). Nevertheless, these findings show that
the PWK penalization does improve the overall performance of gene-disease association prediction in high precision rate and low recall rate regions.
Comparisons of TF normalization methods were
shown in the Fig. 5e and f. Although, the precision rate
of applying the standardized normalization method was
stochastically higher than the precision rate of applying
the log-transformation method, it was caused by the
standardized normalization method enlarged the effects
of text documents containing fewer keywords while decreased the effects of text documents containing more
keywords. This may introduce a bias of overweighting
short text documents. As a consequence, we concluded
that the log-transformation method outperformed standardized normalization method in high precision rate
and low recall rate regions (Fig. 5f ).
Comparison with HNEP
We compared our method with HNEP method [30].
HNEP is a method that integrates the graphic model
and MLM to predict gene-disease linkages based on logistic regression analysis. We found that the precision
rate of our method was significantly higher than the precision rate of HNEP when the recall rate higher than 0.1
and marginally higher when the recall rate lower than
0.1 and (Fig. 6). As a consequence, we concluded that
out method outperformed the HNEP method in predicting gene-disease linkages.
Discussion
In this study, we predicted potential gene-disease linkages using text documents associated with gene names
or disease names in the PubMed, MeSH, and OMIM databases. We transformed keywords in the dictionary to
vectors to represent genes or diseases, respectively, and
then calculated the cosine similarity between gene vectors and disease vectors. Although we took PubMed as
the source data, our method could be generalized to
other database fields with records described by nature
language.
One of the novelty of our method is to consider the
specificity of the keyword. Remarkably, our method not
Zhou and Fu BMC Bioinformatics (2018) 19:37
Page 6 of 8
Fig. 5 The effects of applying weight matrix in the text vectorization step. The effects of applying weight matrix in the text vectorization step are
shown in the relationship between (a) precision rate and cosine similarity and (b) the precision and recall rates. The solid line represents results
obtained without using the weight matrix and the dashed line represents those obtained with the weight matrix. The effects of applying PWK in
penalizing the depth of the keyword in the MeSH are shown in the relationship between (c) precision rate and cosine similarity and (d) the
precision and recall rates. The solid line represents results obtained without PWK and the dashed line represents those obtained with PWK. The
effects of applying TF normalization are shown in the relationship between (e) precision rate and cosine similarity and (f) the precision and recall
rates. The solid line represents results obtained with TF normalization and the dashed line represents those without TF normalization
Fig. 6 Comparison with the Heterogeneous Network Edge Prediction
(HNEP) method. Our method was compared with the HNEP method
based on the precision-recall curve. The solid line represents the HNEP
method and the dashed line represents our method
only adapts the concept of TF-IDF that bridges genes
and diseases through term frequencies in the dictionary
but also reweight the keywords according to the MeSH
tree. The main reason is to penalize those keywords
without specificity meaning such as “family” which may
not happen frequently and still have high value in the
IDF. PWK will penalize the words without specificity
meaning because they are very close to the root of the
MeSH tree.
Although the DISEASES study [21] investigated cooccurrence of gene and disease in the text document, it
focused on analyzing known gene-disease linkages but
did not predict unknown gene-disease pairs. HNEP [30]
and CATAPULT [8] both provided prediction results but
they did not integrate text documents with their
methods. LGscore [32] focused on associations between
genes with less consideration about disease, limiting the
Zhou and Fu BMC Bioinformatics (2018) 19:37
application LGscore in only some specific diseases. Our
prediction method of gene-disease linkage, described in
this study, not only utilized information from text documents in PubMed and keywords in MeSH, but also considered the keyword frequency distribution to adjust the
weight matrix. As a consequence, our method can be
readily adapted to predict more gene-disease linkages,
even in the case of diseases that have not been widely
studied.
Gene-disease pairs with higher association predicted
by our method tended to overlap known gene-disease
pairs annotated by OMIM. As a consequence, genedisease pairs with high cosine similarity, especially those
without known annotation, may be valuable for further
investigating their association. Furthermore, based on
our results, the importance of associated genes could be
ranked in one specific disease and this gene rank may do
help to disease-associated gene exploration in the disease of interest. Also, a similar protocol for prioritization
of diseases when studying the impact of specific genes
can be performed using our method.
One potential general application of our method is
that not only text documents in PubMed, but also results of other studies, can be integrated into the current
graphic model. Such integration may yield a better performance for gene-disease association predictions. In
addition, one potential extension of our method is that
gene-gene or disease-disease associations could also be
inferred using our method.
Conclusion
In this study, we proposed a MLM of predicting potential gene-disease linkages by mining gene or disease related text documents and evaluated the performance of
prediction results by comparing the data with those of
another method, HNEP. Results of our prediction
method quantified potential gene-disease linkages. The
novelty of our method is based on the combination of
text mining and the graphic model. To our knowledge,
there is currently no graphic model involving the kind of
dataset described herein. As a consequence, our method
may provide new avenues for exploring gene-disease
linkages, improving prediction performance, and combining widely-used current graphic models.
Abbreviations
HNEP: Heterogeneous Network Edge Prediction; IDF: Inverse document
frequency; MLM: Machine learning method; TF-IDF: Term frequency–inverse
document frequency
Acknowledgements
None declared.
Funding
This study was supported in part by a grant from the Natural Science
Foundation of Guangdong Province (2015A030308017).
Page 7 of 8
Availability of data and materials
All the data and material were uploaded to />The-Research-on-Gene-Disease-Association-Based-on-Text-Mining-of-PubMed.
Authors’ contributions
JZ conceived and designed the experiments and was a major contributor in
writing the manuscript. BQF developed the prediction method,
implemented the experiments and analyzed the result. Both authors read
and approved the manuscript.
Ethics approval and consent to participate
Not applicable.
Consent for publication
Not applicable.
Competing interests
The authors declare that they have no competing interests.
Publisher’s Note
Springer Nature remains neutral with regard to jurisdictional claims in
published maps and institutional affiliations.
Received: 18 September 2017 Accepted: 29 January 2018
References
1. Oti M, Snel B, Huynen MA. Predicting disease genes using protein-protein
interactions. J Med Genet. 2006;43:691–8.
2. Radivojac P, Peng K, Clark WT, Peters BJ, Mohan A, Boyle SM. An integrated
approach to inferring gene-disease associations in humans. Proteins. 2008;
72:1030–7.
3. Franke L, van Bakel H, Fokkens L, de Jong ED, Egmont-Petersen M,
Wijmenga C. Reconstruction of a functional human gene network, with an
application for prioritizing positional candidate genes. Am J Hum Genet.
2006;78:1011–25.
4. Köhler S, Bauer S, Horn D, Robinson PN. Walking the interactome for
prioritization of candidate disease genes. Am J Hum Genet. 2008;82:949–58.
5. Navlakha S, Kingsford C. The power of protein interaction networks for
associating genes with diseases. Bioinformatics. 2010;26:1057–63.
6. Vanunu O, Magger O, Ruppin E, Shlomi T, Sharan R. Associating genes and
protein complexes with disease via network propagation. PLoS Comput
Biol. 2010;6(1):e1000641. />7. Li Y, Patra JC. Genome-wide inferring gene-phenotype relationship by
walking on the heterogeneous network. Bioinformatics. 2010;26:1219–24.
8. Singh-Blom UM, Natarajan N, Tewari A, Woods JO, Dhillon IS, Marcotte EM.
Prediction and validation of gene-disease associations using methods
inspired by social network analyses. PLoS One. 2013;8(5):e58977. https://doi.
org/10.1371/journal.pone.0058977.
9. Soldatos TG, Perdigão N, Brown NP, Sabir KS, O'Donoghue SI. How to learn
about gene function: text-mining or ontologies? Methods. 2015;74:3–15.
10. Trindade D, Orsine LA, Barbosa-Silva A, Donnard ER, Ortega JM. A guide for
building biological pathways along with two case studies: hair and breast
development. Methods. 2015;74:16–35.
11. Papanikolaou N, Pavlopoulos GA, Theodosiou T, Iliopoulos I. Protein-protein
interaction predictions using text mining methods. Methods. 2015;74:47–53.
12. Shatkay H, Brady S, Wong A. Text as data: using text-based features for
proteins representation and for computational prediction of their
characteristics. Methods. 2015;74:54–64.
13. Kissa M, Tsatsaronis G, Schroeder M. Prediction of drug gene associations
via ontological profile similarity with application to drug repositioning.
Methods. 2015;74:71–82.
14. Davis AP, Wiegers TC, Johnson RJ, Lay JM, Lennon-Hopkins K, SaraceniRichards C, et al. Text mining effectively scores and ranks the literature for
improving chemical-gene-disease curation at the comparative
toxicogenomics database. PLoS One. 2013;8:e58201.
15. Gonzalez GH, Tahsin T, Goodale BC, Greene AC, Greene CS. Recent
advances and emerging applications in text and data Mining for Biomedical
Discovery. Brief Bioinform. 2016;17:33–42.
Zhou and Fu BMC Bioinformatics (2018) 19:37
Page 8 of 8
16. Fontaine JF, Priller J, Spruth E, Perez-Iratxeta C, Andrade-Navarro MA.
Assessment of curated phenotype mining in neuropsychiatric disorder
literature. Methods. 2015;74:90–6.
17. Fleuren WW, Alkema W. Application of text mining in the biomedical
domain. Methods. 2015;74:97–106.
18. Van Landeghem S, De Bodt S, Drebert ZJ, Inzé D, Van de Peer Y. The
potential of text mining in data integration and network biology for plant
research: a case study on Arabidopsis. Plant Cell. 2013;25:794–807.
19. PolySearch2: a significantly improved text-mining system for discovering
associations between human diseases, genes, drugs, metabolites, toxins and
more. Nucleic Acids Res 2015;43(W1): W535-W542.
20. Ailem M, Role F, Nadif M, Demenais F. Unsupervised text mining for
assessing and augmenting GWAS results. J Biomed Inform. 2016;60:252–9.
21. Pletscher-Frankild S, Pallejà A, Tsafou K, Binder JX, Jensen LJ. DISEASES: text
mining and data integration of disease-gene associations. Methods. 2015;74:
83–9.
22. Garten Y, Tatonetti NP, Altman RB. Improving the prediction of
pharmacogenes using text-derived drug-gene relationships. Pac Symp
Biocomput. 2010:305–14.
23. Wu Y, Liu M, Zheng WJ, Zhao Z, Xu H. Ranking gene-drug relationships in
biomedical literature using latent Dirichlet allocation. Pac Symp Biocomput.
2012:422–33.
24. Tsai RT, Lai PT. Dynamic programming re-ranking for PPI interactor and pair
extraction in full-text articles. BMC Bioinformatics. 2011;12:60.
25. Müller H, Mancuso F. Identification and analysis of co-occurrence networks
with NetCutter. PLoS One. 2008;3(9):e3178. />pone.0003178. 1-16
26. Wang X, Gulbahce N, Yu H. Network-based methods for human disease
gene prediction. Brief Funct Genomics. 2011;10:280–93.
27. Frijters R, van Vugt M, Smeets R, van Schaik R, de Vlieg J, Alkema W.
Literature mining for the discovery of hidden connections between drugs,
genes and diseases. PLoS Comput Biol. 2010;6:e1000943. />1371/journal.pcbi.1000943. 1-11
28. Van Driel MA, Bruggeman J, Vriend G, Brunner HG, Leunissen JA. A textmining analysis of the human phenome. Eur J Hum Genet. 2006;14:535–42.
29. Johns Hopkins University. OMIM - Online Mendelian Inheritance in Man.
Nov 2015.
30. Himmelstein DS, Baranzini SE. Heterogeneous network edge prediction: a
data integration approach to prioritize disease-associated genes. PLoS
Comput Biol. 2015;11(7):e1004259. />1004259.
31. Natarajan N, Dhillon IS. Inductive matrix completion for predicting genedisease associations. Bioinformatics. 2014;30:i60–8.
32. Kim J, Kim H, Yoon Y, Park S. LGscore: a method to identify disease-related
genes using biological literature and Google data. J Biomed Inform. 2015;54:
270–82.
Submit your next manuscript to BioMed Central
and we will help you at every step:
• We accept pre-submission inquiries
• Our selector tool helps you to find the most relevant journal
• We provide round the clock customer support
• Convenient online submission
• Thorough peer review
• Inclusion in PubMed and all major indexing services
• Maximum visibility for your research
Submit your manuscript at
www.biomedcentral.com/submit