An information-theoretic approach to the modeling and analysis of whole-genome bisulfite sequencing data
Bạn đang xem bản rút gọn của tài liệu. Xem và tải ngay bản đầy đủ của tài liệu tại đây (2.32 MB, 23 trang )
Jenkinson et al. BMC Bioinformatics (2018) 19:87
/>
METHODOLOGY ARTICLE
Open Access
An information-theoretic approach to the
modeling and analysis of whole-genome
bisulfite sequencing data
Garrett Jenkinson1,2 , Jordi Abante1 , Andrew P. Feinberg2,3,4 and John Goutsias1*
Abstract
Background: DNA methylation is a stable form of epigenetic memory used by cells to control gene expression.
Whole genome bisulfite sequencing (WGBS) has emerged as a gold-standard experimental technique for studying
DNA methylation by producing high resolution genome-wide methylation profiles. Statistical modeling and analysis is
employed to computationally extract and quantify information from these profiles in an effort to identify regions of
the genome that demonstrate crucial or aberrant epigenetic behavior. However, the performance of most currently
available methods for methylation analysis is hampered by their inability to directly account for statistical dependencies
between neighboring methylation sites, thus ignoring significant information available in WGBS reads.
Results: We present a powerful information-theoretic approach for genome-wide modeling and analysis of WGBS
data based on the 1D Ising model of statistical physics. This approach takes into account correlations in methylation
by utilizing a joint probability model that encapsulates all information available in WGBS methylation reads and
produces accurate results even when applied on single WGBS samples with low coverage. Using the Shannon
entropy, our approach provides a rigorous quantification of methylation stochasticity in individual WGBS samples
genome-wide. Furthermore, it utilizes the Jensen-Shannon distance to evaluate differences in methylation
distributions between a test and a reference sample. Differential performance assessment using simulated and real
human lung normal/cancer data demonstrate a clear superiority of our approach over DSS, a recently proposed
method for WGBS data analysis. Critically, these results demonstrate that marginal methods become statistically
invalid when correlations are present in the data.
Conclusions: This contribution demonstrates clear benefits and the necessity of modeling joint probability
distributions of methylation using the 1D Ising model of statistical physics and of quantifying methylation
stochasticity using concepts from information theory. By employing this methodology, substantial improvement of
DNA methylation analysis can be achieved by effectively taking into account the massive amount of statistical
information available in WGBS data, which is largely ignored by existing methods.
Keywords: DNA methylation; Genome analysis; Information theory; Ising model; Methylation analysis; WGBS data
modeling and analysis
*Correspondence:
Whitaker Biomedical Engineering Institute, Johns Hopkins University,
Baltimore, MD, USA
Full list of author information is available at the end of the article
1
© The Author(s). 2018 Open Access This article is distributed under the terms of the Creative Commons Attribution 4.0
International License ( which permits unrestricted use, distribution, and
reproduction in any medium, provided you give appropriate credit to the original author(s) and the source, provide a link to the
Creative Commons license, and indicate if changes were made. The Creative Commons Public Domain Dedication waiver
( applies to the data made available in this article, unless otherwise stated.
Jenkinson et al. BMC Bioinformatics (2018) 19:87
Background
DNA methylation is a stable epigenetic mechanism that
chemically marks the DNA by adding methyl (CH3 )
groups at individual cytosines immediately adjacent to
guanines. Methylation marks are used to identify cell-type
specific aspects of gene regulation, since marks located
within a gene promoter or enhancer typically act to
repress gene transcription, whereas promoter or enhancer
demethylation is associated with gene activation. Notably,
patterns of methylation marks are highly polymorphic and stochastic [1] containing information about a
broad range of normal and aberrant biological processes,
such as development and differentiation, aging, and
carcinogenesis [2, 3].
Although several experimental assays have been
designed to map DNA methylation marks, whole-genome
bisulfite sequencing (WGBS) is increasingly becoming the
method of choice due to its high quantitative accuracy,
resolution, and genome-wide coverage [4]. Extraction
of methylation information from bisulfite data has led
to many parametric and non-parametric methods for
modeling, analysis, and interpretation [4, 5]. Most methods, however, ignore correlations, an important aspect
of methylation that has been observed within genomic
regions of several CpG dinucleotides, at least over small
distances [6–8]. Recent analysis methods for bisulfite
sequencing data take into account correlation information indirectly by smoothing marginal statistics [9–16],
or by post hoc corrections that empirically impose correlations among marginal statistics [17]. Other important
methods follow a more direct approach, but they have
only been designed to detect differential methylation in
data obtained by Illumina’s 450k arrays [18, 19], whose
continuous intensity measurements require fundamentally different models and methods, when compared to
discrete sequencing reads.
It has been recently observed that fully characterizing
the polymorphic and stochastic nature of DNA methylation requires specification of joint probability distributions of methylation patterns formed by sets of spatially
coupled CpG sites [20, 21]. Motivated by this important
observation, we recently introduced a DNA methylation
model based on the 1D Ising distribution of statistical
physics that directly takes into account correlations in
methylation [22]. We showed that this model leads to
a powerful approach to methylation analysis that allows
a comprehensive genome-wide treatment of methylation
stochasticity leading to a number of novel discoveries. By
generating realistic synthetic data that take into account
incomplete observations with given coverage (5-30×),
and by computing median estimates and 95% confidence
intervals for mean methylation levels and methylation
entropies using extensive Monte Carlo simulations, we
demonstrated in [22] that the empirical approach to joint
Page 2 of 23
methylation analysis used in [20] does not perform well
when dealing with highly stochastic methylation data.
Our Ising-based approach on the other hand results in
exceptional statistical performance when estimating mean
methylation levels and entropies, with their median values falling close to the true values and the 95% confidence
intervals being relatively tight around the true values, even
at low coverage.
Notably, an alternative statistical model has been
recently proposed in [23] for the distribution of methylation patters at any given locus of the genome using a
constrained multinomial model. However, this method is
limited to methylation data with higher coverage than
available in standard WGBS and results in modeling only
a subset of the genome analyzed by techniques such as
reduced representation bisulfite sequencing or captured
assays. Moreover, this technique, as well as the methods
proposed in [20, 21], cannot handle partial observations,
leading to sparse modeling of the genome, and are subject to the curse of dimensionality, a problem associated
with the exponential growth of model parameters that
must be estimated from large (and most often forbidding) amounts of data. Furthermore, these techniques
assign zero probabilities to unobserved methylation patterns despite their biological plausibility, which results
in underestimating the true biological heterogeneity of
methylation patterns [22].
In this paper, we focus on describing the algorithms that
enable the 1D Ising model to be applied on WGBS data.
We partition the genome into equally sized (in terms of
bp’s) non-overlapping regions and use the Ising model to
derive the probability mass function (PMF) of methylation within each genomic region, with each PMF specified by using only five parameters characteristic to the
region. We then present iterative algorithms that compute
and marginalize these PMFs, a crucial step for estimating the underlying parameters from WGBS data and for
computing measures of methylation level, stochasticity
and discordance. We subsequently discuss the problem
of parameter estimation using maximum-likelihood and
show identifiability of the parameters. We furthermore
present methods for inter-sample and differential methylation analysis and develop novel schemes for classifying
the methylation status in terms of methylation level and
entropy throughout the genome. We also develop a new
method for detecting differentially methylated regions
(DMRs) using an information-theoretic measure of distance between two probability distributions, as well as a
method for ranking epigenetically dysregulated genes in
a test/reference study with or without replicates. Finally,
by using simulated data, as well as three pairs of matched
human lung normal/cancer WGBS samples, we show
that our approach is superior when compared to DSS,
a state-of-the-art method for genome-wide differential
Jenkinson et al. BMC Bioinformatics (2018) 19:87
Page 3 of 23
methylation analysis of WGBS data [15, 16]. Moreover,
we provide clear evidence that metilene, a recently proposed method [24], cannot be reliably used for identifying
aberrant methylation in a test/reference setting, since the
statistical framework employed by this method is unable
to attribute detected differential methylation activity to
discordance in the test sample due to its high false positive
rate. Further analysis of our lung data illustrates the effectiveness of our approach in producing information about
the methylation status of the epigenome within different
genomic features and at multiple scales, extracted from
WGBS data in inter-sample or differential studies.
We refer to the proposed methodology as informME
(information-theoretic analysis of MEthylation), which
we have implemented using MATLAB, C++, and R in a
fully documented and publicly available software package that can be downloaded from GitHub (https://github.
com/GarrettJenkinson/informME).
Methods
DNA methylation model
By following [22], we consider in this paper a genome
comprising N CpG sites 1, 2, . . . , N, which we label
according to their order of appearance along the genome.
Since the biochemical reactions that establish and maintain methylation are inherently stochastic, we represent
the genome’s epigenetic state by an N × 1 binary-valued
random vector X whose n-th component Xn takes value
xn = 0, if the n-th CpG site is unmethylated, and
value xn = 1, if the site is methylated. We have argued
in [22] that a natural choice for the PMF PX (X) =
Pr[ X = x] of X is given by the 1D Ising model of statistical physics [25] with energy function − N
n=1 an (2xn − 1)
N
− n=2 cn (2xn − 1)(2xn−1 − 1). In this case,
PX (x) =
1
exp
Z
N
an (2xn − 1)
n=1
N
(1)
n − 1 and n. Notably, if cn = 0 for all n, then the previous Ising model characterizes statistically independent
methylation. Moreover, if an = a and cn = c for all n
(i.e., if the Ising parameters do not depend on location),
then we can show that, when a < 0 and c ≥ 0, the
most likely methylation state will be the fully unmethylated state, whereas, when a > 0 and c ≥ 0, the most
likely state will be the fully methylated state. Finally, when
a = 0 and c > 0, the most likely methylation state will be
either the fully unmethylated or the fully methylated state,
a behavior that is associated to methylation bistability.
The Ising model in (1) and (2) provides a joint PMF
that fully encapsulates the methylation state of all CpG
sites in the genome and represents a fundamentally different modeling paradigm from traditional tools that focus
on marginally modeling one CpG site at a time. InformME is based upon leveraging the higher-order statistical information contained in the Ising model to provide
information-theoretic quantities and insights that are fundamentally unavailable to marginal modeling methods or
to methods that empirically estimate the joint PMF of
methylation of a few CpG sites.
To compute the probability PX (x) of a methylation state
X, we need to estimate the 2N − 1 parameters an and cn
from WGBS data, which is a prohibitively large number of
parameters for reliable estimation. We address this problem by partitioning the genome into relatively small and
equally sized (in terms of bp’s) non-overlapping regions
R1 , R2 , . . ., and by setting
an = αk + βk ρn ,
and
cn =
ρn =
n=2
where
γk
,
dn
1
× # of CpG sites within ± 500 nucleotides
1000
downstream and upstream of n ,
(5)
N
Z=
an (2un − 1)
exp
u
n=1
N
(2)
cn (2un − 1)(2un−1 − 1)
+
(4)
within each region Rk , where αk , βk and γk are three
parameters characteristic to the genomic region, ρn is the
CpG density at the n-th CpG site, given by
cn (2xn − 1)(2xn−1 − 1) ,
+
(3)
n=2
is a constant known as the partition function. This model
is expressed in terms of the location-dependent parameters an and cn , with an accounting for intrinsic factors that
affect methylation at the n-th CpG site and cn accounting for methylation cooperativity between the CpG sites
and dn is the distance of the n-th CpG site from its nearestneighbor CpG site n − 1, given by
dn = # of bp steps along the DNA between the
cytosines of CpG sites n and n − 1 .
(6)
Note that (3) and (4) express the location-dependent
parameters an and cn of the Ising model within
the genomic region Rk in terms of three locationindependent parameters, αk , βk , and γk . Parameter αk
Jenkinson et al. BMC Bioinformatics (2018) 19:87
Page 4 of 23
accounts for intrinsic factors that uniformly affect methylation over the entire region, whereas parameter βk modulates the influence of the CpG density ρn on methylation,
in agreement with known results [26, 27]. On the other
hand, (4) accounts for the fact that, due to the known processivity of the DNMT enzymes [28–30], the methylation
status of contiguous CpG sites is most often highly correlated, with the correlation between the methylation states
of two consecutive CpG sites decaying as the distance dn
between these two sites increases [6, 7, 31].
It is important to point out that the PMF of the methylation state within a genomic region Rk can be approximately expressed in terms of a 1D Ising model as well
(Additional file 1: Section 1). Moreover, its partition function can be evaluated by an efficient iterative algorithm
that allows computation of the PMF PX (x1 , x2 , . . . , xR )
of methylation within Rk (Additional file 1: Section 2).
Finally, marginal PMFs can be efficiently evaluated within
Rk (Additional file 1: Section 3).
Parameter estimation
Our results in Additional file 1, Section 1, show that,
within each genomic region Rk , DNA methylation can
be approximately modeled by a 1D Ising model that
is expressed in terms of only five parameters θ k =
αk , αk , αk , βk , γk characteristic to the region. To estimate θ k from available data, first note that WGBS does
not always measure the methylation state at all CpG
sites within a genomic region, thus frequently producing incomplete data. To address this issue, we obtain an
estimate θ k of θ k by solving the following maximumlikelihood estimation problem:
θ k = arg max L(θ k ),
(7)
θk
where
L(θ k ) =
1
M
M
ln PX
x(m)
r , r ∈ Rk (m)
θk
(8)
m=1
is the average “marginalized” log-likelihood function of θ k
given M independent observations x(1) , x(2) , . . . , x(M) of
the methylation state within the genomic region Rk . In
(8), Rk (m) is the set of all CpG sites within the genomic
region Rk whose methylation state is measured in the
m-th observation, and PX ({x(m)
r , r ∈ Rk (m)} | θ k ) is
the likelihood of the m-th observed sample obtained by
marginalizing the entire likelihood PX (x | θ k ) over the
“unmeasured” CpG sites.
Notably, we can show that the parameter vector θ k is
identifiable (Additional file 1: Section 4). This implies
that, for any two parameter vectors θ k and θ k such that
θ k = θ k , we have PX (x | θ k ) = PX (x | θ k ) for some x.
A non-identifiable parametrization can be problematic in
statistical estimation, since it is possible in this case for
two parameter values to be indistinguishable even when
infinite data is available.
Calculating a marginal likelihood is computationally
expensive if not intractable. However, when Rk (m) contains one contiguous set of CpG sites (which is most often
the case with WGBS), we can compute the marginal likelihood exactly using the method discussed in Additional
file 1, Section 3. On the other hand, when Rk (m) does
not contain one contiguous set of CpG sites, we can
compute the marginal likelihood approximately by partitioning Rk (m) into subsets of contiguous CpG sites,
by calculating the marginal probability distributions over
each subset, and by forming their product.
To strike a balance between computational and estimation performance, we empirically determined that a good
choice for the length of each genomic region Rk used
for parameter estimation is 3-kb. In addition, we choose
not to model genomic regions that either have less than
10 CpG sites [because of concerns regarding statistical
overfitting, as it would have to estimate 5 parameters from
a small number (< 10) of variates], or for which there
was insufficient data (less than 2/3 of the CpG sites were
observed or the average depth of coverage for the region
was less than 2.5 observations per CpG site). While this
means that CpG sites in very low density genomic regions
Rk will not be considered by informME, the vast majority
of CpG sites can be modeled (99% of CpG sites in hg19).
If desired, the remaining CpG sites could be modeled by
traditional marginal methods, since correlations between
very sparse CpG sites are expected to be negligible. Such
modeling is commonly done by using Bismark’s methylation extractor tool and independent binomial models at
each CpG site. Bismark is already used in the standard
informME pipeline workflow to generate BAM files and,
therefore, it is simple for a user of informME to model
CpG sites in very low density regions if desired. Finally,
in regions with sufficient data, we perform optimization
using multilevel coordinate search [32], a global nonconvex derivative-free strategy that outperforms other
algorithms we considered (e.g., simulated annealing), in
agreement with recent findings [33].
We determined the length of each genomic region
Rk by employing low coverage data (7-10×) and by
evaluating the previous maximum-likelihood estimation
method in terms of estimation performance and computational efficiency with increasing region size (ranging
from 1-kb to 10-kb). Overall, computational performance
and overfitting became a concern for region sizes below
3-kb, leading to an appreciable number of genomic
regions not being modeled by the estimation method,
whereas, no noticeable loss in estimation performance
was observed at region sizes above 3-kb. For better resolution, we therefore decided to use genomic regions with the
smallest acceptable length of 3-kb. Note, however, that the
Jenkinson et al. BMC Bioinformatics (2018) 19:87
Page 5 of 23
size of each genomic region Rk employed for estimation is
a parameter that users can set to their liking by employing
any method of choice, such as a method based on Akaike’s
information criterion (AIC) [34].
Single-sample methylation analysis
Resolution
Methylation level
To characterize methylation within a GU containing K
CpG sites k = 1, 2, . . . , K (labeled according to their order
of appearance along the GU), we employ the methylation
level
1
K
K
Xk .
(9)
k=1
Its PMF PL ( ) = Pr[ L = ], = 0, 1/K, . . . , 1, satisfies
PL ( ) =
Pr[ X = x] ,
To quantify methylation within a GU in a manner that is
consistent with existing methods, we compute the mean
methylation level (MML), given by
E[ L] =
For high-resolution methylation analysis, we must consider genomic regions that are much smaller than the
3-kb regions Rk used for parameter estimation but
large enough to account for correlations in methylation.
Inspired by the length (about 146 bp) of the DNA within a
nucleosome [35], we choose to partition each region Rk of
the genome into genomic units (GUs) of 150 bp each and
perform methylation analysis at a resolution of one GU. In
humans, the number of CpG sites contained in each GU
ranges from 0 to 44 (Additional file 2: Table S1).
Our statistical estimation can (approximately) provide
the joint PMF of methylation within any genomic region
of interest (by combining Ising probability distributions
over consecutive estimation regions and by marginalizing the resulting PMF). As a consequence, informME can
in theory be modified to include any desired definition
of GUs, including non-uniformly or adaptively sized GUs,
since the algorithms discussed in this paper are general
enough to handle such cases. For simplicity and computational efficiency, however, we here consider uniformly
sized GUs. We chose their size (150 bp) to be large enough
in order to capture cooperativity among closely clustered
CpG sites and small enough in order to perform methylation analysis at high resolution. informME allows users to
modify the size of the GUs but it does not allow for nonuniformly or adaptively sized GUs at this time, although
this could be implemented if desired without changing the
underlying algorithms.
L=
Mean methylation level
(10)
X∈X (K )
where X (k) is the set of all methylation states within the
GU with exactly k CpG sites being methylated. We calculate this PMF by using the method described in Additional
file 1: Section 5.
1
K
K
E[ Xk ] =
k=1
1
K
K
Pr[ Xk = 1] .
(11)
k=1
This is done genome-wide by calculating the probabilities
Pr[ Xk = 1] from the Ising model using the marginalization method discussed in Additional file 1: Section 3.
Methylation entropy
Methylation stochasticity is commonly quantified by computing means and variances at individual CpG sites. Due
however to the complicated nature of the underlying
probability distributions, a proper treatment requires use
of higher-order statistics [18, 20, 22]. As such, the notion
of epipolymorphism has been proposed as a joint measure of stochasticity [20]. However, previous analysis has
demonstrated that this measure is generally not available
methylome-wide and can dramatically underestimate heterogeneity, especially in the relatively low coverage data
common to WGBS experiments [22]. We therefore choose
to quantify methylation stochasticity within a GU comprised N CpG sites using a normalized version of the
Shannon entropy, given by
h=−
1
log2 (N + 1)
PL ( ) log2 PL ( ),
(12)
which we refer to as the normalized methylation entropy
(NME). This quantity takes values between 0 and 1,
with larger values indicating higher levels of randomness in methylation level. Note that normalization allows
comparison of methylation randomness within GUs containing different numbers of CpG sites, which otherwise
would not be possible. For example, perfectly random
methylation levels within two GUs with different numbers
of CpG sites, N1 and N2 , are characterized by the same
NME value of 1, despite the fact that the GUs are associated with different Shannon entropies log2 (N1 + 1) and
log2 (N2 + 1).
Classification of genomic units
To provide an effective interpretation of the MML output,
we developed a classification scheme that summarizes the
status of methylation level within a GU based on the shape
of its PMF (Additional file 1: Section 6.1). This scheme
classifies a GU into one of seven classes: highly unmethylated, partially unmethylated, partially methylated, and
highly methylated, as well as mixed, highly mixed, and
bistable; see Fig. 1 for examples. In this scheme, mixed
and highly mixed GUs are characterized by appreciable methylation variability. Moreover, bistable GUs are
Jenkinson et al. BMC Bioinformatics (2018) 19:87
Page 6 of 23
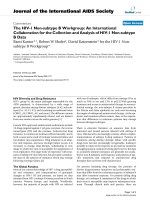
Fig. 1 Examples of methylation level and entropy based classification of a GU that contains 7 CpG sites. The methylation based GU classification is
determined by the shape of the methylation level PMF using the scheme described in Additional file 1, Section 6.1, whereas the entropy based GU
classification is determined by the NME value using the scheme described in Additional file 1, Section 6.2
characterized by the highest possible variance in methylation level (Additional file 1: Section 6.1 and [36]), even
higher than the variance associated with a highly mixed
GU, and have been linked to gene imprinting [22].
By employing a simple thresholding scheme, we also
classify a GU in terms of its entropy content into one
of five categories (Additional file 1: Section 6.2): highly
ordered, moderately ordered, weakly ordered/disordered,
moderately disordered, and highly disordered; see Fig. 1
for examples. Highly ordered GUs are characterized by
low variability of methylation level in a cell population,
whereas highly disorder GUs are associated with areas
of the genome that are subject to significant methylation
randomness.
Jenkinson et al. BMC Bioinformatics (2018) 19:87
Differential methylation analysis
Differential methylation level
To capture differences in methylation level within a GU
between a test and a reference sample, we employ the
random variable DL = Lt − Lr , where Lt and Lr are the
methylation levels in the test and the reference sample,
respectively. We can then evaluate differences in methylation level by calculating the differential mean methylation
level (dMML) E [DL ] = E [Lt ] − E [Lr ]. This is a measure
of methylation dissimilarity that has been extensively used
by existing methods for methylation analysis.
Classification of GUs
More generally, we calculate the PMF of DL by convolving the PMFs of Lt and Lr (assuming that Lt
and Lr are statistically independent). We then use the
resulting PMF to interpret differences in methylation
level using a scheme that classifies a GU into one
of seven categories (Additional file 1: Section 7.1):
strongly hypomethylated, moderately hypomethylated,
Page 7 of 23
weakly hypomethylated, isomethylated, weakly hypermethylated, moderately hypermethylated, and strongly
hypermethylated; see Fig. 2 for examples.
Differential entropy
To capture entropy differences between a reference and
a test sample, we compute the differential normalized
methylation entropy (dNME) Dh = ht − hr , where ht
and hr are the NMEs within each sample. Moreover, by
using a simple thresholding scheme, we classify each GU
into one of seven classes (Additional file 1: Section 7.2):
strongly hypoentropic, moderately hypoentropic, weakly
hypoentropic, isoentropic, weakly hyperentropic, moderately hyperentropic, and strongly hyperentropic; see Fig. 2
for examples.
Differential probability distribution
Differential methylation analysis between two samples
can also be performed by quantifying the dissimilarity
(1)
(2)
between the PMFs PL and PL of the methylation levels
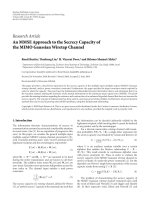
Fig. 2 Examples of differential methylation level and entropy based classification of a GU that contains 7 CpG sites. The methylation based GU
classification is determined by the shape of the PMF of the differential methylation level using the scheme described in Additional file 1, Section 7.1,
whereas the entropy based GU classification is determined by the differential NME value using the scheme described in Additional file 1, Section 7.2
Jenkinson et al. BMC Bioinformatics (2018) 19:87
Page 8 of 23
within a GU using their Jensen-Shannon distance (JSD),
given by [37]
d=
D PL(1) , PL + D PL(2) , PL
2
(1)
(2)
P( ) log2
P( )
Q( )
,
(13)
where PL ( ) = PL ( ) + PL ( ) /2 is the average of the
two PMFs and
D(P, Q) =
(14)
is the Kullback-Leibler divergence between two probability distributions P and Q. It turns out that the JSD is a
normalized metric, since it takes values between 0 and 1,
it becomes zero if and only if PL(1) = PL(2) , it is symmetric, and satisfies the triangle inequality [38]. Moreover, it
reaches its maximum value of 1 if the supports of the two
PMFs do not intersect each other, in which case the PMFs
can be perfectly distinguished from a single sample.
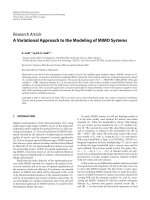
It is important to note here that a high JSD value may be
driven by a difference in MML, NME or both, or by other
statistical factors that are not accounted for by the mean
or entropy; see Fig. 3. This implies that using the JSD as
a dissimilarity measure for detecting crucial or aberrant
differences in the stochastic behavior of DNA methylation may lead to biological findings that are concealed
from observation when employing traditional differential
methylation analysis methods based on mean methylation or even entropy differences. We illustrate this crucial
point in the next section by analyzing WGBS data associated with lung normal/cancer samples.
DMR detection
An objective of WGBS data analysis is to detect DMRs;
i.e., stretches of DNA in which appreciable differences in
methylation are observed. Here, we discuss a novel algorithm that defines a DMR as a region of the genome that
exhibits statistically significant differences in the PMFs of
methylation level between a test and a reference sample,
as quantified by the JSD. As a consequence, this approach
can account for non-mean based differences that would
otherwise be missed by existing methods designed to
detect DMRs in WGBS data.
The most biologically relevant changes in methylation
are expected to occur in GUs with high JSD values and
across regions containing many such GUs. Our approach,
however, computes JSD values within GUs independently,
leading to a signal that can change rapidly from one GU
to the next. To address this issue, we compute smoothed
JSD (sJSD) values by applying the Nadaraya-Watson kernel regression smoother with a Gaussian kernel of fixed
bandwidth (which controls the scale of the DMR finder)
on the original JSD values. This is implemented by using
Fig. 3 (See legend on next page.)
Jenkinson et al. BMC Bioinformatics (2018) 19:87
(See figure on previous page.)
Fig. 3 Examples of methylation level PMFs within a GU containing 7
CpG sites with a high JSD value between a test and a reference
sample: a The observed high JSD value of 1 is mainly driven by a high
absolute dMML of 0.7. b The high JSD value of 0.9 is mainly driven by
a high absolute dNME of 0.6. c A high JSD value can be due to
statistical factors other than a nonzero dMML or a nonzero dNME. The
depicted PMFs result in the highest JSD value of 1, despite the fact
that they result in zero dMML and dNME values
the R function ksmooth with a bandwidth of 50-kb, corresponding to a kernel with standard deviation of about
18.5-kb, which was found to be effective in most cases.
When replicate reference data is available, we first evaluate the genome-wide empirical null distribution of all
observed sJSD values between pairs of replicate reference
WGBS samples. Given the sJSD value within a GU computed from a test/reference sample, we then calculate the
probability (p-value) that, by chance, the sJSD is at least
as large as the observed value due to biological, statistical,
and technical variability in the reference samples. Subsequently, we perform multiple hypothesis testing using the
Benjamini-Yekutieli (BY) method [39] for controlling the
false discovery rate (FDR) at 0.01, which leads to a maximum of 1% of the GUs identified by our method to be false
positives on the average. The BY procedure is a conservative modification of the original Benjamini-Hochberg
(BH) method [40] and has been shown to control the
FDR for dependent test statistics. Note, however, that our
JSD-based DMR algorithm can also be implemented using
the BH procedure, which was shown to control the FDR
in the particular type of positive regression dependency
[39], or using any other FDR control procedure of choice.
Finally, we convert the q-value associated with a differentially methylated GU to a statistical quality score (SQS),
given by SQS = −10log10 (q), and use this measure to
quantify the statistical significance of the GU.
The union of all GUs identified by the previous method
form a set of DMRs that are sparse due to independent
analysis. To reduce sparsity, we fill-in gaps between neighboring DMRs of size smaller than the sJSD smoothing
bandwidth (taken to be 50-kb) by applying a morphological closing [41] on the binary signal of DMR classification.
Moreover, we annotate each resulting connected DMR
by a statistical score, which we compute by summing all
SQS values within the DMR. This allows ranking of the
DMRs based on the amount of statistical evidence within
each region.
When replicate reference data is not available, we compute the null distribution of sJSD values from a single
pair of test/reference samples by assuming that the sJSD
value within a randomly selected GU is associated with
(i) a difference in the methylation level PMFs within the
GU that is only due to biological, statistical and technical
Page 9 of 23
variability (null hypothesis), or (ii) a difference that is also
due to distinct epigenetic behavior (alternative hypothesis). In this case, we can model the genome-wide distribution of appropriately transformed sJSD values (to be
between −∞ and ∞) using a Gaussian mixture model
comprising two components: one that corresponds to case
(i) and one that corresponds to case (ii). The Gaussian
component corresponding to case (i) can then be used to
model and compute the desired null distribution.
To build this mixture model, we transform the sJSD
values using the logit function
logit(x) = log
x
.
1−x
We then employ the R package mixtools to estimate a
mixture of two Gaussian distributions that best fits the
empirical distribution of the observed logit-transformed
sJSD values using the EM algorithm. This produces the
means μ1 , μ2 and variances σ1 , σ2 of the two Gaussian
distributions, as well as the corresponding weights w1 and
w2 . We expect that, on the average, the sJSD values in
case (i) will be smaller than the sJSD values in case (ii).
This leads us to expect that the null distribution of the
logit-transformed sJSD values can be well approximated
by the Gaussian mixture component associated with the
smallest mean value. As a result, we can approximate the
null distribution of the sJSD values using the logit-normal
distribution
f (x) =
1
[ logit(x) − μ]2
1
exp −
,
√
2σ 2
σ 2π x(1 − x)
where μ = min{μ1 , μ2 } and σ is the standard deviation
of the Gaussian mixture component with mean μ. We
demonstrate the validity of this approach in Fig. 4.
Fig. 4 Genome-wide empirical distribution of all sJSD values, obtained
by comparing three lung normal samples (blue). This distribution can
be well approximated by a logit-normal distribution (red)
Jenkinson et al. BMC Bioinformatics (2018) 19:87
Page 10 of 23
We expect that, on the average, sJSD values associated
only with biological, statistical, and technical variability to
be smaller than sJSD values associated only with distinct
epigenetic behavior. This allows us to use the Gaussian
component of the previously computed mixture with the
smallest mean value as a model for the null distribution
of the logit-transformed sJSD values. As a consequence,
we approximately compute the null distribution of actual
sJSD values from a single pair of test/reference samples
using a logit-normal distribution and employ this distribution to perform hypothesis testing using the same method
as the one employed when replicate reference data is
available.
the region using Fisher’s method [43], score them using
the resulting combined p-values, and use these scores to
rank all promoters, with a lower score indicating a promoter that exhibits higher differential methylation. Note
that the combined p-values are only exact when methylation within GUs is mutually independent, which is not
in general true. However, we can still use the Fisherbased p-values as scores to effectively rank the promoter
regions.
Finally, we obtain the desired list of ranked genes by
associating promoter regions with their corresponding
genes (possibly multiple promoters per gene) and by keeping only the highest ranking of a gene.
Ranking epigenetically dysregulated genes
Results
DMR analysis is feature agnostic and genome-wide, making it possible to effectively focus on regions of the
genome that exhibit most significant differences in methylation. If however the focus of analysis is more limited
in scope, such as identifying genes subject to differential
methylation, then DMR analysis will not be appropriate.
Instead, one should limit statistical analysis to only features of interest (e.g., ranking gene promoters). This is
due to the fact that a more targeted analysis will result
in higher statistical power when detecting methylation
differences at finer scales.
In this paper, we rank epigenetically dysregulated genes
by determining, for each primary transcript in the human
genome (possibly multiple per gene), its promoter region.
We do this by identifying its transcription start site (TSS)
and by centering a 4-kb window at that site. When reference replicate data are not available, we score a promoter
region by the average JSD values of all GUs that intersect
the region and use these scores to rank all promoters, with
a higher score indicating a promoter that exhibits stronger
differential methylation.
When replicate reference data is available, we rank a
promoter region by following three steps. For each GU
in the genome, we first test the null hypothesis that an
observed dissimilarity in the PMFs of the methylation
levels within the GU is due to biological, statistical, and
technical variability against the alternative hypothesis that
it is not. To implement this test, we use the JSD as the test
statistic and construct an “empirical” null model [42] by
approximating the genome-wide distribution of the JSD
under the null hypothesis using the empirical distribution
of the observed JSD values between all pairs of available
replicate reference samples. Given the JSD value within a
GU computed from a test/reference sample, we then calculate the probability (p-value) that, by chance, the JSD
can be at least as large as the observed value due to biological, statistical, and technical variability in the reference
samples. Subsequently, and for each promoter region, we
combine the computed p-values of all GUs that intersect
WGBS data samples
To illustrate the appropriateness of informME and its
superiority for methylation analysis over recently proposed methods, we used WGBS data corresponding
to three pairs of matched lung normal/cancer samples:
lungnormal-1 (14×), lungcancer-1 (15×), lungnormal2 (10×), lungcancer-2 (10×), lungnormal-3 (19×), and
lungcancer-3 (18×), where the numbers in parentheses
indicate average genome-wide coverage. The sequencing data and the modeling results can be obtained from
NCBI’s Gene Expression Omnibus (i.
nlm.nih.gov/geo), SuperSeries number GSE86340 (accession numbers GSM2103014-19).
Model evaluation
We evaluated the appropriateness of modeling WGBS
(1)
data using the Ising model PX in (1) and (2) with parameters that satisfy (3) and (4) to the more general Ising model
(2)
PX whose parameters do not satisfy (3) and (4). We did so
by randomly selecting, through the entire genome, a total
of 10,000 3-kb estimation regions Rk modeled by informME in lungnormal-2, by fitting the two models within
each region, and by computing Akaike’s information criterion (AIC), given by [34]
M(k)
AICi (k) = −2
(i)
ln PX
x(m)
r , r ∈ Rk (m) | θ i (k)
m=1
+ 2pi (k),
(15)
for i = 1, 2. In this equation, M(k) is the number of available observations within an estimation region Rk , Rk (m)
is the set of all CpG sites within Rk whose methylation
(i)
(m)
state is measured in the m-th observation, PX ({xr , r ∈
Rk (m)} | θ ) is the likelihood of the m-th observed sample
associated with the i-th model, obtained by marginaliz(i)
ing the entire likelihood PX (x | θ) over the “unmeasured”
CpG sites, θ i (k) is the maximum-likelihood estimate of
Jenkinson et al. BMC Bioinformatics (2018) 19:87
Page 11 of 23
the parameters associated with the i-th model, and pi (k) is
the corresponding number of free parameters [p1 (k) = 5
and p2 (k) = 2R(k) − 1, with R(k) being the number of
CpG sites in Rk ]. We then calculated the AIC probability
π(k) that the Ising model with parameters that satisfy (3)
and (4) is the best model for the data. This probability is
given by [34]
π(k) =
exp{− 1 (k)/2}
exp{− 1 (k)/2} + exp{−
2 (k)/2}
,
(16)
where i (k) = AICi (k) − min{AIC1 (k), AIC2 (k)}, for
i = 1, 2.
We found that 98% of the selected regions had AIC
probability larger than 0.99 in favor of the simpler model,
thus validating its superiority over the general Ising model
for the particular WGBS data used. We expect this to be
the case in practice, since very high coverage is required
to support the more complex model, which would generally be prohibitively expensive using current WGBS
technology.
Differential performance assessment using simulated data
We also sought to investigate the differential performance
of informME as compared to other methods for methylation analysis of WGBS data published in the literature.
Existing methods for differential WGBS analysis are theoretically similar to each other in that they use marginal
statistics, possibly in conjunction with a smoothing function, to statistically determine methylation differences at
individual CpG sites. One such recent method, known
as DSS [15, 16], has been compared to several methods
(such as methylKit [9], BSmooth [10], BiSeq [11], RADMeth [12], and MOABS [14]), using simulated as well as
real data and has been found to be more preferable than
these methods. Moreover, metilene, a recently proposed
DMR finder [24], was found to be superior to BSmooth
and MOABS in terms of sensitivity (true positive rate),
specificity (true negative rate), and speed of implementation on simulated data. However, our analysis in the next
subsection and in the Additional file 1, Section 8, clearly
demonstrates that DSS is statistically superior to metilene, since the latter method cannot produce differential
methylation results that can be considered valid from a
statistical perspective. For this reason, we chose to compare the differential performance of informME only to
that of DSS.
We did so by first using the Ising model to generate
synthetic methylation data that imitate the structure of
the real samples we use in this paper (i.e., we generated
three matched pairs of test and reference samples). Our
synthetic samples behave like real sequencing data, with
reads placed randomly along the genome. This means that
the coverage of the CpG sites varies randomly along the
DNA and that each read covers only a small fraction of the
genome. We considered reads of 300 bp long and generated synthetic data with an average genome-wide coverage
of 15×, which is common in WGBS. For simplicity, we
modeled a synthetic genome having 5000 isolated CpG
islands (CGIs) separated by gaps of 100-kb, with each
CGI being 3-kb long and containing 200 uniformly spaced
CpG sites.
Because CpG sites within each CGI are uniformly
spaced, the Ising model is reduced to a two-parameter
model (i.e., an Ising model with parameters a and c within
each estimation region). For both test and reference samples, we set a = 0. However, to impart a difference in
the correlation between the two cases, we set c = 0 in
the test samples and c = δ in the reference samples,
with δ = 0.4, 0.6, . . . , 2.0. We did not include biological
variability in the model, since our goal here is to simply show that marginal methods, such as DSS, cannot
detect high-order differences in the joint probability distributions of methylation. Note also that, in this setup, the
true marginal methylation means are identical (i.e., every
CpG site has a true probability of 0.5 to be methylated in
the test and the reference samples). We therefore expect
that a marginal method of analysis, such as DSS, will not
detect differential activity when using our synthetic samples. We also expect the sensitivity (true positive rate)
of DSS to be equal to the Type I error rate (false positive rate), indicating a performance that is no better than
random guessing.
When applied on our three test/reference comparisons, informME produced 100% sensitivity for all values of δ, whereas it consistently resulted in 100%
specificity (true negative rate) when it was applied on
our three reference/reference comparisons; see Fig. 5.
In the test/reference comparisons, informME identified
every single CpG site as being differentially methylated, whereas in the reference/reference comparisons,
informME detected no DMRs. For this simulation, we
employed the default settings of our JSD-based DMR
algorithm, except that we used a bandwidth of 1-kb
(instead of the default value of 50-kb) to indicate
that the sizes of our features of interest are of the
order of 1-kb. These results demonstrate the statistical validity of DMR detection using informME, which
can appropriately handle variations in coverage encountered in practice without resulting in a large Type I
error rate (which equals to 1 − specificity), while retaining the ability to detect real methylation differences
when present.
DSS produced near zero sensitivity for all values of
δ, whereas its specificity monotonically decreased with
increasing values of δ; see Fig. 5. We attribute the lack
of sensitivity to the fact that DSS is unable to reliably
detect differences between the joint probability distributions of methylation other than in the mean, even
Jenkinson et al. BMC Bioinformatics (2018) 19:87
Page 12 of 23
Fig. 5 Sensitivity and specificity of informME and DSS when applied on simulated data based on three test/reference comparisons (for sensitivity)
and three reference/reference comparisons (for specificity) as a function of the difference δ between the c parameter values of the Ising model in
the test and reference samples
when these differences are large, which is the case in
our simulations. Notably, the differences in the joint
probability distributions considered here were so large
that informME never failed to detect their presence.
On the other hand, the observed decrease in specificity
demonstrates that correlations can lead to DSS not properly controlling the Type I error rate (maximum rate
observed in our simulations was 0.018), since it appreciably exceeded the p-value threshold used by DSS by two
orders of magnitude (in our testing, we used DSS’s default
threshold of 10−5 ).
The previous findings demonstrate that not only do
marginal methods, such as DSS, fail to detect high-order
differences in methylation when present, but also that
their statistical testing framework can become invalid due
to their inability to model correlations in the data. In
particular, we found that DSS, being based on a wellformed hypothesis testing framework, was able to control
the Type I error rate in our reference/reference comparisons when there were small correlations and no biological
variability. However, in the presence of larger correlations, DSS can lead to a Type I error rate that is many
orders of magnitude higher than the chosen level (p-value
threshold) used to control this error rate. This shows
that, even when we are not concerned with detecting
non-mean based differences in methylation, we must still
utilize a modeling tool, such as informME, which properly
accounts for correlations that are known to occur in real
DNA methylation data.
Differential performance assessment using real
cancer/normal data
Assessing sensitivity and specificity of differential methylation analysis using simulated data favors methods that
are compatible with the underlying theoretical assumptions pertaining to the models used for generating the
data and can, therefore, lead to misleading conclusions.
In addition, the practice in [15, 16] of evaluating methods
based on the overlap of detected methylation differences
with certain genomic features (such as gene promoters, CpG island shores, etc.) can be problematic since
it requires prior division of the genome into regions of
high versus low differential methylation activity, which
is not possible in general. Finally, using real WGBS data
to compare methods requires knowledge of ground truth
information about the locations of differential methylation activity.
Statistical methods for identifying differential activity in
a test/reference study are typically based on a hypothesis
testing approach. Critically important to any hypothesis
testing framework, however, is setting up a null hypothesis that is appropriate for the specific biological problem
at hand. Since our interest here is to identify differential
methylation in test versus reference samples (e.g., cancer
versus normal) using WGBS data, we must test against
the null hypothesis that observed differential activity is
due to biological, statistical, or technical variability. Building a null model in this manner ensures that all sources
of normal variability that might appear between a pair
Jenkinson et al. BMC Bioinformatics (2018) 19:87
of reference samples are accounted for, whereas differences that exceed the norm under this null model can
be assumed to be due to the test condition rather than
other sources of variability (i.e., statistical sampling noise,
technical noise from sequencing experiments, or normal
biological variability in the reference tissue). By definition, if the null hypothesis is true, then the probability
that a p-value is less than or equal to α will be α as well.
This implies that the p-value will be uniformly distributed
between 0 and 1. Thus, if we apply a differential methylation analysis method on our normal lung reference
samples, we would expect a statistically sound hypothesis
testing problem to produce, under the aforementioned
Page 13 of 23
null hypothesis (i.e., one that includes biological, technical and statistical variability), p-values whose genomewide
empirical distribution is approximately uniform.
By applying informME on the three pairs of our lung
normal data, we obtained p-values for each GU of the
genome that follow a uniform empirical probability distribution; see Fig. 6a and Additional file 1: Figures S3-S5.
However, when we applied DSS-single, we obtained the
nonuniform empirical probability distribution depicted in
Fig. 6b (see also Additional file 1: Figures S3-S5). We can
view this probability distribution as a mixture of two components: a uniform null distribution attributed to statistical variability modeled by DSS-single and a nonuniform
a
b
c
d
e
f
Fig. 6 Distribution of p-values obtained genomewide using all three pairs of our lung normal data by: a informME, b DSS-single, c metilene in the
“DMR de-novo annotation” mode 1 based on the KS test statistic, d metilene in the “DMR de-novo annotation” mode 1 based on the MWU test
statistic, e metilene in “DMR annotation in known features” mode 2 based on the KS test statistic, and f metilene in “DMR annotation in known
features” mode 2 based on the MWU test statistic
Jenkinson et al. BMC Bioinformatics (2018) 19:87
null distribution with additional probability mass concentrated over small p-values, which can be attributed
to non-modeled biological or technical variability. We
therefore conclude that DSS-single is not fully accounting
for biological or technical variability in the data. Hence,
differential methylation activity in a cancer/normal comparison detected by this algorithm cannot be necessarily
attributed to cancer. However, Fig. 6(b) implies that, under
the null hypothesis, the false positive rate of DSS-single
due to biological or statistical variability (the area of the
peak at 0) is relatively small (about 7.5%), as we would
expect in a normal/normal comparison.
When we applied each of the two modes of metilene on our lung normal data [mode 1: DMR de-novo
annotation; mode 2: DMR annotation in known features (promoters); see />Software/metilene], we obtained nonuniform empirical
probability distributions for the p-values associated with
the detected DMRs; see Figs. 6(c-f) and Additional file 1:
Figures S3-S5. These p-values were obtained by using a
2D version of the Kolmogorov-Smirnov (KS) test or the
Mann-Whitney U (MWU) test. In this case, it is not possible to view the resulting probability distributions as mixtures of two separate components. Moreover, the results
show a much higher false detection rate than DSS under
the null hypothesis (35% for KS mode 1, 55% for MWU
mode 1, 15% for KS mode 2, and 20% for MWU mode 2)
– see also Additional file 1: Section 8 for a theoretical discussion on why this is so. As a consequence, we do not
believe that metilene can be reliably used for differential
methylation analysis since it cannot statistically attribute
detected differential methylation activity to cancer. Due
to its unreasonably high false detection rate, a great deal
of identified differential activity will be due to biological,
statistical, or technical variability and not due to cancer.
A nonuniform probability distribution of p-values under
the null hypothesis indicates that the test statistic used by
a particular method for differential methylation analysis
is not appropriate for testing against the previously articulated null hypothesis. DSS does a much better job than
metilene in this respect, although informME is clearly the
best method among the three to accomplish this goal. For
this reason, we provide in the following a further assessment of the performance of informME and DSS when
applied on real data.
We used gene ontology (GO) enrichment analysis
() [44] to compare performance by evaluating the potential of informME to that
of DSS for addressing a specific problem of interest to
epigenetic biology: identifying biological processes that
are significantly enriched in epigenetically dysregulated
genes. By using GO enrichment analysis on gene lists
of equal size formed by selecting genes with the largest
detected methylation discordance at their promoters, we
Page 14 of 23
can remove the issue of sensitivity and specificity and
focus on the ability of each method to produce biologically
relevant results.
It is important to note that the gene selection method
used in [16] selects a gene by checking whether a statistic
T, which counts the number of the top 2000 differentially
methylated CpG sites in the gene, is above a threshold
t = 4. Unfortunately, this gene selection process produced no results in our data and, therefore, it cannot be
reliably used to perform GO annotation.
The reason for this problem is that GO results depend
on the size of the target list used (the set of selected genes),
which must contain many genes, while the previous DSSbased selection process produces very few genes meeting
the underlying criteria for selection. In our experience, to
perform meaningful GO enrichment analysis, the target
list should be about 1-3% the length of the background
list (the set of all genes in the genome). Therefore, and to
be fair when comparing DSS to informME, we sought to
modify the gene selection process associated with DSS so
that the two approaches select the same number of differentially methylated genes. We determined this number
to be 450 genes so that the target list is approximately 2%
of all genes (22,337 genes). Our modification consists of
selecting a gene by thresholding a statistic T that counts
the number of differentially methylated CpG sites in the
gene (and not only the top 2000 sites), as determined by
DSS, with a threshold that is adaptively chosen so that the
target list contains 450 genes.
When using DSS, we can order genes by employing the
T statistic discussed above. This implies that genes with
more differentially methylated CpG sites within their promoters will be placed higher in the list. However, a major
limitation of this procedure, which is not an issue with
informME, is the fact that many genes will have no differentially methylated CpG sites in their promoters, as
detected by DSS, resulting in many tied rankings at the
bottom of the list. This can be detrimental to GO enrichment analysis using a single ranked list. Therefore, and
in order to be fair to DSS, we focused on performing
GO enrichment analysis using unranked target and background sets of genes for both informME and DSS, which
require only a selection of 450 genes from the top of the
ranked lists.
By adopting the previous strategy, we evaluated the
performance of informME in the following three typical
scenarios and found it to outperform DSS in producing
the most biologically relevant outcomes.
Scenario 1 – Multiple pairs of matched test/reference samples
are available
We applied informME on each pair of the matched
cancer/normal samples in the lung dataset and, by using
the fact that replicate reference data are available in
Jenkinson et al. BMC Bioinformatics (2018) 19:87
this case, we ranked genes using our JSD-based Fisher
approach (Additional file 2: Table S2). We then combined
the results of the three comparisons into a single ranked
list using the method of rank products [45, 46], implemented by the Bioconductor package RankProd, which
provided a target list of 450 genes for GO analysis that are
highly scored in all three comparisons. We also applied
DSS-single on each pair of matched cancer/normal samples using the Bioconductor package DSS, ranked the
genes based on the number of identified differentially
methylated CpG sites within their promoters, and used
rank products to combine the three ranked lists into a single list (Additional file 2: Table S3). This again provided
a target list of 450 genes for GO analysis that are highly
scored in all three comparisons.
informME identified many genes as being differentially
methylated in lung cancer with several of them being discovered by DSS as well. Notably, 31 out of the top 50
genes identified by informME, such as SALL3, HOXA5,
SOX1, ZIC1, CBLN1, AJAP1, DIO3, GFRA1, and FOXC2,
have been already associated with lung cancer (Additional file 2: Table S4). Moreover, 19 out of the top 50
genes identified by informME were ranked among the top
100 differentially methylated genes by DSS. We noticed,
however, that the rankings of some genes that are highly
ranked by informME, such as CBLN1, AJAP1, GFRA1, and
FOXC2, were substantially reduced by DSS.
We then employed GO enrichment analysis using a
background set of 22,337 genes and a target set of the
top 450 genes identified by each method. We limited the
results to statistically significant GO terms (FDR q-value
≤ 0.05) that were also associated with at least 5 genes
in the target set. The results, summarized in Table 1,
show that informME produced 205 GO terms, with 38
of them having enrichment of at least 5. The highly
enriched GO terms included many developmental and
differentiation processes, such as patterning, regionalization, epithelial cell differentiation, and cell fate determination and commitment, as well as many cellular processes and corresponding pathways, such as cell communication, cell fusion, signalling, and chromatin silencing
(Additional file 2: Table S5a). It also included processes
associated with neurogenesis, as well as neuron fate specification, differentiation and commitment, which have
been increasingly associated with lung and other types of
cancer [47–49]. Notably, DSS produced an order of magnitude fewer GO terms (21 terms) with only 1 having
enrichment of at least 5.
Scenario 2 – Multiple pairs of test/reference samples are
available with no matching information
By ignoring matching information, we aggregated all test
data (lung cancer) into one pool and all reference data
(lung normal) into another pool, applied informME on the
Page 15 of 23
Table 1 Summary of GO enrichment analysis results when
comparing informME to DSS
SCENARIO 1
informME
DSS
lungcancer-VS-lungnormal
GO terms
GO terms (enrichment ≥ 5)
205
38
21
1
SCENARIO 2
informME
DSS
lungcancer-VS-lungnormal
GO terms
GO terms (enrichment ≥ 5)
167
29
3
1
SCENARIO 3
informME
DSS
lungcancer-1-VS-lungnormal-1
GO terms
GO terms (enrichment ≥ 5)
176
31
68
9
lungcancer-2-VS-lungnormal-2
GO terms
GO terms (enrichment ≥ 5)
148
25
2
0
lungcancer-3-VS-lungnormal-3
GO terms
GO terms (enrichment ≥ 5)
159
17
42
0
pooled data, and selected 450 genes as before using our
JSD-based Fisher scheme (Additional file 2: Table S2). We
also applied DSS-general on the data pairs and selected
450 genes based on the number of identified differentially
methylated CpG sites within their promoters (Additional
file 2: Table S3). The GO annotation results summarized
in Table 1 (for details, see Additional file 2, Table S5b)
were similar to the ones obtained in Scenario 1. Our
method produced 167 GO terms, with 29 of them having
enrichment of at least 5, whereas DSS produced only 3 GO
terms with only 1 having enrichment of at least 5.
Scenario 3 – Only one pair of test/reference samples is
available
To investigate this scenario, we separately applied informME on each matched pair of our WGBS data. By following our gene ranking scheme, we ranked genes using
the average JSD score over all GUs that overlap a gene’s
promoter, since we do not have replicate reference data
in this case (Additional file 2: Table S6). This provided a
target list of 450 genes for GO analysis. We also applied
DSS-single on each matched pair and selected 450 genes
as before based on the number of identified differentially
methylated CpG sites within their promoters (Additional
file 2: Table S6). For each normal/cancer pair, GO enrichment analysis produced the results summarized in Table 1
(for details, see Additional file 2, Table S7), which were
again similar to the results obtained in the previous two
scenarios. In the case of the (lungcancer-1, lungnormal-1)
pair, our approach produced 176 GO terms, with 31 of
Jenkinson et al. BMC Bioinformatics (2018) 19:87
them having enrichment of at least 5, whereas DSS produced 68 GO terms with only 9 having enrichment of
at least 5. Moreover, in the case of the (lungcancer-2,
lungnormal-2) pair, informME produced 148 GO terms,
whereas DSS produced only 2 GO terms with none of
these terms having enrichment of at least 5, compared
to 25 such GO terms identified by informME. Finally, in
the case of the (lungcancer-3, lungnormal-3) pair, informME produced 159 GO terms, whereas DSS produced 42
GO terms with none of these terms having enrichment of
at least 5, compared to 17 such GO terms identified by
informME.
Methylation data analysis
We now illustrate the effectiveness of informME in
procuring information about the methylation status of the
epigenome within different genomic features and at multiple scales. We do so by analyzing our matched lung
normal/cancer WGBS samples.
For each sample group (normal or cancer), we computed the distributions of aggregate GU classifications
over the entire genome in terms of methylation level
and entropy, as well as within enhancers, promoters,
gene bodies, CGIs, and CGI shores (Additional file 1:
Figures S6 and S7). We also computed the distributions of aggregate differential GU classifications among
all cancer/normal comparisons in terms of methylation level and entropy (Additional file 1: Figures S8
and S9). We obtained a list of enhancers from the VISTA
enhancer browser [50] by using all human (hg19) positive
enhancers that show reproducible expression in at least
three independent transgenic embryos. We defined promoter regions as sequences flanking 2-kb on either side of
TSSs, which we determined by using the R Bioconductor
package TxDb.Hsapiens.UCSC.hg19.knownGene.
Finally, we downloaded a list of gene bodies from the
UCSC genome browser () and a
list of CGIs from [51], whereas we defined CGI shores as
sequences flanking 2-kb on either side of CGIs.
The distributions of aggregate GU classifications in
terms of methylation level and entropy (Additional file 1:
Figures S6 and S7) are in agreement with the known fact
that the genome is mostly methylated in normal cells,
except within CGIs, which are more likely to be unmethylated than methylated, as well as with the fact that cancer cells exhibit global hypomethylation. Moreover, these
distributions show that, in addition to global hypomethylation, cancer cells can locally exhibit hypermethylation
within certain genomic features. However, the distributions also demonstrate that a significant percentage of
GUs within enhancers, promoters, gene bodies, and CGI
shores (and to a lesser extend within CGIs) exhibit variable (mixed, highly mixed, or bistable) methylation, which
noticeably increases in cancer.
Page 16 of 23
The distributions of aggregate GU differential classifications (Additional file 1: Figures S8 and S9) demonstrate
that the methylation state within most GUs in normal cells
is weakly ordered/disorded. However, a significant percentage of GUs are ordered or disordered within promoters, are disordered within enhancers, and ordered within
CGIs. Moreover, these distributions show appreciable
global shift towards disordered states in cancer. However,
a closer look of the results reveals that, although a large
percentage (more than 40%) of GUs within enhancers,
promoters, gene bodies, CGIs, and CGI shores are hyperentropic in cancer, a significant percentage (between 16%
and 20%) becomes hypoentropic as well.
informME can produce high resolution inter-sample
and differential information about methylation within a
genomic region. To illustrate this, we depict in Figs. 7
and 8 results for our matched (lungcancer-3, lungnormal3) pair generated by informME within two genomic
regions at two different scales: a large scale (8-Mb)
genomic region within chr14 (98,000,000-106,000,000),
depicted in Fig. 7, and a much smaller (7-kb) local
genomic region within chr14 (102,025,500-102,032,500),
depicted in Fig. 8. Most GUs within the genomic region
depicted in Fig. 7 in the lungnormal-3 sample are partially or highly methylated with only a small number
being partially or highly unmethylated (MML and METH
tracks). However, a few GUs are sparsely classified as
mixed, with a smaller number classified as highly mixed
or bistable (VAR track). In addition, most GUs are moderately or highly disordered with some GUs being moderately or highly ordered (NME and ENTR tracks). Notably,
lungcancer-3 exhibits global loss in mean methylation
level (MML, dMML, and DMU tracks), a noticeable
increase in GUs classified as mixed, highly mixed, or
bistable (VAR tracks), and a gain in entropy (NME, ENTR,
dNME, and DEU tracks). These differences drive high
Jensen-Shannon distance values within a large number
of GUs (JSD track), which lead to many differentially
methylated regions (DMR track). The DMR highlighted
by yellow in Fig. 7 contains DIO3, a critical developmental
gene whose genomic location is highlighted by blue. This
gene has been ranked 1-st in the list of ranked genes produced by informME (Additional file 2: Table S2, third list)
and its genomic locus has been recently implicated in lung
cancer [52, 53].
A closer inspection of the local region highlighted by
blue in Fig. 7 reveals that the lung cancer sample exhibits
gain in mean methylation level (MML, dMML, and DMU
tracks), as well as in entropy (NME, ENTR, dNME, and
DEU tracks), which result in significant Jensen-Shannon
distance values (JSD track); see Fig. 8. Moreover, the
results indicate that the CGIs within the genomic locus
of DIO3 are hypermethylated in lung cancer. This is in
direct contrast to the hypomethylation observed at a
Jenkinson et al. BMC Bioinformatics (2018) 19:87
Page 17 of 23
Fig. 7 UCSC genome browser example of large-scale inter-sample and differential analysis of the matched WGBS sample pair (lungcancer-3,
lungnormal-3) using informME. See Additional file 1, Section 9, for information about the depicted tracks. The highlighted DMR contains DIO3, a
developmentally critical gene implicated in lung cancer and placed at the top of the list of ranked genes produced by informME
larger scale, but in agreement with recent findings regarding the methylation state of DIO3 in lung cancer [53].
With respect to methylation stochasticity, Fig. 8 shows
an entropy gain in lung cancer, although this gain is
significant only within the first 1/3 of the first CGI (see I),
as well as within the third and the fourth CGIs (see III).
Finally, Fig. 8 illustrates our previous point that differential
methylation activity in real data can be primarily driven
by differences in mean methylation level (see II), entropy
(see III), or both (see I).
Jenkinson et al. BMC Bioinformatics (2018) 19:87
Page 18 of 23
Fig. 8 Local-scale version of the UCSC genome browser example depicted in Fig. 7 showing the methylation status within the genomic location of
DIO3. See Additional file 1, Section 9, for information about the depicted tracks. Note that differential methylation activity in real data can be
primarily driven by differences in mean methylation level (see II), entropy (see III), or both (see I)
Jenkinson et al. BMC Bioinformatics (2018) 19:87
Importance of JSD for differential methylation analysis
To demonstrate the importance of modeling methylation
stochasticity in real data using joint probability distributions and identifying differential activity by employing the
JSD, we investigated the possibility of finding genes with
large average JSD values but small average absolute dMML
values within their promoters in our lung data. We did so
by first ranking all genes in two separate lists, with the
genes in the first list ranked in terms of decreasing average
absolute dMML values within their promoter regions and
the genes in the second list ranked in terms of decreasing average JSD values. We then scored a gene using the
ratio of its ranking in the mean-based list to its ranking in
the JSD-based list, and used these scores to produce a new
ranked list with higher ranked genes being characterized
by larger average JSD values but smaller average absolute
dMML values within their promoter regions (Additional
file 2: Table S8).
Page 19 of 23
We identified many genes with this property that
have been implicated in lung cancer, such as AJAP1,
CBLN1, FOXC2, OLIG2, POU3F3, SALL3, and SOX1.
For example, the genomic regions depicted in Fig. 9
contain AJAP1 and CBLN1, which are respectively
ranked 16-th and 14-th in the JSD-based lists of
ranked genes obtained by informME in the case of
the lungcancer-2-VS-lungnormal-2 and lungcancer-1-VSlungnormal-1 comparisons (Additional file 2: Table S8).
These regions are characterized by appreciable JSD values (JSD tracks) associated with very low differences
in MML (dMML tracks) and moderate differences in
NME (dNME tracks). Notably AJAP1 is ranked 2262nd in the corresponding ranked list of genes obtained
by DSS, whereas CBLN1 is ranked 1054-th (Additional
file 2: Tables S6a and S6b, second lists). Note that
the first region is not inside a DMR, which demonstrates the fact that DMR detection can miss important
Fig. 9 UCSC genome browser examples of AJAP1 and CBLN1, two genes implicated in lung cancer with promoters exhibiting low levels of
differential mean methylation between lung normal and lung cancer but large Jensen-Shannon distances. See Additional file 1, Section 9, for
information about the depicted tracks
Jenkinson et al. BMC Bioinformatics (2018) 19:87
differential activity in methylation that appears at smaller
scales.
Our previous results corroborate our claim that intersample and differential analysis of methylation stochasticity requires calculation of joint PMFs of methylation
activity within regions of the genome and should not be
based on marginal analysis, since such an analysis may
be blind to important statistical behavior of methylation.
In particular, differential analysis must be performed by
comparing entire probability distributions and not just
means, since two PMFs located at the same mean may
have different shapes, indicating a differential behavior
that is due to high-order statistical factors (see also Fig. 3).
Implementation
We have implemented the previous methods for methylation analysis in informME, a publicly available software package written in MATLAB, C++ and R. The
package is available under a GPL-3.0 license and
can be downloaded from GitHub ( />GarrettJenkinson/informME).
informME produces results stored in bedGraph
genomic tracks (Additional file 1: Section 9) that can be
visualized using a genome browser, such as the UCSC
genome browser (). For a given
species (e.g., human, mouse, etc), a reference genome is
first analyzed using MATLAB to compute, among other
things, the location of CpG sites, the CpG density of each
CpG site, and the distance between neighboring CpG
sites. BAM files of WGBS reads aligned to the reference
genome are then passed to a matrix generation algorithm
of MATLAB, which performs methylation calling and
places the data in convenient matrix data structures that
enable rapid statistical estimation of the Ising model
parameters. This information is then passed to the next
step, which estimates the parameters of the 1D Ising
model, given by (1)–(4), within each 3-kb estimation
region Rk of the genome via maximum-likelihood. For
computational efficiency, the iterative algorithms that
calculate the partition functions and marginalized joint
probability distributions required in this step have been
written in C++ using the MATLAB executable (MEX)
API. Computation of the partition function requires
use of large numbers and, for this reason, standard
double-precision arithmetic is not sufficient. Thus, informME employs arbitrary precision arithmetic to ensure
numerical accuracy. In the C++ code, arbitrary precision
computations are facilitated by the MPFR C library for
multi-precision floating-point computations with correct
rounding (), along with the EIGEN
C++ template library for linear algebra (http://eigen.
tuxfamily.org).
Subsequently, informME performs methylation analysis of a single WGBS sample by computing a number
Page 20 of 23
of statistical summaries of the methylation state, including MMLs and NMEs, as well as mean and entropy
based classifications. Moreover, informME can perform
differential methylation analysis between a test and a
reference sample by computing a number of statistical
summaries of the differential methylation state, including differences in MMLs and NMEs, JSDs, and differential mean level and entropy based classifications. Finally,
informME is currently equipped with two post-processing
R functions: jsDMR, a utility that performs JSD-based
DMR detection, and jsGrank, a utility that uses the
JSD to rank all genes in the human genome in terms of
their epigenetic discordance between test and reference
WGBS samples.
We evaluated the time and memory requirements of
informME versus that of DSS using our (lungcancer-3,
lungnormal-3) pair of samples. The results, which we
summarize in Additional file 1: Table S1, show that informME is overall computationally more expensive than
DSS, requiring about 6.5 times the CPU time of DSS
but less than 1/4 of the maximum RAM required by
DSS. Note, however, that the additional cost in CPU time
results in several important benefits: joint PMFs are computed within GUs, which allows computation of any statistical summary of interest beyond the mean, statistically
valid results are produced in the presence of correlations
(which are always present in methylation data), and additional information-theoretic quantities are calculated that
can be effectively used in inter-sample and differential
methylation analysis. We should finally point out that the
highly parallelizable structure of informME means that
access to a computer cluster can reduce implementation
time below that of DSS. Consequently, in our extensive
experimentation on a computing cluster, we found that
the time a user must spend waiting for informME to process a WGBS experiment (∼ 1 day) is far less than the time
it takes to sequence and demux the samples (and much
less time than wet lab experiments take to produce the
samples). We thus contend that waiting on accurate and
comprehensive bioinformatics modeling of methylation
data is completely justified and reasonable in the context of large, expensive, and inherently time-consuming
genome-wide sequencing studies.
Discussion
The Ising model was originally introduced in statistical
physics as a model of ferromagnetism [25]. Despite its
wide-spread use in many fields of science and engineering as a model that accounts for statistical correlations,
it has only been recently adopted for modeling correlations in DNA methylation data [22]. The MATLAB, C++,
R-package we have developed and discussed in this paper
within the framework of informME includes methods for
fitting the Ising model to WGBS data and for extracting
Jenkinson et al. BMC Bioinformatics (2018) 19:87
information from such data in inter-sample or differential
analysis methylation studies.
Previous simulation studies have offered strong evidence that the Ising model can perform exceptionally well
in accurately estimating measures of methylation stochasticity, such as mean methylation levels and normalized
methylation entropies, even at low coverage [22]. This is in
sharp contrast to existing empirical approaches to methylation analysis, which do not perform well with highly
stochastic methylation data and at low coverage.
Building upon this foundation, the results presented in
this paper, using human lung normal/cancer methylation
data, clearly demonstrate the potential of informME as a
powerful statistical methylation analysis tool. We attribute
this result to the fact that informME performs methylation analysis by effectively taking into account the massive
amount of statistical information available in WGBS data,
which is largely ignored by existing methods for methylation analysis based on marginal or mean analysis, such
as DSS. In addition, informME models methylation within
GUs using joint probability distributions that encapsulate high-order statistical factors, for example NME and
JSD, which cannot be captured by a marginal statistical
approach. This type of marginal analysis was shown here
not to be sufficient for fully characterizing methylation
stochasticity, consistent with recent findings [20, 22].
The Ising model was justified by a maximum entropy
approach by assuming that the means and nearestneighbor correlations are all that can be reliably observed
genomewide by current WGBS technology. However,
third generation sequencing promises longer reads, which
may reveal the importance of taking into account higherorder statistical information. By following a similar maximum entropy approach, the methodology discussed in
this paper can be extended to the more general class
of Gibbs distributions that include additional terms in
their energy functions. However, this approach will introduce more parameters in the model to be estimated from
available data, which will in turn increase the statistical complexity of the problem and require availability of
higher coverage data. Finally, the promise of long reads
from third generation sequencing holds great potential for
providing fully observed data within a genomic region.
This will lead to a convex maximum-likelihood estimation
problem that can be rapidly solved by an efficient convex
optimization algorithm.
Conclusion
In this paper, we presented informME, a novel
information-theoretic pipeline for inter-sample and differential methylation analysis of WGBS data. In contrast
to most existing methods for methylation analysis, informME considers all information available in methylation
reads, takes into account statistical dependencies between
Page 21 of 23
the methylation states of CpG sites, and quantifies methylation stochasticity not by simple means and variances
at individual CpG sites but by using joint probability
distributions over the methylation states.
Here we showed that the probability mass function of
methylation within a region of the genome can be approximated by the 1D Ising model of statistical physics and
presented algorithms for computing the associated partition function and for calculating marginal probabilities,
which are critical to the maximum likelihood estimation
problem central to informME. In addition, we confirmed
the identifiability of the underlying parameters and provided details of the methods used by informME to calculate the probability mass function of the methylation level
within a genomic unit. We also developed inter-sample
and differential classification schemes for the methylation level and the Shannon entropy within genomic units,
and presented a new method for detecting DMRs using
the Jensen-Shannon distance between two probability distributions. Moreover, we discussed a method that uses
this distance to rank genes based on observed epigenetic
discordance within their promoters. We also evaluated
the appropriateness of the particular Ising model used
by informME by employing Akaike’s information criterion. We finally demonstrated the clear superiority of
informME over DSS and metilene, two recently proposed
methods for differential analysis of bisulfite sequencing
data, and illustrated its effectiveness in producing information about the methylation state of the epigenome
within different genomic features and at multiple scales.
With the rapidly decreasing cost of sequencing and corresponding increases in the availability of WGBS technology, there will be ample opportunities to apply informME
on a wide range of genomewide inter-sample and differential methylation studies. In the future, it will be important
to explore further improvements to the Ising model and
our information-theoretic framework, such as incorporating genomic SNP information into the formulation to aid
in methylation quantitative trait loci (mQTL) analysis.
Additional files
Additional file 1: Supplementary material. This file contains additional
method descriptions and supplementary figures. (PDF 3,808 KB)
Additional file 2: Supplementary tables. This file contains supplementary
tables summarizing our experimental results. (XLSX 10,320 KB)
Abbreviations
AIC: Akaike’s information criterion; bp: Base pair; CGI: CpG island; dMML:
Differential mean methylation level; DMR: Differentially methylated region;
dNME: Differential normalized methylation entropy; FDR: False discovery rate;
GO: Gene ontology; GU: Genomic unit; informME: information-theoretic
analysis of methylation; JSD: Jensen-Shannon distance; KS: KolmogorovSmirnov; MML: Mean methylation level; MWU: Mann-Whitney U; NME:
Normalized methylation entropy; PMF: Probability mass function; sJSD:
Smoothed Jensen-Shannon distance; SQS: Statistical quality score; TSS:
Transcription start site; WGBS: Whole genome bisulfite sequencing
Jenkinson et al. BMC Bioinformatics (2018) 19:87
Page 22 of 23
Acknowledgements
The authors thank Elisabet Pujadas for producing the BAM files for the lung
normal/cancer data used in this paper.
9.
Funding
This work was supported by NIH Grants CA054358, HG008529 and NSF Grant
CCF-1656201. The funders had no role in study design, data collection and
analysis, decision to publish, or preparation of the manuscript.
10.
Availability of data and materials
The sequencing data and the modeling results can be downloaded from
NCBI’s Gene Expression Omnibus ( />SuperSeries number GSE86340 (accession numbers GSM2103014-19).
MATLAB/C++/R source code is available from />GarrettJenkinson/informME.
Authors’ contributions
GJ and JG developed the mathematical and computational methods with
critical input from APF. GJ wrote the computer code and implemented the
methods with the help of JA. GJ, JA, and JG analyzed the data. GJ and JG wrote
the manuscript with the assistance of APF and JA. All authors have read and
approved the manuscript.
11.
12.
13.
14.
15.
16.
Ethics approval and consent to participate
Not applicable.
17.
Consent for publication
Not applicable.
18.
Competing interests
The authors declare that they have no competing interests.
19.
Publisher’s Note
Springer Nature remains neutral with regard to jurisdictional claims in
published maps and institutional affiliations.
20.
Author details
1 Whitaker Biomedical Engineering Institute, Johns Hopkins University,
Baltimore, MD, USA. 2 Center for Epigenetics, Johns Hopkins School of
Medicine, Baltimore, MD, USA. 3 Department of Biomedical Engineering, Johns
Hopkins University, Baltimore, MD, USA. 4 Department of Medicine, Johns
Hopkins School of Medicine, Baltimore, MD, USA.
21.
Received: 15 September 2017 Accepted: 22 February 2018
22.
23.
References
1. Feinberg AP, Irizarry RA. Stochastic epigenetic variation as a driving force
of development, evolutionary adaptation, and disease. Proc Natl Acad Sci
USA. 2010;107 Suppl 1:1757–64.
2. Bergman Y, Cedar H. DNA methylation dynamics in health and disease.
Nat Struct Mol Biol. 2013;20:274–81.
3. Schübeler D. Function and information content of DNA methylation.
Nature. 2015;517:321–6.
4. Bock C. Analysing and interpreting DNA methylation data. Nat Rev Genet.
2012;13:705–19.
5. Robinson MD, Kahraman A, Law CW, Lindsay H, Nowicka M, Weber LM,
Zhou X. Statistical methods for detecting differentially methylated loci
and regions. Front Genet. 2014;5:324.
6. Eckhardt F, Lewin J, Cortese R, Rakyan VK, Attwood J, Burger M, Burton J,
Cox TV, Davies R, Down TA, Haefliger C, Horton R, Howe K, Jackson DK,
Kunde J, Koenig C, Liddle J, Niblett D, Otto T, Pettett R, Seemann S,
Thompson C, West T, Rogers J, Olek A, Berlin K, Beck S. DNA
methylation profiling of human chromosomes 6, 20 and 22. Nat Genet.
2006;38:1378–85.
7. Liu Y, Li X, Aryee MJ, Ekström TJ, Padyukov L, Klareskog L, Vandiver A,
Moore AZ, Tanaka T, Ferrucci L, Fallin MD, Feinberg AP. GeMes, clusters
of DNA methylation under genetic control, can inform genetic and
epigenetic analysis of disease. Am J Hum Genet. 2014;94:485–95.
8. Zhang W, Spector TD, Deloukas P, Bell JT, Engelhardt BE. Predicting
genome-wide DNA methylation using methylation marks, genomic
position, and DNA regulatory elements. Genome Biol. 2015;16:14.
24.
25.
26.
27.
28.
29.
30.
31.
32.
Akalin A, Kormaksson M, Li S, Garrett-Bakelman FE, Figueroa ME,
Melnick A, Mason CE. mehylKit: a comprehensive R package for the
analysis of genome-wide DNA methylation profiles. Genome Biol.
2012;13 R87.
Hansen KD, Langmead B, Irizarry RA. BSmooth: from whole genome
bisulfite sequencing reads to differentially methylated regions. Genome
Biol. 2012;13 R83.
Hebestreit K, Dugas M, Klein HU. Detection of significantly differentially
methylated regions in targeted bisulfite sequencing data; 2013.
Dolzhenko E, Smith AD. Using beta-binomial regression for highprecision differential methylation analysis in multifactor whole-genome
bisulfite sequencing experiments. BMC Bioinformatics. 2014;15:215.
Park Y, Figueroa ME, Rozek LS, Sartor MA. MethylSig: a whole genome
DNA methylation analysis pipeline. Bioinformatics. 2014;30:2414–22.
Sun D, Xi Y, Rodriguez B, Park H. J, Tong P, Meong M, Goodell MA, Li W.
MOABS: model based analysis of bisulfite sequencing data. Genome Biol.
2014;15 R38.
Wu H, Xu T, Feng H, Chen L, Li B, Yao B, Qin Z, Jin P, Conneely KN.
Detection of differentially methylated regions from whole-genome
bisulfite seqeuencing data without repicates. Nucl Acids Res.
2015;33 e141.
Park Y, Wu H. Differential methylation analysis for BS-seq data under
general experimental design. Bioinformatics. 2016;32:1446–53.
Wen Y, Chen F, Zhang Q, Zhuang Y, Li Z. Detection of differentially
methylated regions in whole genome bisulfite sequencing data using
local Getis-Ord statistics. Bioinformatics. 2016;32:3396–404.
Matsui Y, Mizuta M, Ito S, Miyano S, Shimamura T. D3 M: Detection of
differential distributions of methylation levels. Bioinformatics. 2016;32:
2248–55.
Wang X, Gu J, Hilakivi-Clarke L, Clarke R, Xuan J. DM-BLD: differential
methylation detection using a hierarchical Bayesian model exploiting
local dependency. Bioinformatics. 2016;33:161–8.
Landan G, Cohen NM, Mukamel Z, Bar A, Molchadsky A, Brosh R,
Horn-Saban S, Zalcenstein DA, Goldfinger N, Zundelevich A,
Gal-Yam EN, Rotter V, Tanay A. Epigenetic polymorphism and the
stochastic formation of differentially methylated regions in normal and
cancerous tissues. Nat Genet. 2012;44:1207–14.
Li S, Garrett-Bakelman F, Perl AE, Luger SM, Zhang C, To BL, Lewis ID,
Brown AL, D’Andrea RJ, Ross ME, Levine R, Carroll M, Melnick A, Mason
CE. Dynamic evolution of clonal epialleles revealed by methclone.
Genome Biol. 2014;15:472.
Jenkinson G, Pujadas E, Goutsias J, Feinberg AP. Potential energy
landscapes identify the information-theoretic nature of the epigenome.
Nat Genet. 2017;49:719–29.
Lin P, Forêt S, Wilson SR, Burden CJ. Estimation of the methylation
pattern distribution from deep sequencing data. BMC Bioinformatics.
2014;16:145.
Jühling F, Kretzmer H, Bernhart SH, Otto C, Stadler PF, Hoffmann S.
metilene: fast and sensitive calling of differentially methylated regions
from bisulfite sequencing data. Genome Res. 2016;26:256–62.
Baxter RJ. Exactly Solved Models in Statistical Mechanics. London:
Academic Press; 1982.
Boyes J, Bird A. Repression of genes by DNA methylation depends on
CpG density and promoter strength: evidence for involvement of a
methyl-CpG binding protein. EMBO J. 1992;11:327–33.
Illingworth RS, Bird AP. CpG islands – ‘a rough guide’. FEBS Lett. 2009;583:
1713–20.
Hermann A, Goyal R, Jeltsch A. The Dnmt1 DNA-(cytosine-C5)methyltransferase methylates DNA processively with high preference for
hemimethylated target sites. J Biol Chem. 2004;279:48350–9.
Vilkaitis G, Suetake I, Klimašauskas S, Tajima S. Processive methylation of
hemimethylated CpG sites by mouse Dnmt1 DNA methyltransferase. J
Biol Chem. 2005;280:64–72.
Jeltsch A. On the enzymatic properties of Dnmt1: specificity, processivity,
mechanism of linear diffusion and allosteric regulation of the enzyme.
Epigenetics. 2006;1:63–6.
Zhang W, Spector TD, Deloukas P, Bell JT, Engelhardt BE. Predicting
genome-wide DNA methylation using methylation marks, genomic
position, and DNA regulatory elements. Genome Biol. 2015;16:14.
Huyer W, Neumaier A. Global optimization by multilevel coordinate
search. J Global Optim. 1999;14:331–55.
Jenkinson et al. BMC Bioinformatics (2018) 19:87
33. Rios LM, Sahinidis NV. Derivative-free optimization: a review of algorithms
and comparison of software implementations. J Global Optim. 2013;56:
1247–93.
34. Burnham KP, Anderson DR. Mutimodal inference. Understanding AIC and
BIC in model selection. Sociol Method Res. 2004;33:261–304.
35. Luger K, Mäder AW, Richmond RK, Sargent DF, Richmond TJ. Crystal
structure of the nucleosome core particle at 2.8 Å resolution. Nature.
1997;389:251–60.
36. Jacobson HI. The maximum variance of restricted unimodal distributions.
Ann Math Stat. 1969;40:1746–52.
37. Lin J. Divergence measures based on the Shannon entropy. IEEE Trans
Inform Theory. 1991;37:145–51.
38. Endres DM, Schindelin JE. A new metric for probability distributions. IEEE
Trans Inform Theory. 2003;49:1858–60.
39. Benjamini Y, Yekutieli D. The control of the false discovery rate in multiple
testing under dependency. Ann Stat. 2001;29:1165–88.
40. Benjamini Y, Hochberg Y. Controlling the false discovery rate: a practical
and powerful approach to multiple testing. J R Statist Soc B. 1995;57:
289–300.
41. Gonzalez RC, Woods RE. Digital Image Processing, 3rd edn. Upper Saddle
River, New Jersey: Prentice-Hall; 2008.
42. Noble WS. How does multiple testing correction work?. Nat Biotechnol.
2009;27:1135–7.
43. Fisher RA. Statistical Methods, Experimental Design, and Statistical
Inference, 2nd edn. Oxford: Oxford University Press; 1990.
44. Eden E, Navon R, Steinfeld I, Lipson D, Yakhini Z. GOrilla: a tool for
discovery and visualization of enriched GO terms in ranked gene lists.
BMC Bioinformatics. 2009;10:48.
45. Breitling R, Armengaud P, Amtmann A, Herzyk P. Rank products: a
simple, yet powerful, new method to detect differentially regulated
genes in replicated microarray experiments. FEBS Lett. 2004;573:83–92.
46. Heskes T, Eisinga R, Breitling R. A fast algorithm for determining bounds
and accurate approximate p-values of the rank product statistic for
replicate experiments. BMC Bioinformatics. 2014;15:367.
47. Onganer PU, Seckl MJ, Djamgoz MB. Neuronal characteristics of
small-cell lung cancer. Br J Cancer. 2005;93:1197–201.
48. Kalari S, Jung M, Kernstine KH, Takahashi T, Pfeifer GP. The DNA
methylation landscape of small cell lung cancer suggests a differentiation
defect of neuroendocrine cells. Oncogene. 2013;32:3559–68.
49. Lu R, Fan C, Shangguan W, Liu Y, Li Y, Shang Y, Yin D, Zhang S,
Huang Q, Li X, Meng W, Xu H, Zhou Z, Hu J, Li W, Liu L, Mo X. Neurons
generated from carcinoma stem cells support cancer progression. Signal
Transduct Target Ther. 2017;2:16036.
50. Visel A, Minovitsky S, Dubchak I, Pennacchio LA. VISTA enhancer
browser - a database of tissue-specific human enhancers. Nucleic Acids
Res. 2007;35:88–92.
51. Wu H, Caffo B, Jaffee HA, Irizarry RA, Feinberg AP. Redefining CpG
islands using hidden Markov models. Biostatistics. 2010;11:499–514.
52. Valdmanis PN, Roy-Chaudhuri B, Kim HK, Sayles LC, Zheng Y,
Chuang CH, Caswell DR, Chu K, Zhang Y, Winslow MM,
Sweet-Cordero EA, Kay MA. Upregulation of the microRNA cluster at the
Dlk1-Dio3 locus in lung adenocarcinoma. Oncogene. 2015;34:94–103.
53. Molina-Pinelo S, Salinas A, Moreno-Mata N, Ferrer I, Suarez R,
Andrés-León E, Rodríguez-Paredes M, Gutekunst J, Jantus-Lewintre E,
Camps C, Carnero A, Paz-Ares L. Impact of DLK1-DIO3 imprinted cluster
hypomethylation in smoker patients with lung cancer. Oncotarget.
2018;9:4395–410.
Page 23 of 23
Submit your next manuscript to BioMed Central
and we will help you at every step:
• We accept pre-submission inquiries
• Our selector tool helps you to find the most relevant journal
• We provide round the clock customer support
• Convenient online submission
• Thorough peer review
• Inclusion in PubMed and all major indexing services
• Maximum visibility for your research
Submit your manuscript at
www.biomedcentral.com/submit