Comparison of discriminative motif optimization using matrix and DNA shape-based models
Bạn đang xem bản rút gọn của tài liệu. Xem và tải ngay bản đầy đủ của tài liệu tại đây (671.78 KB, 8 trang )
Ruan and Stormo BMC Bioinformatics (2018) 19:86
/>
METHODOLOGY ARTICLE
Open Access
Comparison of discriminative motif
optimization using matrix and DNA
shape-based models
Shuxiang Ruan and Gary D. Stormo*
Abstract
Background: Transcription factor (TF) binding site specificity is commonly represented by some form of matrix
model in which the positions in the binding site are assumed to contribute independently to the site’s activity. The
independence assumption is known to be an approximation, often a good one but sometimes poor. Alternative
approaches have been developed that use k-mers (DNA “words” of length k) to account for the non-independence,
and more recently DNA structural parameters have been incorporated into the models. ChIP-seq data are often
used to assess the discriminatory power of motifs and to compare different models. However, to measure the
improvement due to using more complex models, one must compare to optimized matrix models.
Results: We describe a program “Discriminative Additive Model Optimization” (DAMO) that uses positive and
negative examples, as in ChIP-seq data, and finds the additive position weight matrix (PWM) that maximizes the
Area Under the Receiver Operating Characteristic Curve (AUROC). We compare to a recent study where structural
parameters, serving as features in a gradient boosting classifier algorithm, are shown to improve the AUROC over
JASPAR position frequency matrices (PFMs). In agreement with the previous results, we find that adding structural
parameters gives the largest improvement, but most of the gain can be obtained by an optimized PWM and nearly
all of the gain can be obtained with a di-nucleotide extension to the PWM.
Conclusion: To appropriately compare different models for TF bind sites, optimized models must be used. PWMs
and their extensions are good representations of binding specificity for most TFs, and more complex models,
including the incorporation of DNA shape features and gradient boosting classifiers, provide only moderate
improvements for a few TFs.
Keywords: Motif, Motif optimization, ChIP-seq, Position weight matrix, DNA shape features
Background
The interaction between proteins and genomic DNA
plays a crucial role in many important cellular processes.
For instance, the RNA polymerase interacts with DNA
during transcription and uses it as a template for RNA
synthesis [1] and the formation of nucleosomes involves
histones and DNA binding together to form a welldefined three-dimensional structure [2]. Some epigenetic
modifications such as DNA methylation, which alter DNA
accessibility and chromatin structures, are carried out by
the DNA methyltransferase and other proteins that mainly
* Correspondence:
Department of Genetics and Edison Family Center for Genome Sciences and
Systems Biology, Washington University School of Medicine, St. Louis 63110,
USA
target CpG di-nucleotides [3]. The sequence-specific transcription factors (TFs) are a special class of DNA-binding
proteins that recognize specific DNA sequences and primarily regulate gene expression [4, 5]. In most species,
they constitute between 5% and 10% of all genes [6–8].
Although some prominent TFs, including Sox [9], AP-1
[10, 11] and Sp1 [12], have been studied extensively, the
binding specificities of most TFs are poorly documented
even in many well-studied species [13]. In recent years,
several high-throughput experimental techniques, such as
high-throughput SELEX (HT-SELEX), protein-binding
microarrays (PBMs) and ChIP-seq, have been developed
to estimate the relative binding affinities of large numbers
of DNA sequences both in vitro and in vivo [14–17].
These techniques have greatly accelerated the study of TF
© The Author(s). 2018 Open Access This article is distributed under the terms of the Creative Commons Attribution 4.0
International License ( which permits unrestricted use, distribution, and
reproduction in any medium, provided you give appropriate credit to the original author(s) and the source, provide a link to
the Creative Commons license, and indicate if changes were made. The Creative Commons Public Domain Dedication waiver
( applies to the data made available in this article, unless otherwise stated.
Ruan and Stormo BMC Bioinformatics (2018) 19:86
binding specificity [4], but the analysis of their results
proves challenging and requires the development of novel
TF binding models and motif discovery algorithms.
The specificity of TFs is commonly represented by
matrix models, of which there are several varieties [18].
In probabilistic models, such as position frequency
matrices (PFMs), the matrix elements are the probability
of each base occurring at each position in the binding
site and the probability of a specific site is the product
of those probabilities for the base at each position. In a
more general position weight matrix (PWM), the
elements of the matrix are added together to get the
score for a specific binding site. Trained on quantitative
binding data, regression methods can be used to obtain
matrix elements that correspond to energy contributions
of each base at each position [19–21]. All matrix models
have in common the assumption that the positions of a
binding site contribute independently to its activity, an
assumption that is often a good approximation but not
always [22–24]. More complex models utilize k-mers,
short DNA words of length k, to account for nonindependence between positions [21, 22, 25–27].
Recently there have been several studies showing that
variations in DNA shape can influence TF binding
affinity, and that those contributions may involve nonindependence between positions [28–31]. DNAshape is
a program that predicts DNA structural features in a
high-throughput manner based on Monte Carlo simulations of DNA fragments [32]. The Genome Browser for
DNA shape annotations (GBshape), a database based on
DNAshape and related computational tools, provides
DNA shape feature predictions for a range of organisms
[33]. Those resources were used in a recent study where
motif models using gradient boosting classifiers were
trained to differentiate ChIP-seq peaks from random
background sequences, showing that adding DNA shape
features can significantly improve the accuracy of the
classifiers [34].
In this report, we replicate the results of Mathelier et
al. [34] and we compare the performance of the gradient
boosting classifiers to simple PWMs generated by
DAMO, a perceptron-based optimization method that
finds the optimal PWM with the highest area under the
receiver operating characteristic curve (AUROC).
DAMO is similar to our previously described DiMO
[35], but where DiMO provided optimized PFMs,
DAMO provides optimized PWMs which have recently
been shown to avoid the inherent limitations of probabilistic models [36]. DAMO also allows for the inclusion of adjacent di-nucleotides if the independence
assumption provides poor performance. Our results
confirm that adding DNA shape features in a gradient
boosting classifier does significantly improve the performance over the initial JASPAR PFMs, but also show
Page 2 of 8
that most of the improvement can be obtained with
optimal PWMs, and adding di-nucleotide contributions
performs nearly as well as the much more complex gradient boosting classifiers including shape parameters.
Methods
JASPAR PFMs
Following the study of Mathelier et al. [34], we obtained
75 JASPAR PFMs that can be associated with ChIP-seq
datasets generated by the ENCODE project [37]. (Their
work included 76 PFMs but one of those (ID:
MA0133.1) is no longer available in the March 2017
JASPAR CORE collection).
ChIP-seq datasets
We used the same ChIP-seq datasets analyzed by
Mathelier et al. [34] and downloaded 396 uniformly
processed human ENCODE ChIP-seq datasets associated with the 75 JASPAR PFMs from the UCSC Genome
Browser [38]. For each ChIP-seq peak, we retrieved the
100 bp sequence centered on the point-source of the
peak from the human genome assembly hg19, which
serves as a positive sequence for training and testing TF
binding models. For each positive sequence, we also
constructed a negative sequence, which is the 100 bp
sequence 100 bp downstream from the positive sequence
in the human genome. We also tested performance
when the negative sequences were obtained from
5000 bp downstream. For each ChIP-seq dataset, we
constructed 10 training and 10 testing sets for 10-fold
cross-validation, where each training set is 9 times the
size of a testing set. We also tested performance when
the training set and testing set were each only 10% of
the total data.
DNA shape features
We retrieved the same DNA shape features used by
Mathelier et al. [34] from GBshape [33]. The features include the helix twist (HelT), the minor groove width
(MGW), the propeller twist (ProT), the roll (Roll), and
the corresponding second-order shape features. These
features were only used for training and testing models
designated with “+ shape”.
Motif optimization algorithms evaluated
Table 1 lists the motif optimization algorithms evaluated
in this study. Of the 9 algorithms, 5 are based on the
DNAshapedTFBS program, which trains a binary classifier using the gradient boosting algorithm [34]. These 5
algorithms differ in two aspects: 1) how the feature
vector is encoded, and 2) whether the feature vector
includes DNA shape features. In the 4bit encoding,
which was used by Mathelier et al., A is encoded as
1000, T as 0100, G as 0010, and C as 0001. In JASPAR +
Ruan and Stormo BMC Bioinformatics (2018) 19:86
Page 3 of 8
Table 1 Descriptions of the motif optimization algorithms evaluated
Algorithm
Output
Description
JASPAR
Position frequency matrix
PFMs from the JASPAR database
DAMO
Position weight matrix
Modified DiMO program that outputs PWMs instead of PFMs
DAMO_PFM
Position frequency matrix
PFMs derived from the DAMO single-nucleotide PWMs
DAMO_dinuc
Position weight matrix
The adjacent di-nucleotide mode of DAMO
DNAshapedTFBS_4bit
Gradient boosting classifier
DNAshapedTFBS with 4-bit encoding
DNAshapedTFBS_4bit + shape
Gradient boosting classifier
DNAshapedTFBS_4bit plus DNA shape features
Shape_only
Gradient boosting classifier
The feature vector contains only DNA shape features
JASPAR + shape
Gradient boosting classifier
JASPAR PFM score plus DNA shape features
DAMO + shape
Gradient boosting classifier
DAMO single-nucleotide PWM score plus DNA shape features
shape and DAMO + shape the sequence information is
included simply as a score from a matrix model and in
Shape_only it is not included at all. The remaining 4
algorithms are simple matrix models from the single nucleotide and adjacent di-nucleotide mode of the DAMO
program, the JASPAR PFMs and PFMs obtained from
the DAMO PWMs (which are equivalent to the original
DiMO PFMs). DAMO is a Python implementation of
the DiMO program, which is based on perceptron learning and finds the optimal PWM by maximizing its
AUROC score [35]. The original DiMO program outputs
a normalized PFM derived from the optimal PWM, even
though it uses a PWM internally for optimization. Because PWMs do not have the limitations of probabilistic
PFMs [36], we configured the DAMO program to
output the optimal PWM directly and we also allow for
adjacent di-nucleotides to be included to capture nonindependent contributions from adjacent positions in
the binding sites [21, 27].
Training and testing binding models
The training and testing procedures are based on the
methods described by Mathelier et al. [34].
Preprocessing
We first use the JASPAR PFM to scan all the positive
and negative sequences in both the training and testing
set, and identify the best binding site, which has the
same length as the PFM, within each sequence. Then we
use the DNAshapedTFBS program to extract the DNA
sequence of each best site and the corresponding DNA
shape features. The sequences of the best sites, instead
of the full-length positive and negative sequences, are
used in the following steps for training and testing TF
binding models. This means that we are not testing
motif discovery algorithms, because the positive and
negative sites are predefined. Rather, we are testing how
well models of different complexity can perform classification after optimization for that task (except for the
original JASPAR PFMs).
Training
The training procedure depends on the motif
optimization algorithm. For the DNAshapedTFBS-based
methods, we first construct, for each best site in the
training set, a feature vector containing its JASPAR PFM
score, the DAMO PWM score or encoded DNA sequence. If the method takes account of the DNA shape
features, the feature vector also contains the normalized
values of the 8 DNA shape features at each position.
Then a gradient boosting classifier is trained on the
positive and negative feature vectors. For DAMO, the
sequences of the positive and negative sites are directly
fed into the program along with the JASPAR PFM,
which serves as a seed matrix. DAMO then finds the optimal PWM that maximizes the AUROC on the training
set, using the perceptron training algorithm. The perceptron training, described in detail previously [35], updates
the PWM by error correction on the mis-classified sites,
those in the positive set with lower scores than the best
negative site, and the negative sites with scores higher
than the lowest positive site, and training proceeds until
convergence. The sequences can be encoded using
adjacent dinucleotides to capture non-independent
contributions between those positions [18, 21, 27]. The
DAMO_PFM model is obtained by considering the
DAMO PWMs scores as energies and converting to
normalized probabilities (as in the original DiMO
approach [35]).
Testing
The testing procedure is the same for all the algorithms.
The trained gradient boosting classifiers and the different PFM and PWM models are used to score all the
positive and negative sites in the testing set. Those
scores are used to rank the sites and compute the area
under the precision recall curve (AUPRC) and the area
under the receiver operating characteristic curve
(AUROC) based on the true labels of the ranked sites.
We report the mean values and standard deviations
from ten-fold cross-validation tests.
Ruan and Stormo BMC Bioinformatics (2018) 19:86
Page 4 of 8
Results
For each algorithm, the mean and standard deviation of
the AUPRC scores for the 396 samples, on both training
and testing sets, are summarized in Table 2. (AUROC
scores are reported in Additional file 1: Table S1.) As
reported previously, adding shape parameters to the
JASPAR PFMs significantly improves the AUPRC [34].
We obtain a mean increase of 0.034, equivalent to
adding shape parameters to the DAMO scores, and larger than the improvement of any other model. But just
optimizing the PFM, with the DAMO_PFM model, captures about 35% of the total improvement. The PWM
obtained by DAMO provides nearly 60% of the total
improvement and demonstrates the inherent advantage
of a PWM model over a PFM model as we showed
previously [36]. Adding parameters for adjacent dinucleotides captures nearly 80% of the improvement
over the JASPAR PFM model. All of those models are
simple matrix models where the positions contribute
independently to the total score of a site, except that in
the DAMO_dinuc model the adjacent dinucleotides
contribute additively to the score. The gradient boosting
classifiers, which use an ensemble of decision trees for
classification, are complex non-linear models even without the shape parameters. The 4bit model, whose input
is only the sequence, increases performance to 88% of
the best model and adding shape parameters to the 4bit
classifier increases performance to essentially the same
as JASPAR + shape and DAMO + shape. Interestingly,
the Shape_only model does nearly as well as any other
gradient boosting classifier model, indicating that the
shape parameters inherently contain the sequence information (see Discussion). We also tested performance
when the negative sequence set was selected at a
distance of 5000 bp instead of 100 bp downstream
(Additional file 2: Tables S2). In that case the performance on both the training and testing sets was increased,
probably because sequences in the negative set that are
only 100 bp downstream of the ChIP-seq peak may also
contain true binding sites. But the overall results are
Table 2 Mean AUPRC (and standard deviation) on ChIP-seq data
Algorithm
Training
Testing
JASPAR
0.812 (0.132)
0.812 (0.132)
DAMO
0.834 (0.119)
0.832 (0.120)
DAMO_PFM
0.825 (0.120)
0.824 (0.122)
DAMO_dinuc
0.844 (0.114)
0.839 (0.119)
DNAshapedTFBS_4bit
0.854 (0.105)
0.842 (0.115)
DNAshapedTFBS_4bit + shape
0.875 (0.090)
0.845 (0.113)
Shape_only
0.871 (0.089)
0.840 (0.112)
JASPAR + shape
0.878 (0.089)
0.846 (0.112)
DAMO + shape
0.879 (0.090)
0.846 (0.113)
consistent with the initial findings. While the increase in
AUPRC of JASPAR + shape over JASPAR PFMs is now
0.065, nearly 70% of that increase is captured using the
DAMO PWMs, and nearly 90% is captured by the
DAMO_dinuc model.
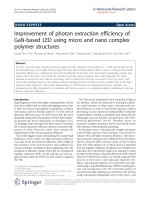
The gap between the training and testing scores is a
measure of overfitting for a model, which generally corresponds to the complexity of the model. Specifically,
the highly non-linear DNAshapedTFBS-based models,
with their ensemble of decision trees, have larger gaps
than the PFM and PWM models, which are linear
models (Fig. 1). In fact, the training and testing scores of
the linear models are nearly identical. The largest gaps,
> 0.03, are associated with the DNAshapedTFBS-based
models with DNA shape features, presumably because
their feature vectors are most complex. This effect also
shows up in the sensitivity of the complex models to the
size of the training data. Additional file 3: Table S3
shows results for several of the models when trained on
only 1/10 of the data, the same as the testing sample
size, and much smaller than the normal training on 9/10
of the data. All of the models, except for the JASPAR
PFMs which are untrained, increase the AUPRC and
AUROC scores on the training data and decrease those
scores on the testing data. On those small training sets
the DAMO PWMs score as well as the more complex
models on the testing sets.
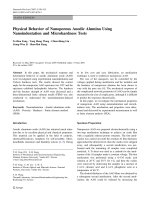
Figure 2 compares graphically the results reported in
Table 2, with points for each of the 396 ChIP-seq datasets. The top eight panels have the JASPAR + shape
AUPRC results on the vertical axis and each of the other
eight models on the horizontal axis. Consistent with
Table 2, there is a large improvement from the JASPAR
scores alone (Fig. 2a). For the DAMO PWMs (Fig. 2b)
there are many fewer data sets with large improvement.
The DAMO PFMs are much better than the JASPAR
PFMs, as expected because those JASPAR PFMs have
not been optimized for this task, but are not as good as
the DAMO PWMs showing the inherent limitations of
PFM models [36]. The DAMO_dinuc model (Fig. 2d)
has very few datasets with large improvements. In each
of the other models, which come from the gradient
boosting classifier (Fig. 2e-h), the data points cluster
near the diagonal, indicating that the difference between
the two scores of the same sample is very small. The
bottom row of panels in Fig. 2 show the score differences, in ascending order, between similar models. Note
the differences in scale on the vertical axes. In most
cases there are very few datasets with differences > 0.02,
except for the comparison of the JASPAR scores and
JASPAR + shape, where many datasets show improvements > 0.05 and a few are > 0.10. Most TFs have
multiple associated ChIP-seq data sets (median of three),
and the mean difference for every TF are shown in
Ruan and Stormo BMC Bioinformatics (2018) 19:86
Page 5 of 8
Fig. 1 Differences in AUPRC between training and testing datasets. For each model the differences are shown for each of the 396 datasets. The
box represents 1st, 2nd (median indicated with line) and 3rd quartiles and the whiskers represent 1.5 interquartile range (IQR) below or above
1st or 3rd quartiles
Fig. 2 Comparison of AUPRC scores for different models. a-h JASPAR + shape on vertical axis and each of the other eight models on the
horizontal axis. i Difference in AUPRC for DAMO PWM with and without di-nucleotides. j Difference in AUPRC for DAMO PWM and DAMO PFM.
k-l Differences with adding shape features to the 4bit model and the JASPAR PFM model
Ruan and Stormo BMC Bioinformatics (2018) 19:86
Additional file 4: Table S4. Except for the comparison of
JASPAR + shape with JASPAR, very few of the TFs have
mean differences > 0.02, suggesting that feature vectors
based only on sequence, optimized for AUROC scores
but without including structure parameters, capture
essentially all of the discriminatory power of the motifs.
However, the motifs using the ensemble of decision trees
do contain higher-order information beyond that available to simple PWMs, most of which is captured by
using di-nucleotide extensions of PWMs.
Discussion
Our results confirm that adding DNA shape features significantly improves the performance of JASPAR PFMs,
with a mean increase of 0.034 in AUPRC. Simply optimizing the PFMs for the task of maximizing AUROC
captures over one-third of that difference. An optimized
PWM captures most of the improvement, and adding
di-nucleotide parameters helps further. The gradient
boosting approach increased AUPRC slightly more, as
did adding shape parameters, but on the vast majority of
datasets the differences between the simple PWM
models and more complex models are small, consistent
with previous work showing that optimized PWMs are
often good approximations for TF specificity [22–24].
Including DNA shape features further increases the
number of parameters in a binding model, which increases the cost of training and may result in overfitting.
The fact that the performance of DAMO_dinuc is
similar to the non-linear gradient boosting classifiers
indicates that the majority of the deviations from the
assumption of position independence can be captured
by adjacent di-nucleotide interactions.
The success of the PWMs does not mean that the
structure of DNA plays no role in binding site recognition. In fact, there are good examples showing that it
does [28–30, 39]. All of the models based on sequence
features alone are agnostic with respect to the mechanisms of specificity. They only describe mathematically
how much each base at each position contributes to
binding specificity, or in the case of higher-order contributions, how useful those are in discriminating the positive and negative training sets. Because DNA structure
depends on sequence, redundancies arise when using
both types of parameters together. In fact, given a sufficiently long sequence (such as a genome) encoded solely
with structure parameters, a good compression algorithm could reconstruct the sequence exactly, demonstrating that the structure information contains within it
the sequence information. This is also clear from our results with the Shape_only model. Certainly interactions
between the TF and the bases of the DNA sequence are
the primary contributions to binding affinity. But encoding the sequence using only structural parameters
Page 6 of 8
performs nearly as well as using input vectors including
both sequence and structure because the sequence is
redundant given the structure.
We advocate using the most efficient algorithm, with
the least number of parameters, that obtains the maximum fit to quantitative data, or the optimal discrimination between positive and negative data sets. This
reduces the complexity of the model to only the nonredundant parameters, minimizes the training time and
reduces the susceptibility to over-fitting. Those optimal
parameters, including higher-order interactions as
needed, can be used to infer the mechanism of binding.
For example, if dinucleotides are required to obtain the
best fit, and the specific dinucleotides that correspond to
higher affinity (or better discrimination) are those correlated with a narrow minor groove, then one could infer
the TF prefers binding to DNA structures with narrow
minor grooves. But doing this after the mathematically
optimal parameters are obtained removes redundancies
in the feature vectors used for training which could
confound interpretation.
Discrimination of binding sites from ChIP-seq data,
such as with AUPRC or AUROC scores, is a popular
method for assessing the accuracy of TF motifs [40].
However, those scores are inherently rank based and
miss other important aspects of binding activity such as
the relative binding affinity between different binding
sites [17, 20]. Therefore PWMs, and other motifs, obtained simply by maximizing AUPRC or AUROC scores
should not be used as predictors of relative binding
affinity. To do that they should be rescaled by reference
to some external binding data, preferably from quantitative in vitro experiments. Alternatively, one can
assume that the majority of peaks contain binding
sites within some constrained range of binding affinity, perhaps within 100-fold of the maximum, and use
that assumption to scale the PWM to approximate
binding energies [20].
Conclusions
To address the issue of whether matrix models, which
assume independent contributions across the positions
of the binding site, are adequate representations of
specificity requires appropriate comparisons. To compare
complex models that have been optimized for a specific
task, such as maximizing AUROC, to PFM/PWM models
that have been obtained from other types of data or for
other tasks, confounds the comparison between the type
of model and the method for obtaining the model parameters. We show that simple PWM models, when optimized
for maximum AUROC, perform nearly as well as more
complex non-linear models. We also show the advantages
of PWMs over PFMs, and that including adjacent dinucleotides in the additive PWM model can further enhance its
Ruan and Stormo BMC Bioinformatics (2018) 19:86
performance on at least some of the datasets. While DNA
structure certainly contributes to binding affinity, at least
in some cases, we advocate for finding mathematically
optimal models that are simple and efficient but agnostic
as to mechanism, and then inferring the mechanisms
that contribute to binding affinity as further steps in
the analysis.
Page 7 of 8
6.
7.
8.
9.
Additional files
10.
Additional file 1: Table S1. Mean AUROC (and standard deviation) on
ChIP-seq data. (DOCX 13 kb)
11.
Additional file 2: Table S2. Effect of Method for Generating Negative
Sequences on Training and Testing Scores. (DOCX 13 kb)
12.
Additional file 3: Table S3. Scores for the motif optimization algorithms
on ChIP-seq data with small training sets. (DOCX 12 kb)
Additional file 4: Table S4. AUPRC and AUROC differences between
model pairs by TF. (XLSX 32 kb)
Acknowledgements
The authors are grateful to members of the Stormo lab for helpful comments
and suggestions and to the anonymous reviewers for providing comments that
further improved the manuscript.
13.
14.
15.
Funding
This work has been supported by the National Institutes of Health
[grant numbers HG000249, T32 HG000045].
Availability of data and materials
Project name: Discriminative Additive Model Optimization (DAMO).
Project home page: />Operating system(s): Platform independent.
Programming language: Python 2.7.
License: GNU GPL v3.0.
Any restrictions to use by non-academics: license needed.
Authors’ contributions
GDS conceived the research project. SR developed the software and
performed the experiments. GDS and SR analyzed and interpreted the data.
GDS and SR wrote, reviewed and approved the final manuscript.
Ethics approval and consent to participate
Not applicable.
Consent for publication
Not applicable.
16.
17.
18.
19.
20.
21.
22.
23.
Competing interests
The authors declare that they have no competing interests.
24.
Received: 9 October 2017 Accepted: 1 March 2018
25.
References
1. Buratowski S. The basics of basal transcription by RNA polymerase II. Cell.
1994;77(1):1–3.
2. McGhee JD, Felsenfeld G. Nucleosome structure. Annu Rev Biochem.
1980;49:1115–56.
3. Jones PA. Functions of DNA methylation: islands, start sites, gene bodies
and beyond. Nat Rev Genet. 2012;13(7):484–92.
4. Stormo GD, Zhao Y. Determining the specificity of protein-DNA interactions.
Nat Rev Genet. 2010;11(11):751–60.
5. Pabo CO, Sauer RT. Transcription factors: structural families and principles of
DNA recognition. Annu Rev Biochem. 1992;61:1053–95.
26.
27.
28.
29.
de Boer CG, Hughes TR. YeTFaSCo: a database of evaluated yeast
transcription factor sequence specificities. Nucleic Acids Res.
2012;40(Database issue):D169–79.
Rhee DY, Cho DY, Zhai B, Slattery M, Ma L, Mintseris J, Wong CY, White KP,
Celniker SE, Przytycka TM, et al. Transcription factor networks in Drosophila
melanogaster. Cell Rep. 2014;8(6):2031–43.
Vaquerizas JM, Kummerfeld SK, Teichmann SA, Luscombe NM. A census of
human transcription factors: function, expression and evolution.
Nat Rev Genet. 2009;10(4):252–63.
Mertin S, McDowall SG, Harley VR. The DNA-binding specificity of SOX9 and
other SOX proteins. Nucleic Acids Res. 1999;27(5):1359–64.
Kouzarides T, Ziff E. Leucine zippers of fos, Jun and GCN4 dictate
dimerization specificity and thereby control DNA binding. Nature. 1989;
340(6234):568–71.
Hai T, Curran T. Cross-family dimerization of transcription factors Fos/Jun
and ATF/CREB alters DNA binding specificity. Proc Natl Acad Sci U S A.
1991;88(9):3720–4.
Al-Sarraj A, Day RM, Thiel G. Specificity of transcriptional regulation by the
zinc finger transcription factors Sp1, Sp3, and Egr-1. J Cell Biochem.
2005;94(1):153–67.
Weirauch MT, Yang A, Albu M, Cote A, Montenegro-Montero A, Drewe P,
Najafabadi HS, Lambert SA, Mann I, Cook K, et al. Determination and
inference of eukaryotic transcription factor sequence specificity. Cell.
2014;158(6):1431–43.
Jolma A, Kivioja T, Toivonen J, Cheng L, Wei G, Enge M, Taipale M,
Vaquerizas JM, Yan J, Sillanpaa MJ, et al. Multiplexed massively parallel
SELEX for characterization of human transcription factor binding
specificities. Genome Res. 2010;20(6):861–73.
Berger MF, Philippakis AA, Qureshi AM, He FS, Estep PW 3rd, Bulyk ML. Compact,
universal DNA microarrays to comprehensively determine transcription-factor
binding site specificities. Nat Biotechnol. 2006;24(11):1429–35.
Valouev A, Johnson DS, Sundquist A, Medina C, Anton E, Batzoglou S, Myers
RM, Sidow A. Genome-wide analysis of transcription factor binding sites
based on ChIP-Seq data. Nat Methods. 2008;5(9):829–34.
Zhang L, Martini GD, Rube HT, Kribelbauer JF, Rastogi C, FitzPatrick VD,
Houtman JC, Bussemaker HJ, Pufall MA. SelexGLM differentiates androgen
and glucocorticoid receptor DNA-binding preference over an extended
binding site. Genome Res. 2018;28(1):111–21.
Stormo GD. Modeling the specificity of protein-DNA interactions. Quant
Biol. 2013;1(2):115–30.
Foat BC, Morozov AV, Bussemaker HJ. Statistical mechanical modeling of
genome-wide transcription factor occupancy data by MatrixREDUCE.
Bioinformatics. 2006;22(14):e141–9.
Ruan S, Swamidass SJ, Stormo GD. BEESEM: estimation of binding energy
models using HT-SELEX data. Bioinformatics. 2017;33(15):2288–95.
Stormo GD, Schneider TD, Gold L. Quantitative analysis of the relationship
between nucleotide sequence and functional activity. Nucleic Acids Res.
1986;14(16):6661–79.
Weirauch MT, Cote A, Norel R, Annala M, Zhao Y, Riley TR, Saez-Rodriguez J,
Cokelaer T, Vedenko A, Talukder S, et al. Evaluation of methods for
modeling transcription factor sequence specificity. Nat Biotechnol. 2013;
31(2):126–34.
Benos PV, Bulyk ML, Stormo GD. Additivity in protein-DNA interactions: how
good an approximation is it? Nucleic Acids Res. 2002;30(20):4442–51.
Zhao Y, Stormo GD. Quantitative analysis demonstrates most transcription
factors require only simple models of specificity. Nat Biotechnol.
2011;29(6):480–3.
Agius P, Arvey A, Chang W, Noble WS, Leslie C. High resolution models of
transcription factor-DNA affinities improve in vitro and in vivo binding
predictions. PLoS Comput Biol. 2010;6(9)
Jiang B, Liu JS, Bulyk ML. Bayesian hierarchical model of protein-binding
microarray k-mer data reduces noise and identifies transcription factor
subclasses and preferred k-mers. Bioinformatics. 2013;29(11):1390–8.
Zhao Y, Ruan S, Pandey M, Stormo GD. Improved models for transcription
factor binding site identification using nonindependent interactions.
Genetics. 2012;191(3):781–90.
Abe N, Dror I, Yang L, Slattery M, Zhou T, Bussemaker HJ, Rohs R, Mann RS.
Deconvolving the recognition of DNA shape from sequence. Cell.
2015;161(2):307–18.
Rohs R, Jin X, West SM, Joshi R, Honig B, Mann RS. Origins of specificity in
protein-DNA recognition. Annu Rev Biochem. 2010;79:233–69.
Ruan and Stormo BMC Bioinformatics (2018) 19:86
Page 8 of 8
30. Rohs R, West SM, Sosinsky A, Liu P, Mann RS, Honig B. The role of DNA
shape in protein-DNA recognition. Nature. 2009;461(7268):1248–53.
31. Zhou T, Shen N, Yang L, Abe N, Horton J, Mann RS, Bussemaker HJ, Gordan
R, Rohs R. Quantitative modeling of transcription factor binding specificities
using DNA shape. Proc Natl Acad Sci U S A. 2015;112(15):4654–9.
32. Zhou T, Yang L, Lu Y, Dror I, Dantas Machado AC, Ghane T, Di Felice R, Rohs
R. DNAshape: a method for the high-throughput prediction of DNA
structural features on a genomic scale. Nucleic Acids Res.
2013;41(Web Server issue):W56–62.
33. Chiu TP, Yang L, Zhou T, Main BJ, Parker SC, Nuzhdin SV, Tullius TD, Rohs R.
GBshape: a genome browser database for DNA shape annotations. Nucleic
Acids Res. 2015;43(Database issue):D103–9.
34. Mathelier A, Xin B, Chiu TP, Yang L, Rohs R, Wasserman WW. DNA shape
features improve transcription factor binding site predictions in vivo.
Cell Syst. 2016;3(3):278–86. e274
35. Patel RY, Stormo GD. Discriminative motif optimization based on
perceptron training. Bioinformatics. 2014;30(7):941–8.
36. Ruan S, Stormo GD. Inherent limitations of probabilistic models for proteinDNA binding specificity. PLoS Comput Biol. 2017;13(7):e1005638.
37. Consortium EP. An integrated encyclopedia of DNA elements in the human
genome. Nature. 2012;489(7414):57–74.
38. Kent WJ, Sugnet CW, Furey TS, Roskin KM, Pringle TH, Zahler AM, Haussler D.
The human genome browser at UCSC. Genome Res. 2002;12(6):996–1006.
39. Spiro C, Bazett-Jones DP, Wu X, McMurray CT. DNA structure determines
protein binding and transcriptional efficiency of the proenkephalin cAMPresponsive enhancer. J Biol Chem. 1995;270(46):27702–10.
40. Orenstein Y, Shamir R. A comparative analysis of transcription factor binding
models learned from PBM, HT-SELEX and ChIP data. Nucleic Acids Res.
2014;42(8):e63.
Submit your next manuscript to BioMed Central
and we will help you at every step:
• We accept pre-submission inquiries
• Our selector tool helps you to find the most relevant journal
• We provide round the clock customer support
• Convenient online submission
• Thorough peer review
• Inclusion in PubMed and all major indexing services
• Maximum visibility for your research
Submit your manuscript at
www.biomedcentral.com/submit