ClustAGE: A tool for clustering and distribution analysis of bacterial accessory genomic elements
Bạn đang xem bản rút gọn của tài liệu. Xem và tải ngay bản đầy đủ của tài liệu tại đây (1.66 MB, 12 trang )
Ozer BMC Bioinformatics (2018) 19:150
/>
SOFTWARE
Open Access
ClustAGE: a tool for clustering and
distribution analysis of bacterial accessory
genomic elements
Egon A. Ozer
Abstract
Background: The non-conserved accessory genome of bacteria can be associated with important adaptive
characteristics that can contribute to niche specificity or pathogenicity of strains. High degrees of structural and
compositional diversity in genomic islands and other elements of the accessory genome can complicate
characterization of accessory genome contents among populations of strains. Methods for easily and effectively
defining the distributions of discrete elements of the accessory genome among bacterial strains in a population are
needed to explore the relationships between the flexible genome and bacterial adaptive traits.
Results: We have developed the open-source software package ClustAGE. This program, written in Perl, uses BLAST to
cluster nucleotide accessory genomic elements from the genomes of multiple bacterial strains and to identify their
distribution within the study population. The program output can be used in combination with strain phenotype data
or other characteristics to detect associations. Optional graphical output is available for visualizing accessory genome
gene content and distribution patterns. The capabilities of the software are demonstrated on a collection of 14
Pseudomonas aeruginosa genome sequences.
Conclusions: The ClustAGE software and utilities are effective for identifying characteristics and distributions of
accessory genomic elements among groups of bacterial genomes. The ability to easily and effectively characterize the
accessory genome of a sequence collection may provide a better understanding of the accessory genome’s
contribution to a species’ adaptation and pathogenesis. The ClustAGE source code can be downloaded from
and a limited web-based implementation is available at .
northwestern.edu/cgi-bin/clustage.cgi.
Keywords: Bacteria, Comparative genomics, Accessory genome, Flexible genome
Background
Gene content can vary greatly between closely related
strains of bacteria and between other unicellular organisms [1, 2]. Genes within a species can be divided into a
conserved core genome and a flexible accessory genome.
The core genome of an organism consists of genetic sequence that is conserved among all or nearly all members of the species. Conversely, the accessory genome
represents genetic material that is present in some, but
not all members of the species. The total complement of
genetic material within a species is known as the
Correspondence:
Department of Medicine, Division of Infectious Diseases, Northwestern
University Feinberg School of Medicine, Chicago, Illinois, USA
pangenome [3]. Among bacteria, modification of gene
content can arise from one of three major mechanisms:
gene loss, gene gain through duplication, and gene gain
through horizontal gene transfer (HGT) [4, 5]. Horizontally transferred genetic elements can include such structures as plasmids, integrative and conjugative elements
(ICEs), replacement islands, prophages and phage-like
elements, transposons, insertion sequences and integrons [6–8]. Collectively, these horizontally transferred
elements, as well as any contiguous stretch of genetic
material that is not part of the conserved core genome,
regardless of source or structure, can be referred to as
accessory genomic elements (AGEs).
The accessory genome of bacteria can be an important
source of phenotypic diversity [9]. Genes within the
© The Author(s). 2018 Open Access This article is distributed under the terms of the Creative Commons Attribution 4.0
International License ( which permits unrestricted use, distribution, and
reproduction in any medium, provided you give appropriate credit to the original author(s) and the source, provide a link to
the Creative Commons license, and indicate if changes were made. The Creative Commons Public Domain Dedication waiver
( applies to the data made available in this article, unless otherwise stated.
Ozer BMC Bioinformatics (2018) 19:150
accessory genome can drive environmental niche adaptation or pathogenesis within hosts [10, 11]. For
instance, in Pseudomonas aeruginosa, genes within the
accessory genome have been found to allow the organisms to persist in environments containing heavy metals
and toxic organic compounds that would otherwise be
unsuitable for P. aeruginosa habitation [12, 13]. In
Staphylococcus aureus, the S. aureus pathogenicity
islands (SaPIs) are a class of mobile genetic elements
that carry genes encoding such virulence factors as
TSST1, a toxin important in toxic shock syndrome, or
other toxins [14]. Antibiotic resistance genes are
frequently found in the accessory genomes of clinically
important bacterial pathogens. One example is the
carbapenemase-carrying plasmids in Klebsiella pneumoniae and other Gram-negative pathogens that contribute
to the spread of this phenotype in healthcare settings
[15, 16]. Given that bacterial accessory genomes are
known to be enriched in virulence factors [17], directed
study of the accessory genome contents and distributions within a population could yield new diagnostics
and therapeutics for bacterial infections.
Often AGEs are not discrete structures with welldefined borders and gene compositions, but instead can
be mosaic and fragmented with insertions of other elements, structural rearrangements, or partial deletions
[18]. Mosaic islands have previously been described in E.
coli [19] and Streptococcus pneumoniae [20]. In Pseudomonas aeruginosa, a genomic island containing the type
3 secretion system effector gene exoU was found to have
extensive homology and synteny of genes in this island
with genes in other P. aeruginosa islands PAPI-1 and
pKLC102 [21]. Given the possibly mosaic nature of
accessory genomic regions, accessory element characterization is often not as simple as screening genomes
for a discrete set of defined genomic islands or other horizontally transferred elements. Therefore, a robust analysis
of the pan-accessory genome of a set of bacterial strains
must be able to account for potential changes in structure
and composition of accessory regions between strains.
With the increase in availability and affordability of
whole-genome sequencing, large-scale genomic analyses
of populations of isolates have become more feasible.
Software packages, such as mga [22] Mauve [23], and
Mugsy [24], have been developed to perform segmented
alignments of complete genomes for the purposes of
aligning shared genomic regions. There are also several
bioinformatic tools that exist to characterize the core
and pangenome of bacterial species [25–28], but few
that specifically examine the accessory genome fraction.
To address the accessory genome of bacteria more
directly, the previously presented bioinformatic tools
Spine and AGEnt [29] were developed to identify the
conserved nucleotide core genome sequence in a set of
Page 2 of 12
genomic sequences and use this core genome sequence
to perform in silico subtractive hybridization to isolate
the accessory genome component of each strain. However, software such as Spine and AGEnt or others [30]
that characterize the accessory genome of bacterial
strains do not focus directly on providing the distribution of accessory elements in a study population. Such
distribution analyses are important for answering questions about the contributions of horizontally transferred
or subgroup-specific genetic elements that may contribute, for example, to a particular phenotype of interest or
to understanding particular niche adaptations.
This report describes ClustAGE, a software package that
clusters accessory genomic elements identified by Spine
and AGEnt from a set of genomes into discrete AGE units
to define the distribution of accessory elements among the
analyzed genomes. Several software tools such as DomClust [31], GCQuery [32], PanOCT [33] and OrthoDB [34]
have been developed for the purposes of clustering gene
sequences into orthologous groups. These programs identify clusters of related genes across bacterial genomes based
on gene sequences. The approach to accessory genome
characterization taken by ClustAGE differs from these
other approaches in that ClustAGE compares the
complete nucleotide sequences of the accessory genome rather than just the protein-coding sequences. A
nucleotide-sequence-based, gene-agnostic approach offers several advantages in characterizing AGE distributions. First, the identification of shared accessory
elements does not depend on annotation techniques,
which may differ in technique and results between
strains available from public databases or collaborators. Second, intergenic sequence distribution can be
studied, allowing distributions of non-protein-coding sequences such as promoter sequences or small RNAs with
potential biological relevance in the accessory genome of
the population to more easily be analyzed. Third, this approach has the potential to capture variable regions within
otherwise conserved genes that may have arisen by homologous recombination or other mechanisms. The data
generated by this software allow detailed analysis of the
flexible portion of a population’s pangenome.
Implementation
ClustAGE is a command-line tool built using the Perl
programming language for the purpose of analyzing and
comparing accessory genomic elements (AGEs) between
genomes. The source code is distributed as freeware
under the GNU General Public License version 3. The
core functionality of ClustAGE requires BLAST+ v2.3.0
[35, 36], of which binaries for OS X or Linux 64-bit are
included with the distributions. Optional features require
installation of the freeware programs gnuplot v5.0
(o/) and/or bwa v0.7.13 [37].
Ozer BMC Bioinformatics (2018) 19:150
ClustAGE takes as input sets of AGE nucleotide sequences previously identified from the genome sequences
of at least two separate organisms. These AGE sequence
sets can be extracted from complete or draft wholegenome nucleotide sequences using the previouslydeveloped software tools Spine and AGEnt [29]. The
ClustAGE algorithm identifies representative contiguous
AGEs within the input data set and delineates the
distribution of discrete AGEs among the strains’ genomes.
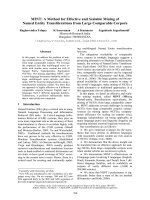
It consists of two steps: defining “bins” and defining
“subelements” (Fig. 1).
In the first step of this process, clustering of similar
AGE sequences into “bins” is performed. First, AGE sequences from all genomes input into ClustAGE are
pooled together to create a single nucleotide BLAST
database. AGE sequences are then sorted by size. In the
initial iteration of the clustering algorithm, the longest
contiguous AGE in the dataset is chosen as a bin representative. This bin sequence is then used as the query
sequence in a blastn alignment against the database of
all input AGE sequences. Alignment results are filtered
to remove any hits against AGEs from the same genome
as the bin representative, as well as hits below userdefined sequence identity and length cutoffs. BLAST hits
against AGE sequences that pass these filters are binned
with the representative sequence and removed from the
pool of potential bin representative sequences in
subsequent iterations. Conversely, all non-aligning AGE
sequences remain in the pool of potential bin representative sequences. If only part of an AGE sequence aligns
to the bin representative, the non-aligning portion of the
AGE sequence is isolated and added to the pool of potential bin representatives. Subsequent iterations of clustering select the next-longest complete or partial AGE
sequence that was not previously binned with a larger
bin representative sequence and uses it as the query sequence for alignment against the AGE sequence pool.
Clustering iterations continue in this fashion until no
bin representative sequences above a user-defined length
threshold remain in the pool.
Once AGE bins are defined, they are further subdivided into discrete units referred to as “subelements”.
Bins are divided into subelements between positions on
the reference AGE where the set of input genomes aligning to the reference AGE at the base or bases before the
division differs from the set of genomes aligning to the
reference AGE base or bases after the position (Fig. 2).
In other words, a subelement represents the longest
stretch of nucleotide sequence within the bin representative that is contiguous in all strains that contain it. By
dividing AGEs into discrete subelements, insertions and
deletions contributing to the mosaic nature of genomic
islands and other horizontally transferred elements can
be identified [38, 39].
Page 3 of 12
Output files from the core function of ClustAGE described above include nucleotide sequences of the bin representative and nucleotide sequences of AGE subelements
longer than a user-defined cutoff. A file listing positions
within the input sequences from which the bin representative AGEs were derived, as well as a file listing the positions of subelements within each AGE and the
distributions of each subelement among the input sequences are also output. Optionally, ClustAGE can produce plots of AGE distributions among the input genomes
for each of the bin representative AGEs (Fig. 2). This functionality requires gnuplot (o) to
produce the plots.
ClustAGE allows users to include coordinates and descriptions of protein coding sequences (CDS) within
accessory elements as input. If provided, information
about which coding sequences are contained within bins
and subelements is output for each AGE for which annotations in the bin reference sequence were given. If graphical output was requested, annotated gene positions and
directionality will be shown in the images (Fig. 2).
One limitation of working with draft genome
sequences generated by de novo assembly of short sequencing reads such as those produced by Illumina
sequencing technology is that the assembly process can
fail to assemble small portions of the genome even when
sufficient reads covering these regions are present in the
read data set. This in turn can lead to the false presumption that an AGE is absent from a genome when in fact
it simply failed to be properly assembled. To try to account for data missing from de novo generated draft
genome sequences assembled from Illumina reads, ClustAGE includes an option to identify missing AGE sequences from raw read sequences. After the set of AGEs
is identified from accessory genome sequences as detailed above, whole-genome Illumina sequencing data
provided to ClustAGE is aligned to the bin reference
AGE sequences using the ‘mem’ function of bwa aligner
with default settings [37]. To try to minimize falsepositive alignments of core genome read sequences to
accessory regions, a core genome nucleotide sequence,
such as output by Spine [29], can be provided to
ClustAGE. Any reads aligning to both the core genome
sequence and an AGE bin sequence will be excluded.
Reads aligning to AGEs above a user-defined minimum
depth of coverage and producing a contiguous alignment
exceeding a minimum user-defined sequence similarity
will be added to the binned sequence for that genome.
Alignment data from Illumina reads are only added in
AGE regions that were not found to have alignments
against a bin representative AGE in the original input
draft sequence for a genome. To minimize false-positive
results, read alignment data are also not added unless
the alignment region is either at one or both of the bin
Ozer BMC Bioinformatics (2018) 19:150
Page 4 of 12
Fig. 1 Schematic of ClustAGE clustering algorithm
representative AGE ends or contiguous with accessory
genomic sequence previously aligned by BLAST from assembly data. Subelements are then redefined using the
added read alignment data and a separate set of “readcorrected” subelement sequence and coordinate files are
output. If optional plotting of AGE distributions was
chosen, read-aligned AGE regions are plotted using a
different color to distinguish them from AGE alignments
derived from accessory genomic sequences (Fig. 2).
The ClustAGE results can be used to visualize and
compare relative similarity of total accessory genome
content among strains in the population studied. The
pipeline script subelements_to_tree.pl is provided with
ClustAGE for this purpose. The program quantifies
Ozer BMC Bioinformatics (2018) 19:150
Page 5 of 12
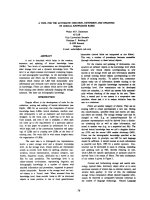
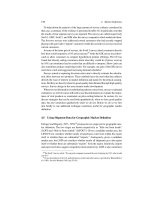
Fig. 2 Example of AGE figure generated by ClustAGE. Top row labeled “*annot*” shows coding sequences previously annotated within the bin
representative AGE with the strand on which the gene was found indicated by both color and arrow direction. The row with the red box
indicates the strain that was the source of the bin representative sequence. Remaining rows are labeled with the source genome name and
show the distribution of accessory element alignments against the bin representative AGE in blue. The intensity of color in each of the boxes
corresponds to the percent nucleotide identity of the alignment according to the blue gradient in the legend on the right. The green box
indicates AGE sequence that was not present in the assembled sequence of the PA103 strain, but for which alignments were found within the
whole-genome sequence Illumina read set. Color intensity of the read-aligned portions corresponds to percent nucleotide identity of the
alignment according to the green gradient in the legend at right. Vertical dashed lines show subelement borders. Lines dividing subelements
smaller than 20 bp are not shown
relative amount of shared subelement accessory genomic
sequence for each pair of genomes by calculating BrayCurtis distances [40]. Briefly, the Bray-Curtis distance for
a pair of genomes is calculated as d = 1 – (2 Sij / (Sii + Sjj))
where Sij is the total length, in bases, of subelements identified by ClustAGE in both genomes i and j and Sii and Sjj
are the total accessory genome subelement sizes, in bases,
of genomes i and j, respectively. In order to cluster strains
by total accessory genome similarity, a matrix of BrayCurtis distances for each pair of input strains is used to
create a neighbor-joining tree using the ‘neighbor’ function of PHYLIP version 3.696 [41]. Optional bootstrap
trees from random re-samplings of the data can be
generated using PHYLIP’s ‘seqboot’ and ‘neighbor’ functions. Bootstrap support values can then be calculated for
each branch of the neighbor-joining tree using the
CompareToBootstrap.pl script developed by Morgan N.
Price ( />In addition to the neighbor-joining tree, a matrix of
Bray-Curtis similarity values (1 – d) is output, as well as a
file that can be used to add a heatmap of Bray-Curtis
similarity values to the neighbor-joining tree in the
online tree visualization software Interactive Tree Of
Life () [42].
A utility for visualizing ClustAGE results as a panaccessory genome figure is also available. ClustAGE Plot
( />clustage_plot.cgi) uses CGView [43] to produce a representation of ClustAGE results as bins ordered largest to
smallest in a circular configuration with concentric rings
indicating the distributions of accessory elements for
each included strain. Although designed to be flexible,
user-friendly, and powerful enough for most users, visualizations with ClustAGE Plot could become less informative
with larger (i.e > 100 genomes) and/or high complexity
data sets. The xml-formatted file produced by ClustAGE
Plot can be downloaded and used to produce higher resolution images on a user’s local version of CGView. Furthermore, the output files generated by ClustAGE provide
sufficient data for further processing and can be reformatted to serve as input for other applications capable of visualizations such as R ( Circos
( or other 3rd party programs, depending
on the users’ needs and skills.
The ClustAGE scripts and utilities are available for
download at . A web-based
implementation of ClustAGE is also available at http://
vfsmspineagent.fsm.northwestern.edu/cgi-bin/clustage.cgi.
The web version is limited to a maximum of 15 accessory
genome sequence sets and does not support readcorrection of AGEs.
Results and discussion
Data set
To demonstrate the functionality of ClustAGE, Spine v0.
2.1 was used to identify the core and accessory genomic
sequences of a set of 12 Pseudomonas aeruginosa
strains, as described previously [29]. The 12 strain sequences used and their NCBI accession numbers were
19BR (AFXJ01000001.1), 213BR (AFXK01000001.1),
B136-33 (CP004061.1), DK2 (CP003149.1), LESB58
(FM209186.1), M18 (CP002496.1), NCGM2.S1 (AP012280.1),
PA7 (CP000744.1), UCBPP-PA14 (CP000438.1), PACS2
(NZ_AAQW01000001.1), PAO1 (AE004091.2), and RP73
Ozer BMC Bioinformatics (2018) 19:150
(CP006245.1). Using a core genome definition of sequences
present in at least 11 of the 12 reference genomes, the reference core genome size was 5844 kbp. AGEnt v0.2.1 was
then used to determine the accessory genomic sequences
of these 12 strains as well as of two draft genome assemblies of P. aeruginosa strains, PA99 (JARJ01000000) and
PA103 (JARI01000000). The average total size of the
accessory genomic fraction of a strain was 735 kbp (range
428 kbp - 1177 kbp) with an average of 208 contiguous
accessory elements (range 170 - 435). Output files from
the Spine and AGEnt analyses are available in
Additional file 1. Sequencing read sets for PA99 and
PA103 consisting of 100 bp paired-end Illumina reads
generated by the HiSeq 2000 platform are available
from the NCBI short read archive (SRR5447413 and
SRR5447414). For more detail on the derivation and
characteristics of the core and accessory genomes of
this sequence set, see previous publication on Spine
and AGEnt [29].
Page 6 of 12
Table 1 AGE bin representative characteristics
Strain
# bin
representatives
Total size of bin
representatives,
in bp
Average bin
representative size,
in bp (min - max)
19BR
109
377,039
3459 (216 - 50,833)
213BR
24
129,277
5387 (268 - 54,765)
B136-33
67
224,291
3348 (227 - 15,557)
DK2
56
241,012
4304 (226 - 81,418)
LESB58
58
353,435
6094 (206 - 50,121)
M18
53
170,952
3226 (206 - 31,798)
NCGM2.S1
82
470,335
5736 (270 - 40,043)
PA14
46
245,206
5331 (209 - 127,886)
PA7
270
897,494
3324 (208 - 21,861)
PACS2
49
228,811
4670 (200 - 55,310)
PAO1
17
39,720
2336 (229 - 63,512)
RP73
29
136,895
4721 (227 - 32,463)
PA99
46
279,864
6084 (217 - 10,474)
PA103
46
413,141
8981 (212 - 46,125)
Performance
Total
952
4,207,472
–
ClustAGE was first run on this dataset using the default
settings of a minimum of 85% nucleotide sequence identity across a blast hit, a minimum hit length of 100 bp,
and a minimum bin representative size of 200 bp.
ClustAGE output files are provided in Additional file 2.
A total of 2907 individual sequences were present
among the accessory genomes of the 14 input genomes
ranging in size from 10 bp to 127,886 bp. Among these
elements, 1959 were at least 200 bp in length. After the
BLAST clustering step, 952 bin representative sequences
were identified. As represented by these AGE sequences,
the total unique accessory sequence at least 200 bp in
length among these 14 genomes was 4,207,472 bp with
an average bin length of 4420 bp (Table 1). An average
of 68 AGEs or partial AGEs from each genome served
as bin representative AGEs (range 17 – 270 AGEs) with
an average cumulative bin size of 300,534 bp per strain
(range 39,720 – 897,494 bp). At the conclusion of the
binning step, 99.01% of the total input accessory sequence of all 14 strains was aligned within one of the
952 bin representatives (Additional file 3). Among those
sequences that were not binned, the median length of an
unbinned segment was 41 bp with a range of 1 to
196 bp. This indicates that sequences excluded from
binning were primarily short regions that were unable
to be properly aligned by BLAST and/or unique regions that were smaller than the 200 bp minimum
bin size cutoff.
Alignments against bin representative AGEs were further subdivided at positions where the set of genomes
with elements aligning to the bin representative before
the position differed from the set aligning after the position. In this fashion, the 952 bin representative AGEs
Average
68
300,534
–
were subdivided into 2346 discrete subelements with an
average of 2.5 subelements per AGE (range 1 – 120 subelements per AGE). The average subelement size was
1793 bp (range 1 – 40,966 bp). This demonstrates the
mosaic nature of many P. aeruginosa AGEs with horizontal transfer of sections of AGEs rather than as
discrete islands or interruption of AGEs in the genome
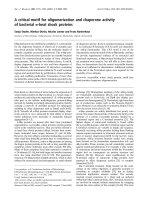
with newly-acquired AGEs. Among the accessory genomes of these 14 strains, the majority of the sequence
was unique with 59.5% of all subelement sequence found
in only one genome (Fig. 3a). Strain PA7 had the largest
share of unique AGE sequence with 29.2% of all unique
subelement sequence (Fig. 3b). It has been previously
shown that PA7 is an outlier strain among P. aeruginosa
species based on comparisons of multi-locus sequence
type (MLST) gene sequences and syntenous regions of
other strains [44]. These results suggest that the
accessory genome composition of PA7 is also dissimilar
compared to other P. aeruginosa strains.
Illumina short sequencing reads were used to extend
AGEs for the two draft genome sequences of PA99 and
PA103. This added 2080 bp of sequence to the
722,954 bp of subelement sequence in the draft genome
sequence of PA99 for an increase of 0.3% and added
5306 bp of sequence to the 944,716 bp of subelement
sequence in the draft genome sequence of PA103 for an
increase of 0.6% (Table 2). In total, sequence derived
from strain PA99 read alignments was added to 45 bins
with an average of 46 bp of sequence added per bin
(range 1 – 350 bp) and sequence derived from PA103
Ozer BMC Bioinformatics (2018) 19:150
Page 7 of 12
a
b
Fig. 3 AGE subelement sequence distribution. a Amount of total subelement sequence, in bp, shared among the number of genomes indicated
along the x-axis. Bars are labeled with the percent of the total subelement sequence among all input strains shared by the given number of
strains. b Amount of total unique subelement sequence, in bp, found in only one of the fourteen genomes by genome ID. Bars are labeled with
the percent of total unique subelement sequence among all input strains found within the indicated strain
read alignments was added to 60 bins with an average of
100 bp of sequence added per bin (range 1 – 1247 bp).
With the additional sequence extension of the AGEs for
strains PA99 and PA103, the 952 AGE bins were divided
into 2382 discrete subelements. Subelement characteristics were similar to non-read-corrected subelements
with an average of 2.5 subelements per AGE bin (range
1 – 122) and an average subelement size of 1766 bp
(range 1 – 40,966 bp). A representation of distribution
Table 2 AGE read correction results per strain
PA99
PA103
Total added accessory genome
sequence (bp)
2080
5306
% increase in total accessory
genome length
0.30%
0.60%
# bins with added sequence
45
60
Average bp added per bin
(min - max)
46 (1 - 350)
100 (1 - 1247)
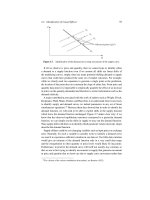
of the total accessory genome of the 14 strains in bins at
least 200 bp in length is shown in Fig. 4.
To examine the effect of modifications to the default
settings of ClustAGE on output, the analysis was
repeated with a more permissive minimum sequence
identity of 80%, as well as a more restrictive minimum
sequence identity of 90%. See Additional file 4 for a table
comparing ClustAGE results at the different cutoffs.
Using a setting of 80% minimum sequence identity,
there were more bin representatives identified comprising less total sequence and more subelement divisions of
the bin representatives compared to when the default
setting of 85% was used. The lower sequence identity
threshold results in more alignments against bin representatives being preserved. This causes more binning of
portions of AGEs within the potential bin representative
pool leaving more unbinnned AGE fragments to serve as
bin representatives. This is reflected in the decreased
average length of the bin representatives compared to the
Ozer BMC Bioinformatics (2018) 19:150
Page 8 of 12
Fig. 4 Pan accessory genome distribution among 14 P. aeruginosa isolates. Outer ring shows ClustAGE bins at least 200 bp in size ordered
clockwise from largest to smallest with alternating orange and green colors to indicate bin borders. Concentric inner rings show distributions of
accessory elements within each strain. Ruler in the center of the figure indicates the cumulative size of the accessory genome bin representatives
in kilobases. Figure generated using ClustAGE Plot utility available at />
results of the 85% cutoff. This also leads to greater
fragmentation of the AGEs into subelements as more potentially nonspecific BLAST alignments escape filtering.
Conversely, the more restrictive 90% sequence identity
cutoff resulted in fewer AGE representatives of longer
average length divided into fewer total subelements. Further comparisons of ClustAGE results after read correction can be seen in the table in Additional file 4.
The ability of ClustAGE to identify mosaicism in AGEs,
i.e. insertions and/or deletions within larger AGE structures, was tested using a set of previously-described related
genomic islands in P. aeruginosa. Sequences of genomic
islands PAPI-1 (Genbank accession AY273869.1), ExoU
island A (accession DQ437742.1), and PAGI-5 (accession
EF611301.1) were downloaded from NCBI GenBank.
These AGEs have been previously identified as related hybrid genomic islands [45]. ClustAGE analysis of these three
AGEs recaptured the previously-described mosaic nature
the genomic islands (Fig. 5). Similar to what has been previously reported, ClustAGE again showed that PAGI-5 is
missing three large genomic regions relative to PAPI-1 as
well as several smaller regions. Moreover, ClustAGE was
also able to identify a region spanning bases 53,059 –
56,162 in PAPI-1 that contains 4 genes with sequence similarity to a region in exoU island A that is not present in
PAGI-5. These results demonstrate that ClustAGE is able
to accurately identify insertions and deletions in AGEs that
are consistent with the mosaic nature of the accessory genome in P. aeruginosa.
ClustAGE gene distribution
ClustAGE differs from gene-based approaches to accessory
genome characterization in that it identifies the distribution
of nucleotide accessory genomic element regions independent of the presence or absence of discrete coding regions
within those elements. To evaluate the performance of ClustAGE in determining the presence or absence of accessory
elements among the included strains, ClustAGE output
was compared with ortholog determinations between coding sequences in the annotated accessory genomes using
reciprocal best BLAST hit (RBB) analysis [46, 47] (Methods
in Additional file 5). Briefly, for each previously-annotated
Ozer BMC Bioinformatics (2018) 19:150
Page 9 of 12
a
b
Fig. 5 Genomic island variability. a Alignment of P. aeruginosa genomic islands PAGI-5, PAPI-1, and ExoU Island A. Dark bands and ORFs represent
conserved nucleotide sequences. Figure reproduced from Battle et al. ( [45] with permission from the American
Society for Microbiology. b Graphical output from ClustAGE analysis of the same three genomic islands. Arrows in the top row correspond to coding
sequences on the forward (orange) and reverse (green) strands of the bin representative PAPI-1. PAPI-1, as the longest of the three genomic island
sequences, is shown in red in the next row. Alignments of PAGI-5 and exoU Island A against PAPI-1 are shown in blue. Percent sequence similarity of the
alignments is represented by shade of blue according to the legend at right
gene in each ClustAGE bin reference sequence, if an
accessory nucleotide sequence for one of the 13 query
genomes was aligned to the region of the bin reference sequence in which the gene was annotated, for the purposes
of comparison that gene was considered present in the
query genome. Conversely, genes in the bin reference not
covered by an alignment were considered absent. These
results were compared to RBB analysis results between
annotated genes in the accessory genome fractions of all 14
included strains. To account for potential differences in annotation approaches between the genomes that could have
resulted in either over-calling or under-calling potential
coding sequences in some genomes, instances where a bin
reference gene was identified as present in a query genome by ClustAGE, but no RBB ortholog was present in
the query genome were confirmed by translated blast analysis (tblastn) of the bin reference protein sequence against
the nucleotide sequence of the accessory genome fraction
of the query genome. Results showed 98.18% concordance
between ClustAGE results and RBB results (Table 3).
These findings indicate that ClustAGE is effective and accurate in identifying the presence or absence of regions
containing gene orthologs. Further discussion of methods
and results can be found in Additional file 5 and the detailed results can be seen in the table in Additional file 6.
Accessory genome similarity
Table 3 ClustAGE annotation vs. gene ortholog analysis
# comparisons
% of comparisons
41,609
98.18%
ClustAGE+ / Ortholog-a
328
0.77%
ClustAGE- / Ortholog+
443
1.05%
Concordant
Comparisons of determinations of gene presence or absence based on
ClustAGE alignments to determination of orthologous genes based on
reciprocal best blast hit (RBB) analysis of annotated genes in the accessory
genomes of each strain. Minimum ClustAGE nucleotide alignment percent
identity = 85%. Minimum RBB percent identity = 85%
a
Genes identified by ClustAGE but not by RBB were counted as present if
tblastn analysis identified the gene in accessory genome sequence with at
least 50% coverage by length and 85% sequence identity
Using the sublement_to_tree.pl utility included with ClustAGE, the similarity of accessory element contents between strains in the dataset was evaluated. Bray-Curtis
distances based on presence of subelements at least
100 bp in length were calculated for each pair of genomes
and used to produce a neighbor-joining tree with 1000
bootstrap replicates (Fig. 6). The relative amount of shared
accessory genome sequence between pairs of strains was
calculated from Bray-Curtis distances and used to generate a heat map of relative accessory genome similarity.
This analysis showed that the accessory genomes of
strains 19BR and 213BR were nearly identical. It also
Ozer BMC Bioinformatics (2018) 19:150
Page 10 of 12
Fig. 6 Relative amount of shared accessory genome content among 14 P. aeruginosa isolates. Bray-Curtis distances (d) were calculated for every
pair-wise comparison of shared AGE content between strains. Neighbor-joining tree (left) is a consensus across 1000 bootstrap resamplings of AGE
distributions. Branches with support < 500 were collapsed. Heatmap (right) shows relative pairwise AGE content similarity (1 - d) between strains
showed that the genome of PA7 shared little accessory
genome with the other genomes studied here, consistent
with its status as a taxonomic outlier strain [44].
Scalability and computational efficiency
As the cost of microbial whole-genome sequencing has decreased and availability of sequencing resources has increased, computational requirements for analyzing the
resulting genomic data sets can become a limiting factor.
Processing time and memory requirements of ClustAGE
analyses were evaluated using AGE data sets from increasing numbers of genomes. The figure in Additional file 7
shows the average analysis time and average maximum
memory requirements for ClustAGE analyses. Five replicate analyses of each number of input genomes were conducted on both a server platform running Ubuntu Linux
as well as a desktop computer running Mac OS X. For
more details, see Additional Methods in Additional file 5.
On both computing platforms the ClustAGE processing
times increased linearly up to 200 genomes, with rsquared values of 0.9906 and 0.9925 on the Linux and OS
X platforms, respectively. The average time required to
analyze 200 accessory genomes was less than 70 min on
both computers. Peak memory use also increased linearly
up to 200 genomes analyzed with a maximum average
RAM use of 1.6 Gb on the Ubuntu Linux server and 1.2
Gb on the Mac OS X desktop computer. It is expected
that processing time and memory use requirements are
likely to vary further depending on average accessory genome size of the analyzed strains. Nonetheless, these results
indicate that ClustAGE analysis is scalable to larger genome data sets and suggest that users without access to
high-memory and/or multiple processor computing resources can still perform ClustAGE analyses on AGEs derived from 10s or 100 s of genomic sequences using
standard desktop or even laptop computers.
Conclusions
ClustAGE, in combination with the core and accessory
genome identification packages Spine and AGEnt [29], is
an easy-to-use and accurate software tool to characterize
the distribution of accessory genomic elements (AGEs)
within a collection of bacterial whole-genome sequences.
It includes utilities for visualizing AGE distributions and
comparing and classifying relative accessory genome
similarity among strains in the studied population. Taken
together, the analysis output provided by ClustAGE can
offer researchers a powerful new tool to study the relationships of discrete strain characteristics with flexible
genome content in large genomic data sets to gain
insight into bacterial evolution and adaptation.
Availability and requirements
Project name: ClustAGE.
Project home page: />clustage and thwestern.
edu/cgi-bin/clustage.cgi.
Operating system(s): Platform independent.
Programming language: Perl.
Other requirements: Perl 5.10 or higher, BLAST+ 2.3.0
or higher. For optional functions, gnuplot 5.0 or higher,
bwa 0.7.13 or higher, and/or phylip 3.695 or higher
are necessary.
License: GNU GPL v3.
Any restrictions to use by non-academics: None.
Additional files
Additional file 1: Archive containing relevant output files from the
Spine and AGEnt analyses of the reference genomes. (ZIP 4849 kb)
Additional file 2: Archive containing output files from ClustAGE analysis of
accessory genome sequence files found in Additional file 1. (ZIP 18100 kb)
Ozer BMC Bioinformatics (2018) 19:150
Page 11 of 12
Additional file 3: Unbinned accessory sequences. (XLSX 52 kb)
8.
Additional file 4: ClustAGE output characteristics. (XLSX 58 kb)
9.
Additional file 5: ClustAGE gene distribution analysis. (DOCX 33 kb)
Additional file 6: Comparison of ClustAGE results with pairwise gene
ortholog analysis. (XLSX 54 kb)
Additional file 7: ClustAGE computational performance. Randomly
selected sets of accessory genomic elements from identified from
Pseudomonas aeruginosa whole genome sequences were analyzed by
ClustAGE. Analyses were performed on a server platform running Ubuntu
(Linux, blue) and on a desktop computer running OS X (Mac, orange).
Time to completion of ClustAGE analysis (solid lines) and maximum
memory usage (dashed lines) were measured for each analysis. Each
point represents the average of 5 replicate analyses at each number of
input genomes. Error bars represent the standard error of the mean.
(PDF 72 kb)
Acknowledgements
Thank you to Larry Kociolek, Nathan Pincus, Maulin Soneji, and Syed Beenish
for software testing and feedback. Thank you to Timothy Lee Turner and
Sudhir Penugonda for manuscript review. Thank you to Alan Hauser for
mentorship, guidance, and manuscript review.
Funding
This work was supported by a Mentored Research Scholar Grant in Applied and
Clinical Research, MRSG-13-220-01 – MPC from the American Cancer Society.
Availability of data and materials
The datasets analyzed during the current study are available in the NCBI
nucleotide and short read repositories, />nuccore and The remainder of the data
generated during this study is included in this published article and its
supplementary information files.
Authors’ contributions
EO conceived of, programmed, and tested the software and prepared the
manuscript. The author read and approved the final manuscript.
Ethics approval and consent to participate
Not applicable.
10.
11.
12.
13.
14.
15.
16.
17.
18.
19.
20.
21.
22.
23.
Competing interests
The authors declare that they have no competing interests.
24.
25.
Publisher’s Note
Springer Nature remains neutral with regard to jurisdictional claims in
published maps and institutional affiliations.
26.
Received: 22 September 2017 Accepted: 11 April 2018
27.
References
1. Lan R, Reeves PR. Intraspecies variation in bacterial genomes: the need for a
species genome concept. Trends Microbiol. 2000;8(9):396–401.
2. van Passel MW, Marri PR, Ochman H. The emergence and fate of
horizontally acquired genes in Escherichia coli. PLoS Comput Biol.
2008;4(4):e1000059.
3. Medini D, Donati C, Tettelin H, Masignani V, Rappuoli R. The microbial
pan-genome. Curr Opin Genet Dev. 2005;15(6):589–94.
4. Kuo CH, Ochman H. The fate of new bacterial genes. FEMS Microbiol Rev.
2009;33(1):38–43.
5. Rocha EP. Evolutionary patterns in prokaryotic genomes. Curr Opin
Microbiol. 2008;11(5):454–60.
6. Kung VL, Ozer EA, Hauser AR. The accessory genome of Pseudomonas
aeruginosa. Microbiol Mol Biol Rev. 2010;74(4):621–41.
7. Hacker J, Blum-Oehler G, Muhldorfer I, Tschape H. Pathogenicity islands of
virulent bacteria: structure, function and impact on microbial evolution.
Mol Microbiol. 1997;23:1089–97.
28.
29.
30.
31.
32.
33.
Burrus V, Waldor MK. Shaping bacterial genomes with integrative and
conjugative elements. Res Microbiol. 2004;155(5):376–86.
Rouli L, Merhej V, Fournier PE, Raoult D. The bacterial pangenome as a
new tool for analysing pathogenic bacteria. New Microbes New Infect.
2015;7:72–85.
Top EM, Springael D. The role of mobile genetic elements in bacterial
adaptation to xenobiotic organic compounds. Curr Opin Biotechnol.
2003;14(3):262–9.
Hacker J, Hochhut B, Middendorf B, Schneider G, Buchrieser C, Gottschalk G,
Dobrindt U. Pathogenomics of mobile genetic elements of toxigenic
bacteria. Int J Med Microbiol. 2004;293(7-8):453–61.
Aguilar-Barajas E, Ramírez-Díaz MI, Riveros-Rosas H, Cervantes C. Heavy
metal resistance in pseudomonads. In: Ramos JL, Filloux A, editors.
Pseudomonas: volume 6: molecular microbiology, infection and biodiversity,
vol. 6. New York: Springer; 2010. p. 255–82.
Campos-García J: Metabolism of acyclic terpenes by Pseudomonas. In:
Pseudomonas: volume 6: molecular microbiology, infection and biodiversity.
Ramos JL, Filloux A, vol. 6. New York: Springer; 2010: 235-254.
Novick RP, Christie GE, Penades JR. The phage-related chromosomal islands
of gram-positive bacteria. Nat Rev Microbiol. 2010;8(8):541–51.
Gomez-Simmonds A, Uhlemann AC. Clinical implications of genomic
adaptation and evolution of Carbapenem-resistant Klebsiella pneumoniae.
J Infect Dis. 2017;215(suppl_1):S18–27.
Ramirez MS, Traglia GM, Lin DL, Tran T, Tolmasky ME. Plasmid-mediated
antibiotic resistance and virulence in gram-negatives: the Klebsiella
pneumoniae paradigm. Microbiol Spectr. 2014;2(5):1–15.
Ho Sui SJ, Fedynak A, Hsiao WW, Langille MG, Brinkman FS. The association
of virulence factors with genomic islands. PLoS One. 2009;4(12):e8094.
Hacker J, Kaper JB. Pathogenicity islands and the evolution of microbes.
Annu Rev Microbiol. 2000;54:641–79.
Janka A, Becker G, Sonntag AK, Bielaszewska M, Dobrindt U, Karch H.
Presence and characterization of a mosaic genomic island which
distinguishes sorbitol-fermenting enterohemorrhagic Escherichia coli
O157:H- from E. coli O157:H7. Appl Environ Microbiol. 2005;71(8):4875–8.
Bruckner R, Nuhn M, Reichmann P, Weber B, Hakenbeck R. Mosaic genes
and mosaic chromosomes-genomic variation in Streptococcus pneumoniae.
Int J Med Microbiol. 2004;294(2-3):157–68.
Kulasekara BR, Kulasekara HD, Wolfgang MC, Stevens L, Frank DW, Lory S.
Acquisition and evolution of the exoU locus in Pseudomonas aeruginosa.
J Bacteriol. 2006;188(11):4037–50.
Hohl M, Kurtz S, Ohlebusch E. Efficient multiple genome alignment.
Bioinformatics. 2002;18(Suppl 1):S312–20.
Darling AE, Mau B, Perna NT. ProgressiveMauve: multiple genome alignment
with gene gain, loss and rearrangement. PLoS One. 2010;5(6):e11147.
Angiuoli SV, Salzberg SL. Mugsy: fast multiple alignment of closely related
whole genomes. Bioinformatics. 2011;27(3):334–42.
Page AJ, Cummins CA, Hunt M, Wong VK, Reuter S, Holden MT, Fookes M,
Falush D, Keane JA, Parkhill J. Roary: rapid large-scale prokaryote pan
genome analysis. Bioinformatics. 2015;31(22):3691–3.
Treangen TJ, Ondov BD, Koren S, Phillippy AM. The harvest suite for rapid
core-genome alignment and visualization of thousands of intraspecific
microbial genomes. Genome Biol. 2014;15(11):524.
Laing C, Buchanan C, Taboada EN, Zhang Y, Kropinski A, Villegas A,
Thomas JE, Gannon VP. Pan-genome sequence analysis using Panseq: an
online tool for the rapid analysis of core and accessory genomic regions.
BMC Bioinformatics. 2010;11:461.
Chaudhari NM, Gupta VK, Dutta C. BPGA- an ultra-fast pan-genome analysis
pipeline. Sci Rep. 2016;6:24373.
Ozer EA, Allen JP, Hauser AR. Characterization of the core and accessory
genomes of Pseudomonas aeruginosa using bioinformatic tools spine and
AGEnt. BMC Genomics. 2014;15:737.
Lanza VF, Baquero F, de la Cruz F, Coque TM. AcCNET (accessory
genome constellation network): comparative genomics software for
accessory genome analysis using bipartite networks. Bioinformatics.
2017;33(2):283–5.
Uchiyama I. Hierarchical clustering algorithm for comprehensive orthologousdomain classification in multiple genomes. Nucleic Acids Res. 2006;34(2):647–58.
Yang Q, Sze SH. Large-scale analysis of gene clustering in bacteria. Genome
Res. 2008;18(6):949–56.
Fouts DE, Brinkac L, Beck E, Inman J, Sutton G. PanOCT: automated clustering
of orthologs using conserved gene neighborhood for pan-genomic
Ozer BMC Bioinformatics (2018) 19:150
34.
35.
36.
37.
38.
39.
40.
41.
42.
43.
44.
45.
46.
47.
analysis of bacterial strains and closely related species. Nucleic Acids Res.
2012;40(22):e172.
Kriventseva EV, Tegenfeldt F, Petty TJ, Waterhouse RM, Simao FA,
Pozdnyakov IA, Ioannidis P, Zdobnov EM. OrthoDB v8: update of the
hierarchical catalog of orthologs and the underlying free software. Nucleic
Acids Res. 2015;43(Database issue):D250–6.
Altschul SF, Gish W, Miller W, Myers EW, Lipman DJ. Basic local alignment
search tool. J Mol Biol. 1990;215(3):403–10.
Altschul SF, Madden TL, Schaffer AA, Zhang J, Zhang Z, Miller W, Lipman DJ.
Gapped BLAST and PSI-BLAST: a new generation of protein database search
programs. Nucleic Acids Res. 1997;25(17):3389–402.
Li H, Durbin R. Fast and accurate short read alignment with burrows-wheeler
transform. Bioinformatics. 2009;25(14):1754–60.
Bellanger X, Payot S, Leblond-Bourget N, Guedon G. Conjugative and
mobilizable genomic islands in bacteria: evolution and diversity. FEMS
Microbiol Rev. 2014;38(4):720–60.
Schmidt H, Hensel M. Pathogenicity islands in bacterial pathogenesis.
Clin Microbiol Rev. 2004;17(1):14–56.
Shapiro BJ, Friedman J, Cordero OX, Preheim SP, Timberlake SC, Szabo G,
Polz MF, Alm EJ. Population genomics of early events in the ecological
differentiation of bacteria. Science. 2012;336(6077):48–51.
Felsenstein, J. PHYLIP - Phylogeny Inference Package (Version 3.2). Cladistics
5. 1989. p. 164–166
Letunic I, Bork P. Interactive tree of life (iTOL) v3: an online tool for the
display and annotation of phylogenetic and other trees. Nucleic Acids Res.
2016;44(W1):W242–5.
Stothard P, Wishart DS. Circular genome visualization and exploration using
CGView. Bioinformatics. 2005;21(4):537–9.
Roy PH, Tetu SG, Larouche A, Elbourne L, Tremblay S, Ren Q, Dodson R,
Harkins D, Shay R, Watkins K, Mahamoud Y, Paulsen IT. Complete genome
sequence of the multiresistant taxonomic outlier Pseudomonas aeruginosa
PA7. PLoS One. 2010;5(1):e8842.
Battle SE, Meyer F, Rello J, Kung VL, Hauser AR. Hybrid pathogenicity island
PAGI-5 contributes to the highly virulent phenotype of a Pseudomonas
aeruginosa isolate in mammals. J Bacteriol. 2008;190(21):7130–40.
Tatusov RL, Koonin EV, Lipman DJ. A genomic perspective on protein
families. Science. 1997;278(5338):631–7.
Bork P, Dandekar T, Diaz-Lazcoz Y, Eisenhaber F, Huynen M, Yuan Y.
Predicting function: from genes to genomes and back. J Mol Biol.
1998;283(4):707–25.
Page 12 of 12