An optimized approach for annotation of large eukaryotic genomic sequences using genetic algorithm
Bạn đang xem bản rút gọn của tài liệu. Xem và tải ngay bản đầy đủ của tài liệu tại đây (1.23 MB, 13 trang )
Chowdhury et al. BMC Bioinformatics (2017) 18:460
DOI 10.1186/s12859-017-1874-7
METHODOLOGY ARTICLE
Open Access
An optimized approach for annotation of
large eukaryotic genomic sequences using
genetic algorithm
Biswanath Chowdhury1*, Arnav Garai2 and Gautam Garai3
Abstract
Background: Detection of important functional and/or structural elements and identification of their positions in a
large eukaryotic genomic sequence are an active research area. Gene is an important functional and structural unit
of DNA. The computation of gene prediction is, therefore, very essential for detailed genome annotation.
Results: In this paper, we propose a new gene prediction technique based on Genetic Algorithm (GA) to determine
the optimal positions of exons of a gene in a chromosome or genome. The correct identification of the coding and
non-coding regions is difficult and computationally demanding. The proposed genetic-based method, named Gene
Prediction with Genetic Algorithm (GPGA), reduces this problem by searching only one exon at a time instead of all
exons along with its introns. This representation carries a significant advantage in that it breaks the entire gene-finding
problem into a number of smaller sub-problems, thereby reducing the computational complexity. We tested the
performance of the GPGA with existing benchmark datasets and compared the results with well-known and relevant
techniques. The comparison shows the better or comparable performance of the proposed method. We also used
GPGA for annotating the human chromosome 21 (HS21) using cross-species comparisons with the mouse orthologs.
Conclusion: It was noted that the GPGA predicted true genes with better accuracy than other well-known approaches.
Keywords: Genetic algorithm, Bioinformatics, Coding region, Exon prediction, Gene identification
Background
Biological sequences are primarily useful computational
data in molecular biology. Sequences represent symbolic
descriptions of the biological macromolecules like DNA,
RNA, and Proteins. A sequence provides a vital insight into
the biological, functional, and/or structural data of a molecule. Therefore, the molecular information can be easily
deciphered by analyzing several biological sequences. The
past decade has seen a major boost in sequencing, especially after the advent of next-generation sequencing (NGS)
technologies [1] leading to an enormous amount of nucleotide sequence data. Hence, the amount of raw, unannotated
nucleotide sequence data in the databases is expanding
exponentially. Therefore, the use of computational
approaches to understand the functional and structural significance of these data has become vital in comparative
* Correspondence:
1
Department of Biophysics, Molecular Biology and Bioinformatics, University
of Calcutta, Kolkata 700009, WB, India
Full list of author information is available at the end of the article
genomics. Gene is the most important functional and structural unit of DNA. Hence, the computation of gene prediction is an essential part of the detailed genome annotation.
In an organism, DNA works as a medium to transfer
information from one generation to another. A gene is a
distinct stretch of DNA. It determines amino acid
residues of a protein or polypeptide that is responsible
for one or more biological functions of an organism. A
gene undergoes transcription and translation process
along with splicing to form a functional molecule or
protein. Three consecutive nucleotides or a codon of a
gene represents a single amino acid of a protein. A
complete gene length is, therefore, always the multiplier
of three. The prokaryotic gene structure consists of a
long stretch of coding region and any intermediate noncoding region is absent. On the other hand, the
eukaryotic gene structure is more complex. It breaks
into several coding regions or exons that are separated
by long stretches of non-coding regions i.e. introns.
Introns are spliced out from the transcribed RNA.
© The Author(s). 2017 Open Access This article is distributed under the terms of the Creative Commons Attribution 4.0
International License ( which permits unrestricted use, distribution, and
reproduction in any medium, provided you give appropriate credit to the original author(s) and the source, provide a link to
the Creative Commons license, and indicate if changes were made. The Creative Commons Public Domain Dedication waiver
( applies to the data made available in this article, unless otherwise stated.
Chowdhury et al. BMC Bioinformatics (2017) 18:460
Furthermore, the coding region comprises only 2 – 3%
of the entire genomic sequence that adds a second level
of complexity in eukaryotes. As a consequence, the gene
prediction in a eukaryotic genome is more challenging.
Computational gene finders are able to predict genes
precisely for sequences with a single gene, but for
sequences with multiple genes, the accuracy gets lowered
with the increase of sequence complexity thereby resulting
in false predictions. The ab-initio based method predicts
the genes directly from the genomic sequences relying on
two significant features: gene signals and gene content.
Several well-known ab-intio programs available for gene
prediction are GENSCAN [2], Genie [3], FGENESH [4],
GeneId [5], GeneParser [6], GRAIL II [7], HMMgene [8],
GeneMark.hmm [9], MZEF [10], AUGUSTUS [11],
Morgan [12], EUI, EUI-FRAME, GI [13], and others.
Among them, Genie combines information that integrates
matches to homologous sequences from a protein database. However, the ab-intio based approaches normally
predict a higher rate of false positive results while annotating large multi-gene genomic sequences [14]. In particular,
ab-initio gene identifiers determine the intergenic splice
sites poorly in the prediction process. Conversely, a
homology-based method identifies genes by searching
homologs on the databases of already established and
experimentally verified coding sequences. A homology
search exploits sequence alignment between genomic data
and known database sequences. Currently, a large number
of known protein-coding genes, cDNA, proteins, and
ESTs are available in the databases. Therefore, sequence
similarity based gene prediction methods are becoming
useful in finding the putative genes in genomic sequences
and understanding the evolutionary relationship between
raw genomic data and known cDNA, proteins, or genes.
A number of successful homology-based tools are FGENESH+ and FGENESH++ [4], SGP-1 [15], GenomeScan
[16], GeneWise [17, 18], Procrustes [19, 20], CRASA [21],
GAIA [22], SIM4 [23], Spidey [24], and others. Among
them, GenomeScan, GeneWise, Procrustes, FGENESH+
(and FGENESH++), are combined tools that use the ab-initio information of a gene structure along with homology
search.
Researches are still being carried out and many different techniques are getting developed to solve gene prediction problem by reducing false predictions. Acencio
and Lemke [25] introduced a decision tree-based classifier
and trained that with different attributes like network
topological features, cellular compartments, and biological
processes for finding essential genes in S. cerevisiae.
EVidenceModeler (EVM) [26] and SCGPred [27] tools
were developed as an automated eukaryotic gene structure
annonator that computes weighted consensus gene
structure based on multiple sources of available evidence.
Genome Annotation based on Species Similarity (GASS)
Page 2 of 13
[28] was developed based on the shortest path model and
DP to annotate a eukaryotic genome by aligning the exon
sequences of the annotated similar species.
Numerical and signal representations of DNA are two
other approaches where residues were converted into
numerical values and ratios of signal respectively. Akhtar et
al. [29] had performed symbolic-to-numeric representations
of DNA and compared it with other existing techniques.
Abbasi et al. [30] showed a significant improvement in accuracy of exonic region identification using a signalprocessing algorithm that was based on Discrete Wavelet
Transform (DWT) and cross-correlation method. Saberkari
et al. [31] predicted the locations of exons in DNA strand
using a Variable Length Window approach. A Digital Signal
Processing (DSP) based method was used by Inbamalar
and Sivakumar [32] to detect the protein-coding regions by
converting DNA sequences into numeric sequences using
Electron Ion Interaction Potential (EIIP). Another tool, Signalign [33] was used to convert DNA sequences into series
of signal for comparative gene structure analysis.
Evolutionary algorithms like GA based techniques
have also been used in solving the gene prediction problem [34, 35]. Hwang et al. [36] proposed a GA based
method that maximized the partial Area Under the
Curve (AUC) to predict essential genes of S. cerevisiae
using selected features amongst 31 features. Cheng et al.
[37] developed a novel machine learning based approach
called feature-based weighted Naive Bayes model
(FWM) that was based on Naïve Bayes classifiers,
logistic regression, and genetic algorithm.
Gene identification based on expressed RNA is another
growing field of research where the gene annotation is
done by analyzing short RNA-seq reads derived from
mRNA and mapping them to the reference genome. To
get precise analysis, the sequence reads must evenly cover
each transcript along its both ends. Many short read
aligners are developed in the last few years like Bowtie2
[38], BWA-SW [39], and GSnap [40].
In this paper, we propose a GA based optimized gene
prediction method named as Gene Prediction with Genetic
Algorithm (GPGA). It is a homology-based method that
used in the mapping of large, unknown eukaryotic
genomic sequences with the exons of known genes. The
advantage of this approach is that it can be utilized in the
mapping of a large genomic sequence with the help of
genes present in several well-known repositories like
Ensembl [41], UCSC [42] browser and others.
Results and discussion
In the experiment, we statistically evaluated the sensitivity
and specificity of GPGA at exon level on two benchmark
datasets and also compared the results with other
well-known and relevant techniques. Furthermore, we
Chowdhury et al. BMC Bioinformatics (2017) 18:460
annotated human chromosome 21 with GPGA for a
large-scale evaluation.
The proposed algorithm has been written in C and
implemented on an IBM Power 6 system with 8 GB
RAM per core.
Test datasets
The performance of the GPGA method was validated on
two benchmark datasets, namely, HMR195 [43], and
SAG [44]. These are datasets from two different
categories that possess well-annotated genomic sequences. The datasets were taken from the GeneBench
suite [45]. A brief description of these test datasets is
provided below.
The HMR195 dataset comprises 195 real genomic sequences of H. sapiens, M.musculus, and R. norvegicus in
the sequence ratio of 103:82:10. Each sequence contains
exactly one gene. The mean length of total sequences is
7096 bp. The total number of single-exon genes and
multi-exon genes are 43, and 152, respectively. The total
number of exons in the dataset is 948. Utilization of this
dataset is shown in a wide array of researches [29, 46, 47].
SAG dataset is the second one tested in the experiment. It consists of a semi-artificial set of genomic
sequences with 42 simulated intergenic sequences. The
dataset was developed by arbitrarily embedding a typical
set of 178 annotated real human genomic sequences
(h178) in those 42 sequences. Each of h178 sequences
codes for a single complete gene. The SAG sequences
have an average length of 177,160 bp with 4.1 genes per
sequence. The dataset contains total 900 exons.
Data preprocessing (selection of homolog sets)
For experimental analysis, we compared the positions of
exons found by the GPGA in the genomic sequence of a
test dataset (HMR195 or SAG) with the actual positions
mentioned in the corresponding annotation file provided
with the datasets. For such experiment, we generated a
customized dataset of homologous genes of both
HMR195 and SAG. The execution of GPGA was not
performed directly with the extracted exons from the
genomic sequences of test datasets based on the positions mentioned in the annotation files since position
comparison by this technique would have reduced the
real genomic level complexity. We also did not consider
RNA-seq reads in our experiment as the sequence reads
are much shorter than biological transcripts and rarely
span across several splice junctions [48].
Three different species, namely, human, mouse, and
rat were chosen for the preparation of customized
homolog dataset in consideration of their phylogenetic
proximity. The test datasets also contained genomic sequences drawn from these three species. To construct
the customized dataset, we used Blast Like Alignment
Page 3 of 13
Tool (BLAT) [49] of UCSC genome browser using the
default nucleotide alignment parameters. At first, all 195
and 178 genes were extracted from the genomic
sequences present in the HMR and SAG datasets
respectively. This was based on the positions of exons
mentioned in their respective annotation files. We then
searched for homologs (using BLAT) of each of the
extracted genes against human, mouse, and rat genome
separately using their latest assemblies (Human: hg38;
mouse: mm10; and rat: rn6). From the BLAT search, we
selected three highest scored homologs, each one being
from each of the three considered genome assemblies.
Thus, for a query gene, we got three homologs of three
different species. Though we had always considered the
top homologs, some of them were of poor quality in
terms of similarity. Moreover, some of the homologs did
not contain precise exon boundary and/or the equal
number of exons of the given query presumably because
the BLAT consulted newer assembled genomes compared to the genomic sequences of benchmark datasets.
Despite this, all these sequences were included in the
homolog sets to increase the noise in the gene data. This
was done with a view to test the efficiency of the GPGA
method. Multiple occurrences of same homologous
sequence for different queries was eliminated from the
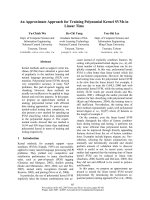
sets to reduce redundancy. Finally, we combined the two
homolog sets (one for HMR dataset and other for SAG)
to generate a single customized dataset. The process
flow for generating the customized dataset is shown
diagrammatically in Fig. 1.
GPGA selected one exon at a time from the customized dataset and searched for its presence in both HMR
and SAG datasets.
Performance assessment
To analyze the performance, the exon positions as predicted by GPGA were compared with the actual exon
positions present in the corresponding annotation file of
HMR and SAG. The exon with higher alignment score
is usually more accurate than the exon with low score
[13]. However, in our calculation of matched results, a
lower cutoff threshold was used to identify a true homolog. A minimum of 60% similarity observed between the
test sequence of HMR and SAG and a sequence from
the customized dataset was used as the cutoff threshold.
Sometimes, it was noticed that a number of exons of a
gene from the customized dataset could not individually
satisfy the cutoff value. Despite this, the gene was still
considered by GPGA if the combined similarity score of
all exons reached to 60%. We carried out statistical
analysis of experimental results to determine the
performance accuracy of GPGA (see Methods for
details). The results were also compared with other wellknown and relevant annotation tools.
Chowdhury et al. BMC Bioinformatics (2017) 18:460
Fig. 1 The flowchart representing the process of customized
dataset construction
For each test dataset, we measured ESn (sensitivity
at the exon level), ME (missed exon), ESp (specificity
at the exon level), and WE (wrong exon). This was
done separately with human, mouse, and rat homologs from the customized dataset. The average value
of ESn and ESp for each test dataset was considered
for the final measurement (see Additional file 1:
Statistical analysis and Table S1). Due to the presence
Page 4 of 13
of homologs of both the test datasets, sometimes, a
number of genes from the customized dataset were
not aligned with a test sequence by satisfying the cutoff similarity. In that case, the predictions based on
those genes were not included in the statistical measurement of GPGA for that particular test sequence.
However, we did not exclude any test genomic
sequence from the measurement since the customized
dataset contained at least one homolog (similarity
≥60%) that corresponds to that test sequence as
described in data preprocessing. Figures 2 and 3
(Additional file 1: Tables S3 and S4) show the comparison of the GPGA results with other well-known
gene prediction tools on HMR and SAG datasets, respectively. The description of each tool considered in
this study was provided in Additional file 1: Table S2.
In practice, it is generally difficult to compare the
performance of the proposed tool with that of other gene
prediction tools because most of them and their inbuilt
databases are inaccessible [50]. Also, there is no facility
available to incorporate any user-defined dataset.
Therefore, for performance evaluation, the results of the
tools were obtained from the data presented in the articles
[13, 21, 43, 44, 50]. However, the selected ab-initio tools
for both test datasets are trained and tested with
genes of same species considered in the respective
dataset. The performance of the similarity-based tools
was also evaluated based on the inbuilt reference
database from same or a closely related species having almost similar sequences to the test sequences.
The selection of only strong homologs (above 90%
similarity at the nucleotide level) yielded good accuracy for homology-based tools, whereas, selection of
moderate homologs (below 70% similarity) worsened the
accuracy [43, 44]. Therefore, for comparison with GPGA,
we selected their best results obtained from strong
homologs.
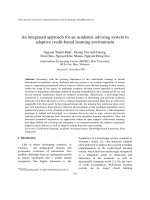
From Figs. 2 and 3, it was noticed that GPGA outperformed the other annotation tools in terms of ESn, ESp,
and Eavg. For both the test datasets, GPGA maintained
the accuracy of more than 90% for each of the three
parameters. For HMR dataset, the values of ESn, ESp, and
Eavg of GPGA were 0.95, 0.94, and 0.95, respectively. For
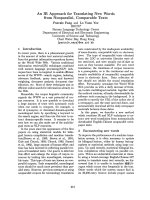
SAG dataset, it was observed that GPGA performed similarly to GeneWise. However, the overall consistency of
GPGA (Eavg = 0.915) was higher than GeneWise
(Eavg = 0.89). Most of the tools were good at identifying
coding nucleotides to the level of 80% or even more than
90% sensitivity and specificity (data not shown) [43, 44].
However, discovering exact exon boundary was very weak
(except GeneWise) when it comes to predicting a
complete gene. The exon level accuracy of GeneWise was
also declined with homologs having less than 70%
sequence similarity [44]. GPGA, on the other hand, was
Chowdhury et al. BMC Bioinformatics (2017) 18:460
Page 5 of 13
1
0.9
Exon level accuracy
0.8
0.7
0.6
0.5
0.4
0.3
0.2
0.1
0
ESn
ESp
Eavg
Fig. 2 The exon level accuracy comparison of GPGA with other gene prediction tools on HMR dataset
able to predict exon boundaries better than others tools
even at low similarity cutoff score of 60% only. Since, all
the exons are present only in the forward or plus
strand the same was considered by the existing tools.
However, to test the performance of GPGA, we
considered both plus (Watson) and minus (Crick)
strands of the test sequences.
ME (the proportion of missing exons and actual
exons) and WE (the proportion of predicted wrong
exons and actual predicted exons) were also included in
the evaluation process for finding the accuracy of the
tools. Here, GPGA also performed better than others.
The results are presented in Additional file 2: Table S5
and S6. Sometimes, small exons were also missed by
GPGA because of the presence of other alternative
regions in the genomic sequence.
Annotation of human chromosome 21
We also performed annotation of human chromosome
21 (HS21) to observe the performance of GPGA at the
chromosome level. We selected HS21, as it is the
smallest human autosome that wraps around 1-1.5% of
the human genome and its structure and gene content
have also been intensively studied. Therefore, it is considered as an excellent dataset to validate any gene prediction method. For cross-species comparison of HS21,
we selected the phylogenetically related species, mouse.
HS21 shows conserved syntenies to mouse chromosomes
1
0.9
Exon level accuracy
0.8
0.7
0.6
0.5
0.4
0.3
0.2
0.1
0
Sn
GENSCAN
FGENESH
Sp
HMMGene
Procrustes
Eavg
CRASA
Fig. 3 The exon level accuracy comparison of GPGA with other gene prediction tools on SAG dataset
GeneWise
GPGA
Chowdhury et al. BMC Bioinformatics (2017) 18:460
Page 6 of 13
10, 16, and 17 (MM-10, MM16, and MM17) [51]. Hence,
we selected sequences from MM10, MM16, and MM17.
Data pre-processing (selection of target and reference
sequences)
The main objective was to map the target sequence i.e.
HS21-specific genes with their reference mouse orthologs. The entire HS21 sequence of ~47 MB (GRCh38.p4)
along with its seven alternate loci (ALT_REF_LOCI_1)
was obtained from the NCBI [52]. We analyzed nonrepetitive parts of the HS21 sequence by aligning with
well-annotated mouse CoDing Sequences (CDSs) of
MM10, MM16, and MM17. The reference coding
sequences were obtained from the Gencode assembly
using UCSC browser [42]. GENCODE Comprehensive
set is richer in alternative splicing, novel CDSs, novel
exons and has higher genomic coverage than RefSeq
while the GENCODE Basic set is very similar to RefSeq.
Thus, we selected comprehensive Gencode VM4 published in Aug 2014.
Due to limited computing resources, we divided the
entire target sequence (HS21) into multiple (total 26
numbers) divisions. Each of them consists of 16-lakh bp
of HS21 except the last one. Each of these smaller
divisions was run against total comprehensive sets of
MM10, MM16, and MM17.
Results of annotation
We analyzed the results by defining different stringencies
of the conserved sequences and accordingly categorized
the sequences into 50, 100, and 150 bp sequence lengths.
a
For each sequence length, we considered four types of
percentage similarity, namely, 60, 70, 80, and 90. For each
category of length along with its similarity, we found a
large number of conserved blocks. A gene is considered to
be conserved between human and mouse if all the exons
of that gene satisfy the threshold criterion. For example,
for a threshold criteria of 100 bp with 60% similarity, a
gene with 100 bp is considered as conserved if the
observed similarity is ≥60% for all mouse exons. For certain instances, it was also observed that only a few number
of exons of a mouse gene individually satisfy the matching
threshold criterion. We did not consider them as
conserved genes but separately as conserved blocks. It is
not confirmed whether these blocks are genes of HS21 or
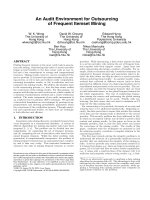
not. Figure 4a and b showed, respectively, the ungapped
conserved blocks distribution and the total number of
genes for different sequence lengths and similarity
categories. Figure 4a supports the presence of a large
number of blocks that are presumably non-genic
conserved functional, regulatory, and/or structural sequences. From the figures, it was observed that for three
different categories, the predicted number of conserved
blocks (Fig. 4a) and genes (Fig. 4b) were decreased with
the increase of the sequence length or percentage of identity. It was also noted that for a lower bp (50 bp) or low
similarity value (60%) a large number of exons of the predicted genes did not follow GT-AG splicing rule. This, in
turn, increased the number of false predictions. On the
other hand, for a higher bp (150 bp) or high similarity
value (80% or 90%), the predicted number of blocks and
genes were decreased rapidly. This eventually increased
b
Predicted Conserved Sequences
Predicted genes
9000
8000
4000
50bp
3500
100bp
3000
150bp
2500
2000
1500
Number of genes
Number of conserved blocks
4500
7000
50bp
6000
100bp
5000
150bp
4000
3000
1000
2000
500
1000
0
60
70
80
Identity (%)
90
0
60
70
80
90
Identity (%)
Fig. 4 Results of Conservation identified by GPGA based on different threshold criteria; (a) Number of ungapped conserved blocks;
(b) Number of genes
Chowdhury et al. BMC Bioinformatics (2017) 18:460
Page 7 of 13
the number of missed genes (details are provided in
Additional file 3: Table S7). Therefore, out of all different
length and similarity categories, we had finally chosen the
moderate level of stringency of 100 bp with 70% identity
(represented as 100-70) to increase the chance of true prediction. The importance of choosing 100-70 criterion for
the identification of important elements between human
and mouse was already shown in ref. [53]. The stringency
of 100-70, (Table 1) yielded 2136 conserved blocks and
361 homologous genes for HS21. These 361 genes
contained a total of 3150 exons out of which, 2185
exons contained canonical ‘GT-AG’ splicing junctions
while the rest 604 contained non-canonical ‘GT-AG’
junctions. It was also observed that out of the 361
genes, 63 genes were overlapping genes (where both
ends were not mapped by the mouse orthologs) and
149 were partial genes (having only one end
matched). The calculated GC content was 51.68%,
which defines the presence of GC-rich genes.
Considering pseudogene based on retroposon and
gene with premature stop codon we found 41 genes.
The distribution of blocks and genes along the length
of HS 21 is shown in Fig. 5 (see Additional file 3:
Table S10). From Fig. 5, it was noted that the regions
of conserved blocks and the locations of genes were
close to each other and they were distributed more at
the distal part (gene-rich region) of HS21.
For 100-70 level, we also provided the base substitution
data in Additional file 3: Tables S8, S9, and Figure. S1) that
showed the higher rate of transition (substitution between two purines and between two pyrimidines) than
transversion (substitution between one purine and
one pyrimidine) and the higher rate of substitution at
third codon position (Wobble position) than that of
first and second.
Table 1 Results of GPGA for Human Chromosome 21
Stringency at 100 bp length with 70% similarity
HS21
1. Total number of conserve blocks
2136
2. Total number of genes (including partial, overlapping,
and retroposon)
361
2.1. Total number of exons in all genes
3150
2.2. Number of GT-AG junctions
2185
2.3. Number of non GT-AG junctions
604
2.4. Total number of residues comprising all the genes
412,168
2.5. Total number of partial genes that have 5′ end matched
77
2.6. Total number of partial genes that have 3′ end matched
72
2.7. Total number of overlapping genes
63
2.8. Total number of retroposon (may include partial
or overlap genes)
41
2.9. GC percentage
51.68
To compare the GPGA with others, we considered
only those genes that have either unique start or end
positions. We excluded alternate transcripts having
the same start and end positions. Out of the 361
genes predicted by GPGA for HS21, we found 283
genes share unique start and/or end positions. Table 2
contains the comparative results of GPGA along with
other gene prediction tools. From the table, it was noticed
that the GPGA predicted more genes than other gene
prediction tools except GENSCAN which predicts many
wrong exons.
The results proved the performance superiority of
GPGA compared to other well-known ab-initio or
homology-based approaches.
Conclusion
GPGA is an integer based evolutionary process which
simplifies the gene prediction technique. The GPGA
was tested on two well-known benchmark datasets
HMR195 and SAG to evaluate the performance in
terms of sensitivity and specificity at the exon level.
One of the datasets HMR195 consists of real genomic
sequences and the other one SAG contains a semiartificial set of genomic sequences. Such choice of
datasets helps to measure the performance of an
approach in a noisy environment. A major shortfall of
existing homology-based methods is that the prediction accuracy may drop significantly for homologs
having moderate similarity with test sequence.
However, the proposed approach used in GPGA overcomes this drawback. For a moderate similarity like
60%, it was noticed that the true prediction of GPGA
was better than other well-known approaches and the
accuracy is more than 90%.
The limitation of GPGA is that it often fails to predict
the correct position of a short length exon since the
same sequence is frequently repeated in a large genomic
sequence. Another shortfall of GPGA is that it performs
well on an unannotated raw sequence, only when there
is a good coverage of annotated information of orthologous genes. However, obtaining definite accuracy is an
impossible task, because the performance of the
program is very sensitive to the chosen dataset they
are tested on.
In future work, we want to introduce the information
of content sensors and signal sensors like GC-content
value, TATA box, promoters and other compositional
parameters along with the sequence homology to
improve the performance of GPGA on an even more
challenging dataset. We also wish to perform parallel
computing for large-scale annotation without splitting the
query length. In addition, we would like to observe the
performance of the GPGA after introducing gaps in it.
Chowdhury et al. BMC Bioinformatics (2017) 18:460
Page 8 of 13
Number of genes
Number of conserved blocks
300
250
Frequency
200
150
100
50
0
Size in mb
Fig. 5 Distribution of conserved blocks and genes all along the human chromosome 21
Methods
Genetic algorithm
GA is one of the most commonly used evolutionary techniques for optimization. It is based on the principle of
genetics and natural selection. It is an iterative method
that initially starts with a set of probable solutions of a defined problem. In GA, each solution is represented by a
chromosome. A set of chromosomes (also called individuals) forms a population. Each chromosome is associated
with a fitness score that defines the solution quality of the
problem under study. After every iteration (generation),
the fittest individuals are carried on to the next generation, and this process continues until a termination criterion is satisfied. The three genetic operators: selection,
crossover, and mutation help to modify a population in
each generation. The conventional GA normally represents
a chromosome by a binary string. Binary representation,
however, can be problematic for solving some problems as
it is sometimes difficult to encode a real problem with
binary window. Another problem in binary coding is the
increased length of the string for representing a large and
complex optimization problem, which increases the computational complexity and the memory space. So, depending on the problem, other types of representation of GA
apart from binary representation is necessary.
One of the most used GAs is the Real coded GA
(RGA), whose significance is justified in several theoretical studies [54, 55]. In RGA, chromosomes are represented by the real numbers instead of binary numbers.
Moreover, the researchers have suggested several modifications to the GA operators other than conventional one
point crossover, two point crossover, bitwise flip mutation [54]. A number of such modified crossover and
mutation operations have been applied in ref. [55–59] to
improve the GA process for a defined problem.
Here, we have modified the conventional GA with the
integer coding. The changes in crossover and mutation
have also been performed for solving the problem
efficiently. Such modification improves the performance
of the proposed GPGA.
Gene prediction with genetic algorithm
The objective of the proposed method (GPGA) is to map
an unknown large genomic sequence with well-annotated
known genes to determine any homologous relationship
between the known and unknown sequence. CDSs are the
important parts of eukaryotic genes and are structurally
more conserved in homologous sequences. CDSs are the
translated portion of a eukaryotic gene and thus consist of
only exons. However, to find the small and discrete
Table 2 Comparative results are showing the different annotation tools along with matching genes with GPGA prediction
Gene prediction tools
Total genes
Total genes crossed 100-70
threshold level
Total genes with either unique
start/end position
Number of genes matched
with GPGA prediction
CCDS
339
287
238
149
AUGUSTUS
248
181
126
82
GeneID
271
122
122
85
GENSCAN
420
77
77
43
SGP Genes
271
203
203
123
GPGA Genes
361
361
283
.
Chowdhury et al. BMC Bioinformatics (2017) 18:460
Page 9 of 13
portions of CDS in a large genomic sequence is an exhaustive search procedure and requires a significant
amount of computational time and memory space. We
have incorporated an integer based GA (IGA) approach in
GPGA to overcome such problems.
Gene representation by GPGA
In the proposed method, the individuals of the GA
population are represented by integer values. These
values signify different possible positions of an exon in a
large unknown genomic sequence. The searching
process iteratively reaches the optimum position that
defines the actual position of the exon. As a result, instead
of searching the entire gene (comprising a number of
exons) in an unknown genome, GPGA separately looks
for each exon of the corresponding gene. Thus, the execution of GPGA is dependent on the number of exons
present in a gene. This representation carries an advantage
in that it breaks up the search space of the gene-finding
problem to a number of smaller subspaces, thereby
reducing the computational complexity. It eventually
reduces the possibility to be stuck up in a local optimum.
Population initialization
In the initialization step, an integer based initial population of size N is randomly generated within a lower and
an upper limit. Each individual or a chromosome Pi, ∀ i
∈ {1, 2,…, N} is an integer value that represents a probable location of an exon (E) in the query genomic
sequence (Q). The lower and the upper limits define the
lowest and the highest probable exon’s position in Q. The
lower limit (l) defines the starting position of Q i.e., 1. The
upper limit (u) is the difference between the length of Q
and the exon (E) length, i.e., if the length of Q is q and the
length of E is e, the upper limit u is (q – e).
Fitness function
The fitness score of a chromosome represents the alignment score. The alignment finds the presence of a
conserved region (exon) in the query sequence. In the
score calculation, we have considered that an identical
match gets +1, and a mismatch gets a 0. Thus, the score
is computed by the following fitness function,
F ¼ Σwi ; ∀i∈ð1; 2; …; nÞ
ð1Þ
where wi defines a local alignment score and n is the
Fig. 6 Fitness score calculation in GPGA
total number of local alignments. wi > 0, if any locally
matched portion is found, otherwise, wi = 0.
Therefore, the fitness value (F) of a chromosome
denotes the summation of all local alignment scores.
Now, let the chromosome be P1. The fitness score
calculation of P1 is shown in Fig. 6.
Figure 6 shows five local alignment scores for P1.
According to the Eq. 1, the fitness score of P1 is F
(P1) = 2 + 3 + 1 + 1 + 1 = 8.
Genetic operators
Three genetic operators namely, selection, crossover, and
mutation play an important role towards the convergence of the problem. These operators also maintain a
balance between the exploration and exploitation of the
search space.
Selection operator
In GPGA, we have considered tournament selection technique with tournament size 3 as a selection operator. In
this approach three individuals are chosen randomly from
the population pool Pi, ∀ i ∈ {1, 2,…, N} and are entered
into the tournament. Based on the fitness value, the fittest
individual among three will be selected to take part in the
crossover operation. This process is continued along with
crossover and mutation until an entirely new population
P’j, ∀ j ∈ {1, 2,…, N} is generated.
Crossover operator
In the GPGA, we have considered a modified crossover
operation named as Adaptive Position Prediction (APP)
crossover. APP crossover is a self-controlled-crossover
operation that adaptively modifies l and u depending on
the fitness scores of parents. Let us consider two parents
(say, Pa and Pb) are randomly selected from the population
pool. Now, let, the fitness (alignment) score of Pa and Pb be
Paobj and Pobj
b , respectively. By this operation, two offsprings
(say, P’a and P’b) are generated from the selected parents. To generate offsprings, APP crossover can narrow
down the l and u if the Paobj and Pobj
b are high. However,
the maximum fitness score of a parent will never exceed
e (the length of the exon). If the score is e, then it is
considered that the optimal exon region is found and
the exon (E) is entirely overlapped. On the other hand,
if the score is either close to e, then it is considered as
the suboptimal exon region and a part of the exon (E)
is overlapped. Then the APP crossover narrows down
Chowdhury et al. BMC Bioinformatics (2017) 18:460
the range of limits l and u close to the parents to search
for offsprings. The default cutoff score for a suboptimal
exon region is selected as 50% of the maximum fitness
score, i.e., e/2. On the other hand, if Paobj and Pobj
are
b
less than e/2, then P’a and P’b are randomly produced
by choosing random positions from the unmodified l
and u.
Thus, the crossover operation helps to predict the
correct exon position by adaptively narrowing down
the difference between l and u. This adaptive nature
helps in fine-tuning of the operator for converging to
the optimal position.
The APP crossover operation is represented algorithmically in the following way.
Page 10 of 13
offspring (P″a) is generated from the narrowed down,
new lower limit (lm) and new upper limit (um).
However, if P’aobj < e/2, then P″a is generated randomly
from the unmodified l and u.
The algorithmic steps of the APP mutation operation
are given below.
Termination
The process is terminated when the maximum number
of iterations (generations), Gmax is reached. However, to
reduce the computation time without compromising the
accuracy level, another termination criterion based on
the fitness score of the best individual is set. If the score
of the best solution remains unchanged for 200 consecutive generations, then the process is stopped.
Now, the proposed GPGA has represented algorithmically in the following way.
Mutation operator
The mutation operation is performed similarly to the
APP crossover. It is also named as Adaptive Position
Prediction (APP) mutation. It mutates the offspring
generated from the crossover operation to another
possible offspring to maintain the diversity in the
population for faster searching for the optimal position
of the given exon (E). Let, the fitness score of an
offspring P’a be P’aobj. If P’aobj ≥ e/2, then the modified
1. Read the unknown genomic sequence (Q) and the
reference exon sequence (known) (E) which is to be
mapped.
2. Initialize the population size N, AAP crossover
probability (Pcross), AAP mutation probability (Pmut)
and G = 1
3. Generate an initial population Pi,
i ϵ {1, 2,…,N} of
N individuals(chromosomes). Where each
chromosome represents a probable starting position
of E in Q.
4. Evaluate the potential of each individual Pi,
i ϵ {1,
2,…,N} in terms of fitness score based on the
objective function F (discussed in Fitness Function).
Chowdhury et al. BMC Bioinformatics (2017) 18:460
Page 11 of 13
5. Select individuals from the pool of N individuals
using the tournament selection with tournament size
3 and pick up two best individuals Pa and Pb based
on fitness value.
6. Perform the AAP crossover operation (discussed in
Crossover operator) with Pcross between the selected
individuals Pa and Pb and mutate them (discussed in
Mutation operator) with mutation probability, Pmut.
7. Each pair of the individual (Pa and Pb) generates two
children P’a and P’b.
8. Repeat steps 5 – 7 until a new pool of individuals P’i,
i ϵ {1, 2,…,N} is formed and G = G + 1.
9. Stop the process if the termination criterion is satisfied
(discussed in Termination). Otherwise, go to step 4.
GPGA parameters
In the proposed method, we considered the values of
N = 200 and Gmax = 3000. Since the computational time
increases with Gmax value, we set the termination criterion based on the convergence of the best fitness score
(see Termination). This approach always prevents the
unwanted computation of GPGA up to Gmax. The
optimum value of N was set to 200 as it produced the
best results in the experiment. For GPGA, we allowed
crossover and mutation operations to perform in every
iteration to converge faster to an optimal solution. As a
result, we set up Pcross = 1, and Pmut = 1. This eventually
relieves the user to choose specific values for Pmut and
Pcross. Thus, the user with less or no prior knowledge of
the GA can run GPGA very easily without concerning
about the optimal values of pcross and pmut.
Evaluation of prediction accuracy
Gene prediction accuracy of GPGA was computed at the
level of exons. We followed the standard measures of
sensitivity (ESn, and ME) and specificity (ESp, and WE)
for evaluating the performance accuracy as described
previously [60], and are formulated below.
Number of correctly predicted exons ðCEÞ
Sensitivity ðESnÞ ¼
;
Number of actual exons
Number of Missing exons
ME ¼
Number of Actual exons
ð2Þ
Specificity ðESpÞ ¼
WE ¼
Additional file 1: Statistical analysis and Table S1-S4. Table S1.
Performance analysis of GPGA on different benchmark datasets.
Considered statistical parameters are Missed exon ratio (ME), Wrong
Exons ratio (WE), Sensitivity (ESn), Specificity (ESp), and Average (EAvg).
Table S2. A summary of the description of each tool considered in this
study for comparison with the proposed method (GPGA). Name of the
tools are mentioned alphabetically. Table S3. Comparative analysis of
different gene prediction tools on the HMR195 dataset. Numbers of
sequences are carefully selected for which the tools were defined so that
the tools analyzed the sequences effectively. Table S4. Comparative
analysis of different gene prediction tools on the SAG dataset.
(PDF 136 kb)
Additional file 2: Table S5. Comparative analysis of missed exons and
wrong exons on HMR195 datasets. Table S6. comparative analysis of
missed exons and wrong exons on SAG datasets. (XLS 30 kb)
Additional file 3: Accuracy of GPGA in Human Chromosome 21
annotation; Table S7-S10; Figure S1 (a) and (b). Table S7. Total number of
conserve blocks, exons, genes (along with overlapping/partial genes), and
pseudogenes of HS21 predicted by GPGA for different stringency criteria.
Table S8. The analysis of residue substitution position in a triplet codon.
Table S9. percentage of residue substitution (between A and T, A and G,
A and C, T and G, T and C, G and C) along with its positional preference
in a codon for the final stringency criterion (100-70). Table S10. Distribution of conserved blocks and genes along the length of HS21. Figure S1
(a). schematic representation of positional biasness for substitution in a
triplet codon; (b). Schematic representation of the rate of base substitution between A and T; A and G; A and C; T and G; T and C; G and C. (PDF
202 kb)
Abbreviations
A: Adenosine; APP: Adaptive Position Prediction; BLAT: Blast Like Alignment
Tool; bp: Base pair; C: Cytidine; cDNA: complementary DNA; CDS: CoDing
Sequence; DNA: DeoxyriboNucleic Acid; DP: Dynamic Programing;
Eavg: average at Exon level; ESn: Sensitivity at Exon level; ESp: Specificity at
Exon level; EST: Expressed Sequence Tag; G: Guanosine; GA: Genetic
Algorithm; GPGA: Gene Prediction with Genetic Algorithm; HMM: Hidden
Markov Models; HMR: Human: Mouse: Rat; HS21: Homo Sapience 21;
ME: Missed Exon; MM 10,16,17: Mus musculus 10, 16, 17; NGS: NextGeneration Sequencing; RefSeq: Reference Sequence; RNA: RiboNucleic Acid;
RNA-seq: RNA sequenceing; SAG: Semi Artificial Genome; T: Thymidine;
WE: Wrong Exon
Acknowledgments
The authors would like to sincerely thank the reviewers for their helpful and
constructive suggestions and comments to improve the quality of the paper.
Funding
Not applicable.
Availability of data and materials
The datasets used and/or analysed during the current study are available
from the corresponding author on reasonable request.
ð3Þ
Authors’ contributions
BC carried out all biological data processing, biological analysis, genetic
algorithm implementation and wrote the final version of the manuscript. AG
developed the final version of the GPGA, analysed the outcome of GPGA
and developed new crossover and mutation scheme for GPGA, and wrote
initial version of the manuscript. The work is done under the guidance of
GG. All authors contributed to and approved the final version of the
manuscript.
ð4Þ
Ethics approval and consent to participate
Not applicable.
Number of correctly predicted exons ðCEÞ
;
Number of predicted exons
Number of Wrong exons
Number of Predicted exons
AverageðEavg:Þ ¼ ðESn þ ESpÞ=2
Additional files
The predicted exon is regarded as correct only if its
both sides’ boundaries are predicted correctly.
Consent for publication
Not applicable.
Chowdhury et al. BMC Bioinformatics (2017) 18:460
Competing interests
The authors declare that they have no competing interests.
Author details
1
Department of Biophysics, Molecular Biology and Bioinformatics, University
of Calcutta, Kolkata 700009, WB, India. 2Unit of Energy, Utilities,
Communications and Services, Infosys Technologies Ltd., Bhubaneswar
751024, Odisha, India. 3Computational Sciences Division, Saha Institute of
Nuclear Physics, Kolkata 700064, WB, India.
Received: 14 June 2017 Accepted: 17 October 2017
References
1. Liu L, Li Y, Li S, Hu N, He Y, Pong R, Lin D, Lu L, Law M. Comparison of nextgeneration sequencing systems. J Biomed Biotechnol. 2012;2012:1–11.
2. Burge C, Karlin S. Prediction of complete gene structures in human
genomic DNA. J Mol Biol. 1997;268:78–94.
3. Reese MG, Kulp D, Tammana H, Haussler D. Genie—gene finding in
Drosophila melanogaster. Genome Res. 2000;10:529–38.
4. Salamov AA, Solovyev VV. Ab initio gene finding in drosophila genomic
DNA. Genome Res. 2000;10:516–22.
5. Parra G, Blanco E, Guigó R. Geneid in drosophila. Genome Res. 2000;10:511–5.
6. Snyder EE, Stormo GD. Identification of protein coding regions in genomic
DNA. J Mol Biol. 1995;248:1–18.
7. Xu Y, Mural R, Shah M, Uberbacher E. Recognizing exons in genomic
sequence using GRAIL II. Genet Eng. 1994;16:241–53.
8. Krogh A. Two methods for improving performace of a HMM and their
application for gene finding. In: Gaasterland T, Karp P, Karplus K, Ouzounis C,
Sander C, Valencia A, editors. The fifth international conference on intelligent
Systems for Molecular Biology. CA: Menlo Park: AAAI Press; 1997. p. 179–86.
9. Lukashin AV, Borodovsky M. GeneMark.Hmm: new solutions for gene
finding. Nucleic Acids Res. 1998;264:1107–15.
10. Zhang MQ. Identification of protein coding regions in the human genome
by quadratic discriminant analysis. Proc Natl Acad Sci. 1997;94:565–8.
11. Stanke M, Keller O, Gunduz I, Hayes A, Waack S, Morgenstern B.
AUGUSTUS: ab initio prediction of alternative transcripts. Nucleic Acids
Res. 2006;34:W435–9.
12. Salzberg S, Delcher A, Fasman K, Henderson J. A decision tree system for
finding genes in DNA. J Comp Biol. 1998;5:667–80.
13. Rogic S, Ouellette BF, Mackworth AK. Improving gene recognition accuracy
by combining predictions from two gene-finding programs. Bioinformatics.
2002;18:1034–45.
14. Dunham I, Shimizu N, Roe BA, Chissoe S, Hunt AR, Collins JE, Bruskiewich R,
Beare DM, Clamp M, Smink LJ, et al. The DNA sequence of human
chromosome 22. Nature. 1999;402:489–95.
15. Wiehe T, Gebauer-Jung S, Mitchell-Olds T, Guigo R. SGP-1: prediction and
validation of homologous genes based on sequence alignments. Genome
Res. 2001;11:1574–83.
16. Yeh RF, Lim LP, Burge CB. Computational inference of homologous gene
structures in the human genome. Genome Res. 2001;11:803–16.
17. Birney E, Durbin R: Dynamite: A flexible code generating language for
dynamic programming methods used in sequence comparison. In:
Proceedings of the Fifth International Conference On Intelligent Systems for
Molecular Biology. Menlo Park: The AAAI Press; 1997. p. 56–64.
18. Birney E, Durbin R. Using GeneWise in the drosophila annotation
experiment. Genome Res. 2000;10:547–8.
19. Gelfand MS, Mironov AA, Pevzner PA. Gene recognition via spliced
alignment. PNAS. 1996;93:9061–6.
20. Sze SH, Pevzner PA. Las Vegas algorithms for gene recognition: suboptimal
and error-tolerant spliced alignment. J Comput Biol. 1997;4:297–309.
21. Chuang TJ, Lin WC, Lee HC, Wang CW, Hsiao KL, Wang ZH, Shieh D, Lin SC,
Ch'ang LY. A complexity reduction algorithm for analysis and annotation of
large genomic sequences. Genome Res. 2003;13:313–22.
22. Bailey LC Jr, Fischer S, Schug J, Crabtree J, Gibson M, Overton GC. GAIA:
framework annotation of genomic sequence. Genome Res. 1998;8:234–50.
23. Florea L, Hartzell G, Zhang Z, Rubin GM, Miller W. A computer program for
aligning a cDNA sequence with a genomic DNA sequence. Genome Res.
1998;8:967–74.
24. Wheelan SJ, Church DM, Ostell JM. Spidey: a tool for mRNA-to-genomic
alignments. Genome Res. 2001;11:1952–7.
Page 12 of 13
25. Acencio ML, Lemke N. Towards the prediction of essential genes by
integration of network topology, cellular localization and biological process
information. BMC Bioinf. 2009;10:290.
26. Haas BJ, Salzberg SL, Zhu W, Pertea M, Allen JE, Orvis J, White O, Buell CR,
Wortman JR. Automated eukaryotic gene structure annotation using
EVidenceModeler and the program to assemble spliced alignments.
Genome Biol. 2008;9:R7.1–R7.22.
27. Li X, Ren Q, Weng Y, Cai H, Zhu Y, Zhang Y. SCGPred: a score-based
method for gene structure prediction by combining multiple sources of
evidence. Genom Prot Bioinfor. 2008;6:175–85.
28. Wang Y, Chen L, Song N, Lei X. GASS: genome structural annotation for
eukaryotes based on species similarity. BMC Genomics. 2015;16:1–14.
29. Akhtar M, Epps J, Ambikairajah E. Signal processing in sequence analysis:
advances in eukaryotic gene prediction. IEEE J Sel Top Sign Proces.
2008;2:310–21.
30. Abbasi O, Rostami A, Karimian G. Identification of exonic regions in DNA
sequences using cross-correlation and noise suppression by discrete
wavelet transform. BMC Bioinf. 2011;12:430.
31. Saberkari H, Shamsi M, Heravi H, Sedaaghi MH. A fast algorithm for Exonic
regions prediction in DNA sequences. J Med Signals Sens. 2013;3:139–49.
32. Inbamalar TM, Sivakumar R. Improved algorithm for analysis of DNA
sequences using multiresolution transformation. Sci World J. 2015;2015:1–9.
33. Yu N, Guo X, Gu F, Pan Y. Signalign: an ontology of DNA as signal for
comparative gene structure prediction using information-coding-andprocessing techniques. IEEE Trans Nanobioscience. 2016;15:119–30.
34. Perez-Rodriguez J, Garcia-Pedrajas N. An evolutionary algorithm for gene
structure prediction. Ind Eng Other Appl Appl Intell Syst II. 2011;6704:386–95.
35. Amouda V, Selvaraj V, Kuppuswami S. iMAGA: Intron multiple alignment
using genetic algorithm. Int J Eng Sci and Tech. 2010;2:6360–9.
36. Hwang KB, Ha BY, Ju S, Kim S. Partial AUC maximization for essential gene
prediction using genetic algorithms. BMB Rep. 2013;46:41-6.
37. Cheng J, Wu W, Zhang Y, Li X, Jiang X, Wei G, Tao S. A new computational
strategy for predicting essential genes. BMC Genomics. 2013;14:910.
38. Langmead B, Salzberg S. Fast gapped-read alignment with Bowtie 2. Nat
Methods. 2012;9:357–9.
39. Li H, Durbin R. Fast and accurate long-read alignment with burrowswheeler transform. Bioinformatics. 2010;26:589–95.
40. Thomas DW, Serban N. Fast and SNP-tolerant detection of complex variants
and splicing in short reads. Bioinformatics. 2010;26:873–81.
41. Ensembl genome browser. .
Accessed 21 Sept 2015.
42. UCSC Genome Browser. .
Accessed 24 Apr 2016.
43. Rogic S, Mackworth AK, Ouellette FB. Evaluation of gene finding programs
on mammalian sequences. Genome Res. 2001;11:817–32.
44. Guigó R, Agarwal P, Abril JF, Burset M, Fickett JW. An assessment of gene
prediction accuracy in large DNA sequences. Genome Res. 2000;10:1631–42.
45. Issac B, Raghava GPS. GeneBench: A Suite of Tools and Datasets for
Benchmarking Gene Finders. />results.html. Accessed 2 Aug 2017.
46. Cai Y, He Z, Hu L, Li B, Zhou Y, Xiao H, Wang Z. Feng k, Lu L, Feng K, Li H.
Gene finding by integrating gene finders. J Biomed Sci Eng. 2010;3:1061–8.
47. Marhon SA, Kremer SC. A brief comparison of DSP and HMM methods for
gene finding. Proceedings of the ACM Conference on Bioinformatics,
Computational Biology and Biomedicine. USA: NY; 2012. p.582-84.
48. Steijger T, Abril JF, Engström PG, Kokocinski F, Hubbard TJ, Guigó R, Harrow J,
Bertone P. Assessment of transcript reconstruction methods for RNA-seq. Nat
Methods. 2013;10:1177–84.
49. Kent WJ. BLAT–the BLAST-like alignment tool. Genome Res. 2002;12:656–64.
50. Goel N, Singh S, Aseri TC. A comparative analysis of soft computing
techniques for gene prediction. Anal Biochem. 2013;438:14–21.
51. NCBI Homology Maps. />maps/human/chr21. Accessed 10 Mar 2016.
52. NCBI Assembly. />Accessed 20 Mar 2016.
53. Dermitzakis ET, Reymond A, Lyle R, Scamuffa N, Ucla C, Deutsch S,
Stevenson BJ, Flegel V, Bucher P, Jongeneel CV, Antonarakis SE. Numerous
potentially functional but non-genic conserved sequences on human
chromosome 21. Nature. 2002;420:578–82.
54. Goldberg DE. Real-coded genetic algorithms, virtual alphabets, and
blocking. Complex Syst. 1991;5:139–67.
Chowdhury et al. BMC Bioinformatics (2017) 18:460
Page 13 of 13
55. Radcliffe NJ. Equivalence class analysis of genetic algorithms. Complex Syst.
1991;5:183–205.
56. Michalewicz Z. Genetic algorithms + data structures = evolution programs:
Springer-Verlag; 1996.
57. Eshelman LJ, Schaffer JD. Real-Coded Genetic Algorithms and Interval-Schemata.
In: Whitley LD, editor. Foundation of Genetic Algorithms. San Mateo : Morgan
Kaufmann Publishers; 1993. Vol. 2, p.187–202.
58. Chowdhury B, Garai G. A cascaded pairwise bio-molecular sequence
alignment technique using evolutionary algorithm. Inf Sci. 2015;297:118–39.
59. Deb K, Agrawal S. A niched-penalty approach for constraint handling in
genetic algorithms. Proceedings of the international conference on
artificial neural networks and genetic algorithms. Vienna: Springer
Vienna; 1999. p. 235–43.
60. Burset M, Guigo R. Evaluation of gene structure prediction programs.
Genomics. 1996;34:353–67.
Submit your next manuscript to BioMed Central
and we will help you at every step:
• We accept pre-submission inquiries
• Our selector tool helps you to find the most relevant journal
• We provide round the clock customer support
• Convenient online submission
• Thorough peer review
• Inclusion in PubMed and all major indexing services
• Maximum visibility for your research
Submit your manuscript at
www.biomedcentral.com/submit